
Protein Ingredients Market Size and Share
Market Overview
| Study Period | 2021 - 2031 |
|---|---|
| Market Size (2026) | USD 29.77 Billion |
| Market Size (2031) | USD 38.21 Billion |
| Growth Rate (2026 - 2031) | 5.12 % |
| Fastest Growing Market | Middle East and Africa |
| Largest Market | North America |
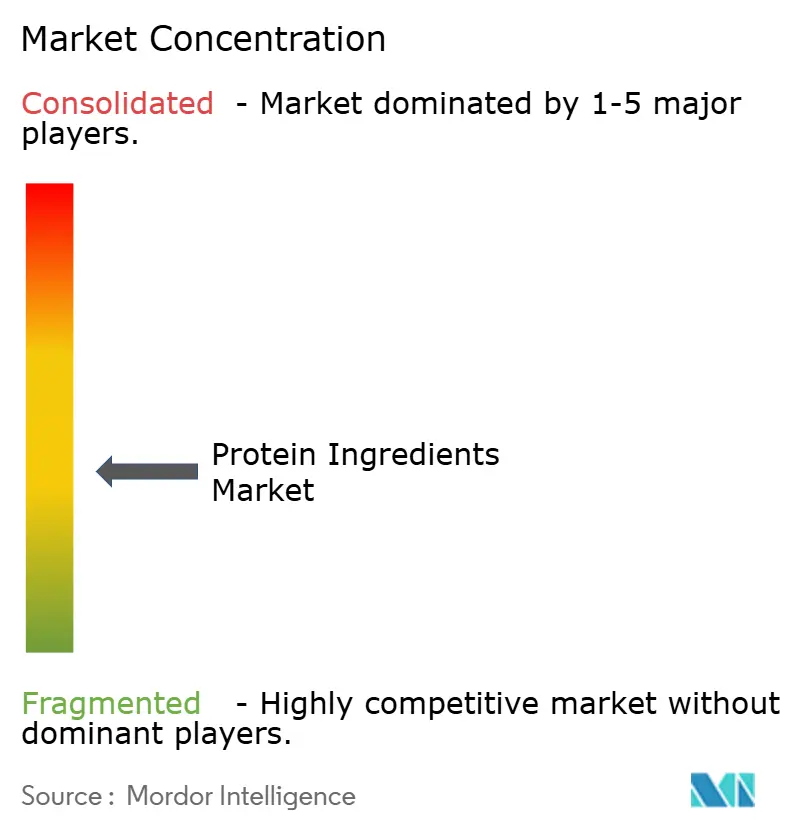
| Market Concentration | Medium |
Major Players *Disclaimer: Major Players sorted in no particular order Image © Mordor Intelligence. Reuse requires attribution under CC BY 4.0. | |
Protein Ingredients Market Analysis by Mordor Intelligence
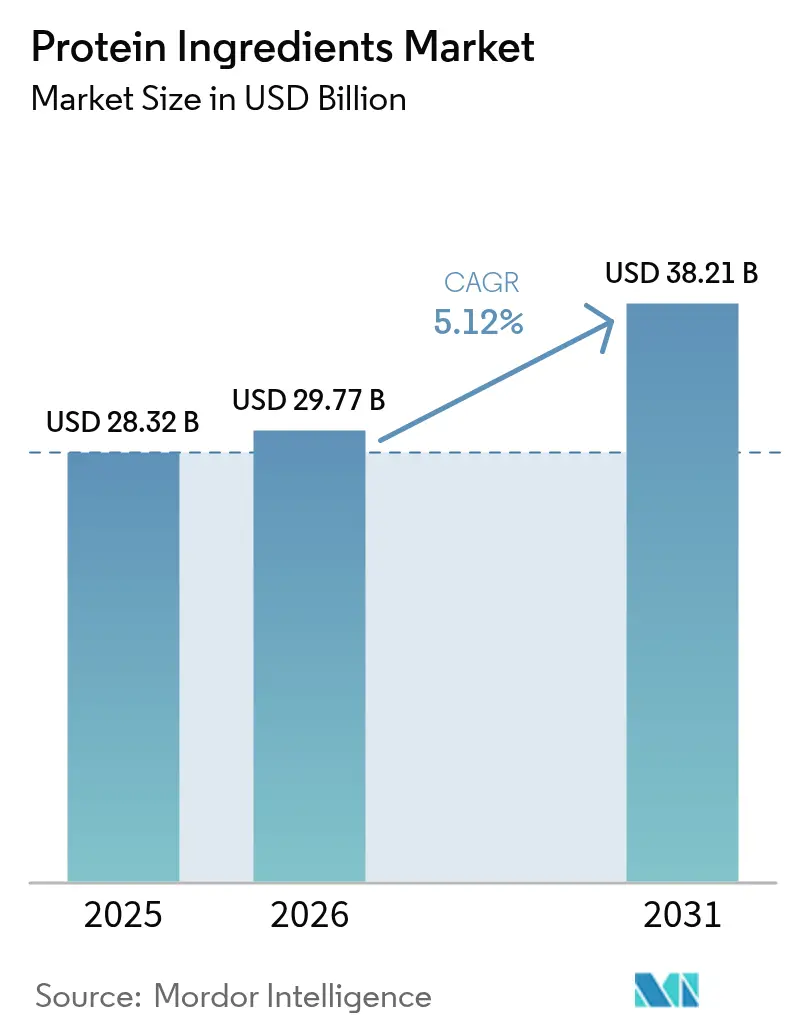
The protein ingredients market size was valued at USD 28.32 billion in 2025 and estimated to grow from USD 29.77 billion in 2026 to reach USD 38.21 billion by 2031, at a CAGR of 5.12% during the forecast period (2026-2031). The market growth is driven by increasing demand for diverse and sustainable protein sources, expansion in precision-fermentation capabilities, and robust demand from functional food, beverage, and supplement segments. Plant proteins dominate the market due to expanded regulatory approvals for new crops, while microbial protein production is increasing due to its efficient production methods. North America continues to be the largest revenue generator, with the Middle East showing potential for significant growth through investments in food security initiatives. In technological developments, protein isolates and hydrolysates are gaining market share in premium segments by addressing solubility and taste challenges in ready-to-drink products. The market shows moderate competition, with established agribusiness companies expanding their traditional soy and dairy offerings through biotechnology partnerships, while new entrants develop innovative protein solutions.
Key Report Takeaways
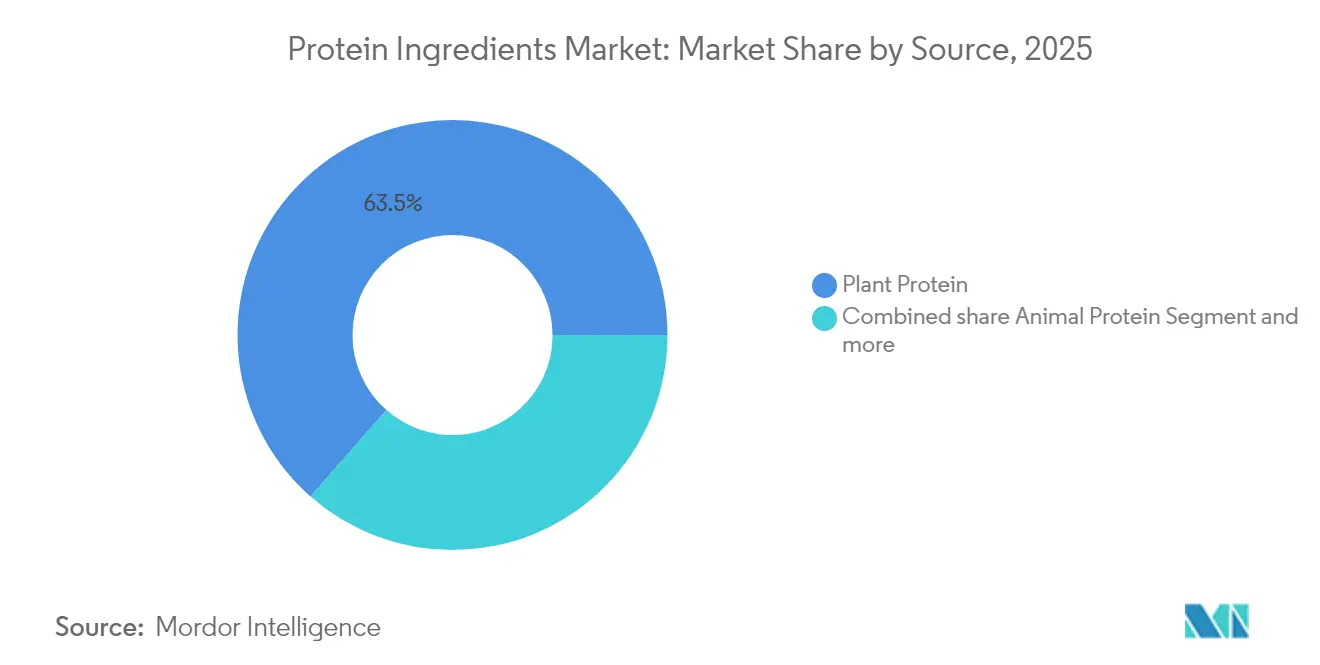
- By source, plant proteins accounted for 63.52% of protein ingredients market share in 2025, while microbial proteins are projected to expand at a 6.29% CAGR to 2031.
- By form, concentrates led with 44.62% revenue share in 2025; isolates are forecast to advance at an 8.18% CAGR through 2031.
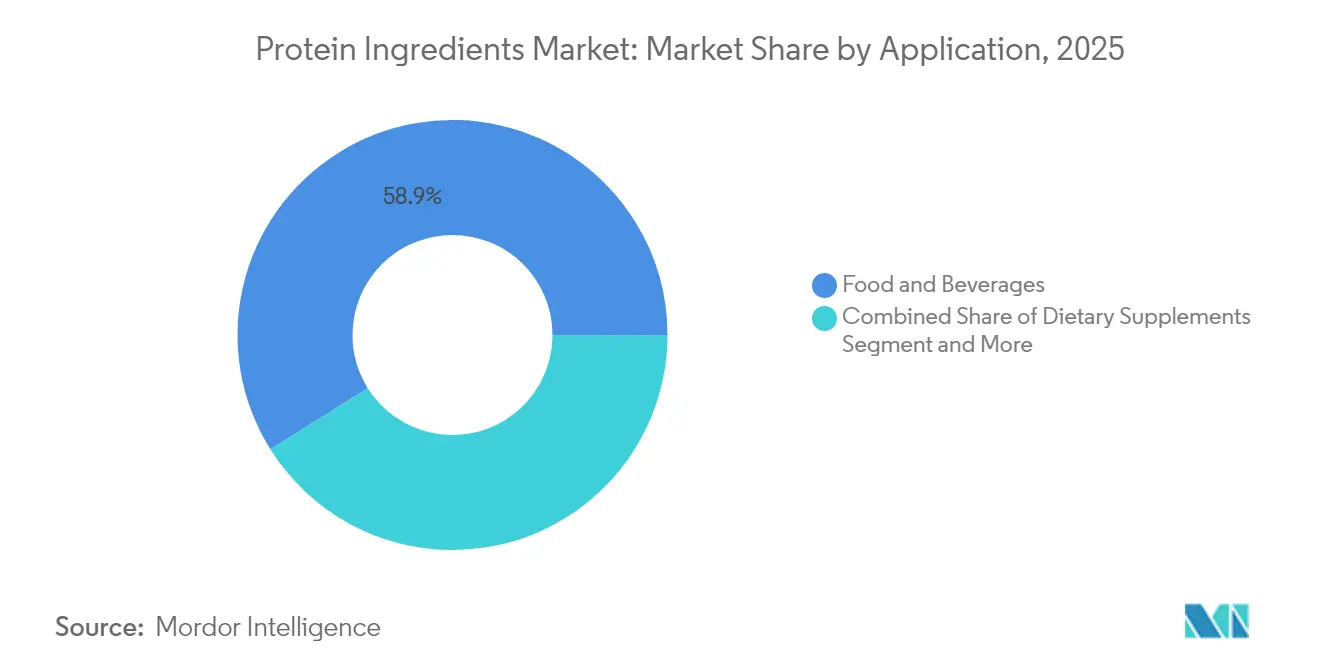
- By application, food and beverage commanded 58.92% of the protein ingredients market size in 2025; dietary supplements and sports nutrition are tracking the fastest growth at 6.12% CAGR to 2031.
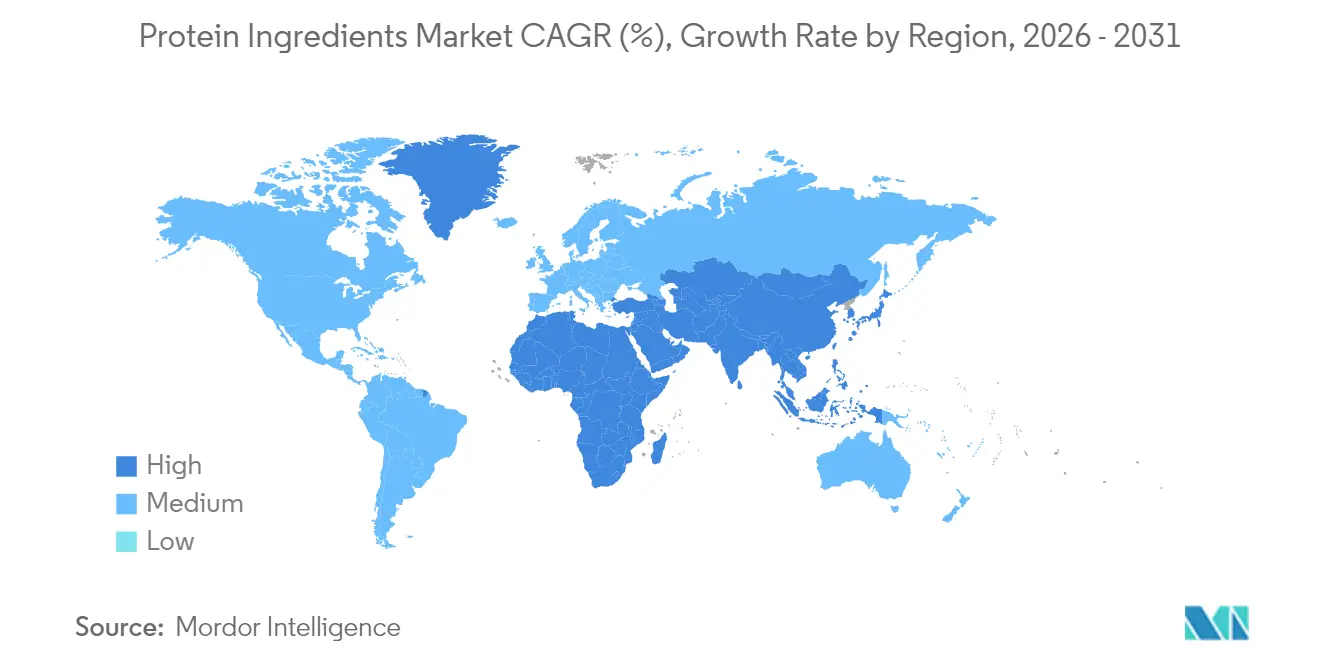
- By geography, North America captured 29.10% of protein ingredients market share in 2025, whereas the Middle East and Africa region is set to grow at 6.41% CAGR over the forecast period.
Note: Market size and forecast figures in this report are generated using Mordor Intelligence’s proprietary estimation framework, updated with the latest available data and insights as of 2026.
Market Trends and Insights
Drivers Impact Analysis of Protein Ingredients Market*
| Driver | (~) % Impact on CAGR Forecast | Geographic Relevance | Impact Timeline |
|---|---|---|---|
| Growing consumer preference for ready-to-drink protein beverages | +1.2% | Global, with North America and Europe leading adoption | Medium term (2-4 years) |
| Growing production of plant-based meat | +0.9% | North America, Europe, Asia-Pacific core markets | Long term (≥ 4 years) |
| Rising demand for nutritional, fortified and functional foods | +0.8% | Global, with emerging markets showing accelerated growth | Medium term (2-4 years) |
| Increasing demand for sports nutrition | +0.7% | North America, Europe, with spillover to Asia-Pacific | Short term (≤ 2 years) |
| Aging population and rising adoption of preventive healthcare | +0.6% | Global, concentrated in developed economies | Long term (≥ 4 years) |
| Increased application in animal feed and pet food | +0.5% | Global, with Asia-Pacific and North America leading | Medium term (2-4 years) |
| Source: Mordor Intelligence | |||
Growing Consumer Preference for Ready-to-Drink Protein Beverages
The global market shows an increase in ready-to-drink (RTD) beverage launches with protein content, driving suppliers to develop isolates with improved solubility and heat stability for acidic, shelf-stable products. Precision-fermentation technology allows manufacturers to produce casein and whey alternatives that match dairy functionality without cold-chain requirements. This development has shifted procurement focus from commodity costs to bio-identical performance capabilities. The growth in beverages requires protein manufacturers to create refined, specialized hydrolyzed forms that offer better dispersibility with minimal flavor impact. For instance, companies such as Future Cow are investing in precision fermentation to produce bioidentical milk proteins through yeast fermentation, providing dairy functionality without traditional supply limitations. These technological advancements have made processing compatibility and functional performance key factors in ingredient selection.
Growing Production of Plant-based Meat
Advances in plant-based meat production are fundamentally transforming protein extraction and texturization processes across the global food manufacturing industry. Advanced seed-breeding techniques have yielded peas with 75% protein content, significantly reducing processing requirements and energy consumption throughout the entire manufacturing chain. Major agricultural companies are strategically adapting their business models by investing heavily in alternative protein production facilities, research and development, and innovative technologies. Cargill's February 2024 expansion of its partnership with ENOUGH aims to increase mycoprotein production to over 1 million tons by 2033, highlighting the substantial shift in production capabilities and market demand. The rapid growth of plant-based meat has also influenced regulatory frameworks and compliance requirements, as evidenced by the FDA's revised guidelines for protein quality assessment, which extend beyond the traditional PDCAAS (Protein Digestibility-Corrected Amino Acid Score) method to evaluate complex new protein combinations, formulations, and nutritional profiles in alternative meat products.[1]
Rising Demand for Nutritional, Fortified and Functional Foods
The functional foods segment is experiencing a comprehensive transformation in its approach to protein ingredients, with manufacturers increasingly focusing on components that deliver sophisticated, targeted health benefits extending well beyond conventional nutritional value. This evolution has led to the emergence of specialized market categories and premium pricing structures. Protein ingredients are advancing into advanced bioactive applications, where scientifically engineered collagen peptides for precise glycemic control, technologically advanced precision-fermented lactoferrin, and highly refined osteopontin are being strategically integrated into premium infant formula products and comprehensive healthy-aging solutions. The European Union's progressive novel-food clearances for insect-derived protein powders demonstrate the growing regulatory acceptance and market validation of alternative protein sources that efficiently deliver both high-quality protein content and essential functional micronutrients. These significant market developments have contributed to a substantial increase in average selling prices across various product categories, effectively maintaining robust profit margins even during periods of downward pressure on commodity protein prices in the global market.
Increasing Demand for Sports Nutrition
The sports nutrition segment drives innovation in protein ingredients, with manufacturers focusing on improving absorption rates and bioavailability. Technical specifications differentiate premium products from standard offerings in the market. Current sports nutrition formulations incorporate rapid-absorption hydrolysates, specific amino-acid ratios, and natural processing aids to enhance performance. Growing demand in the Asian market has increased the need for protein-electrolyte beverages and acidified milk products, which require proteins with low viscosity and stability across temperature and pH ranges. Manufacturers with global food-safety certifications gain competitive advantages, particularly among consumers who value supply chain transparency. The trend toward clean-label protein ingredients continues, as demonstrated by Kemin obtaining Global Food Safety Initiative (GFSI) certification in June 2024 for their Proteus functional proteins, addressing consumer demands for transparency and quality standards.
Restraints Impact Analysis of Protein Ingredients Market*
| Restraint | (~) % Impact on CAGR Forecast | Geographic Relevance | Impact Timeline |
|---|---|---|---|
| Stringent regulatory environment | -0.8% | Global, with Europe and United States having most complex frameworks | Long term (≥ 4 years) |
| Growing allergen concerns | -0.6% | Global, with developed markets showing highest sensitivity | Medium term (2-4 years) |
| Solubility challenges in plant-based protein beverages | -0.4% | Global, with North America and Europe leading RTD adoption | Short term (≤ 2 years) |
| Flavor and texture limitations | -0.3% | Global, with Asia-Pacific showing highest sensitivity to taste | Medium term (2-4 years) |
| Source: Mordor Intelligence | |||
Stringent Regulatory Environment
The regulatory approval process for novel protein ingredients presents significant market entry barriers, as approval timelines frequently extend beyond standard product development cycles, benefiting established companies. The European Food Safety Authority's (EFSA) 2025 guidelines require comprehensive documentation for toxicity testing, allergenicity assessments, and detailed production strain analysis, including genetic stability data and metabolic characterization, increasing barriers and giving advantages to companies with in-house regulatory expertise.[2] For insect protein manufacturers, the regulatory landscape is particularly complex, requiring simultaneous compliance with both novel food regulations and animal feed approval processes across multiple jurisdictions. including the EU's Novel Food Regulation, the FDA's GRAS notification system, and various Asia-Pacific regulatory frameworks. This complex regulatory environment drives market consolidation, favoring companies that possess established regulatory expertise and sufficient financial resources to manage extensive documentation requirements and multi-year approval processes.
Growing Allergen Concerns
The emergence of novel protein sources has increased the complexity of allergen management due to new allergenic profiles that current testing methods may not effectively detect. This creates liability concerns and slows market adoption. The risk of cross-reactivity between insect proteins and crustacean allergens, along with post-translational modifications in fermented proteins, requires new detection protocols and clear labeling practices. The European Commission's requirement for explicit allergen statements on insect-derived foods may limit market adoption until consumers become more familiar with these products. Plant protein allergen concerns are expanding beyond traditional sources like soy and wheat to include emerging proteins from legumes and novel crops, requiring more sophisticated allergen management systems throughout the supply chain. Companies that can demonstrate comprehensive allergen control capabilities gain competitive advantages as the industry invests in advanced detection technologies to address these complex allergen profiles.
*Our forecasts treat driver/restraint impacts as directional, not additive. The impact forecasts reflect baseline growth, mix effects, and variable interactions.
Protein Ingredients Market Segment Analysis
By Source:
Plant Proteins Lead Sustainable TransformationPlant proteins dominated with 63.52% of protein ingredients market revenue in 2025, supported by European Union approval for high-yield aquatic crops like duckweed in February 2025, which achieves 43% protein content.This significant market share reflects increasing consumer demand for plant-based alternatives and substantial investments in production infrastructure. The plant-based protein ingredients market is expected to grow steadily through 2031, driven by new large-scale fractionation facilities in North America and Europe, enhanced processing technologies, and expanding applications across food and beverage sectors. Microbial proteins, while an emerging segment, are growing at a 6.29% CAGR, benefiting from CO₂-fed fermentation systems that minimize land and water usage while improving sustainability metrics. These innovative production methods are attracting significant research and development investment from major food manufacturers.
The industry is evolving toward sophisticated hybrid protein formulations that combine plant, microbial, and select animal-source proteins to optimize nutrition, functionality, and cost. These blends address specific market needs across various applications, from sports nutrition to meat alternatives. While dairy-derived whey and casein proteins remain important in applications requiring complete amino-acid profiles and established supply chains, their market share is decreasing as alternative proteins gain regulatory approval and demonstrate improved functionality. Insect proteins represent a small but significant segment, with mealworm approvals in pet food applications creating potential pathways for future human food applications. The segment is experiencing increased investment in production facilities and research into extraction methods.

By Form:
Isolates Drive Premium ApplicationsConcentrates maintained a dominant market share of 44.62% in 2025, attributed to their cost-effectiveness, versatility, and broad applicability across food products, including baked goods, snacks, and processed foods. The lower production costs and simpler processing requirements make concentrates particularly attractive for mass-market applications. Isolates are projected to grow at an 8.18% CAGR, driven by beverage and clinical-nutrition manufacturers requiring proteins with ≥90% purity for clean label claims, enhanced functionality, and superior nutritional performance. The launch of NUTRALYS Fava S900M by Roquette in May 2024, achieving 90% protein content in fava bean isolates, demonstrates the technological advancements in extraction and purification processes supporting isolate adoption in premium applications.
Hydrolyzed and textured protein variants serve distinct market segments: hydrolysates provide rapid absorption and improved digestibility for sports nutrition products, medical foods, and infant formulas, while textured proteins create the complex fibrous structures and meat-like texture needed for plant-based burgers, nuggets, sausages, and other meat alternatives. The implementation of continuous-flow enzymatic processes and energy-efficient membrane systems increases production yields across all protein forms while reducing water consumption, helping companies meet both profitability targets and environmental sustainability goals in their manufacturing operations. These technological improvements have also led to enhanced protein quality, reduced processing time, and improved cost efficiency across the production chain.
By Application:
Food & Beverage Dominance with Supplement GrowthFood and beverage applications account for 58.92% of the protein ingredients market share in 2025, driven by extensive protein fortification across bakery products, dairy items, snack foods, and ready-to-drink beverages. Product development focuses on advanced clean-label stabilization techniques to maintain product texture, mouthfeel, flavor profiles, and shelf stability with increased protein content. The supplements and sports nutrition segments are growing at a 6.12% CAGR, driven by increased consumer adoption of active lifestyles, widespread e-commerce accessibility through platforms like Amazon and specialized retailers, and scientifically validated product claims supported by clinical studies.
The animal feed and pet food segments are experiencing rapid transformation with insect-based proteins (black soldier fly larvae, mealworms) and single-cell protein alternatives (yeast, algae, bacteria) replacing traditional fishmeal sources, reducing supply chain uncertainties and environmental impacts such as overfishing and marine ecosystem disruption. The personal care segment is incorporating specialized collagen and elastin peptides in topical formulations, including anti-aging serums, moisturizing creams, and regenerative lotions, creating market opportunities for manufacturers who can comply with both food and cosmetic Good Manufacturing Practice standards while ensuring product efficacy and safety.
Geography Analysis
North America Protein Ingredients Market
North America accounts for 29.10% of 2025 revenue, influencing global specifications through its advanced dairy processing and biotechnology infrastructure. The region's sophisticated processing facilities, research institutions, and established supply networks create an ecosystem that sets industry standards. The United States and Canada are expanding capacity through significant investments in plant protein extraction facilities and precision fermentation technologies, while efficient regulatory frameworks facilitate new product introductions across multiple protein categories.
Europe Protein Ingredients Market
Europe maintains growth through favorable novel food policies and consumer adoption of sustainable diets. The region's comprehensive regulatory framework and streamlined approval process has accelerated the commercialization of alternative proteins. Insect farming operations, algae cultivation facilities, and mycelium-based protein production centers are scaling up operations, with mainstream retailers incorporating these ingredients into an expanding range of private-label products.
MEA Protein Ingredients Market
The Middle East and Africa region demonstrates the highest growth at 6.41% CAGR, supported by government-backed diversification initiatives. Saudi Arabia's USD 70 million investment in single-cell protein technology encompasses research facilities, production infrastructure, and workforce development programs. The UAE's agricultural land-lease programs in Africa include technology transfer agreements, logistics partnerships, and market access provisions. These initiatives reduce import reliance and establish export-oriented protein ingredient production centers with integrated value chains.
Regulatory Landscape
The protein ingredients regulatory environment is increasingly shaped by pre-market authorization requirements for novel sources and for new production processes, including under Regulation (EU) 2015/2283 (EU Novel Food Regulation) and the United Kingdoms retained novel foods regime. In 2026, the UK Food Standards Agency (FSA) added clarity for fermentation-derived proteins through supplementary guidance for novel foods produced by precision or biomass fermentation (March 2026), while maintaining case-by-case safety assessments, including a January 2026 assessment covering a pea protein fermented with shiitake (Lentinula edodes) mycelia.
In the United States, many protein ingredients continue to enter food use through the FDA Generally Recognized as Safe (GRAS) framework, with a focus on a companys scientific safety substantiation for intended conditions of use. Across markets, regulatory scrutiny is extending beyond safety into nutrition and labeling considerations, including allergen management for emerging proteins and the need to show that substitutes are not nutritionally disadvantageous versus conventional proteins. This is raising the requirements for dossiers, testing, and traceability systems for novel plant, microbial, and insect ingredients.
Competitive Landscape
The protein ingredients market exhibits a concentration ratio of 4 out of 10, indicating moderate fragmentation. Major agribusiness companies strengthen their positions through product development. In January 2025, Axiom Foods introduced Oryzatein 2.0, a rice protein designed for infant food formulations, featuring non-GMO, hexane-free properties with smooth texture and enhanced digestibility.
Companies such as Archer Daniels Midland Company, Cargill Incorporated, Roquette Frères, FrieslandCampina Ingredients, and Kerry Group plc operate in specialized market segments. These organizations differentiate themselves through reduced carbon emissions and clean-label products. They utilize venture capital funding for proprietary technology development and form partnerships with established manufacturers to access markets efficiently.
The market experiences frequent mergers and acquisitions, driven by companies seeking to expand their product portfolios and geographical presence. Industry certifications, exemplified by Kemin's Global Food Safety Initiative approval, strengthen credibility with brand owners and enable integration into multinational supply chains. These certifications also help companies meet stringent regulatory requirements and demonstrate their commitment to quality and safety standards.
Protein Ingredients Industry Leaders
-
Archer Daniels Midland Company
-
Cargill Incorporated
-
Kerry Group plc
-
Roquette Frères
-
FrieslandCampina Ingredients
- *Disclaimer: Major Players sorted in no particular order
Protein Ingredients Market Companies Covered in this Report
- Archer Daniels Midland Company
- Cargill Incorporated
- Kerry Group plc
- Roquette Freres
- Fonterra Co-operative Group Ltd.
- FrieslandCampina Ingredients
- Glanbia plc
- DuPont de Nemours, Inc. (IFF Nourish)
- BASF SE
- Ingredion Incorporated
- Darling Ingredients Inc.
- CP Kelco
- Axiom Foods Inc.
- Burcon NutraScience Corp.
- Tate and Lyle PLC
- MycoTechnology Inc.
- Calysta Inc.
- NOW Foods
- AMCO Protein
- Kewpie Corporation
Market Opportunities and Future Outlook
Premium dairy proteins and specialized proteins for infant, clinical, and sports nutrition offer a clear investment and reformulation pathway, supported by capacity actions in 2026. FrieslandCampina Ingredients completed a strategic expansion of its Borculo facility in the Netherlands in March 2026, doubling production capacity for whey protein isolate (WPI) and milk fat globule membrane (MFGM), and followed in May 2026 with a broader EUR 90 million whey protein capacity expansion and upgrade across sites in the Netherlands. DMK Group announced a EUR 26 million project in May 2026 to add a 7,000-tonne WPC80 line at its Edewecht, Germany facility, and Land O Lakes announced a capital investment in July 2026 to expand high-value dairy protein production at its Tulare, California site, reinforcing the supply chain focus on higher-value concentrates and isolates used in ready-to-drink beverages and performance nutrition.
Regulatory and specification tightening is also creating room for suppliers that can provide validated protein performance alongside compliant formulations for sensitive applications. In March 2026, the EU adopted Delegated Regulation (EU) 2026/743 with new protein-related requirements for infant and follow-on formula using specific protein hydrolysates, which pushes ingredient suppliers toward documented processing controls and consistent hydrolysate profiles. In alternative proteins, commercialization opportunities continue to track progress on novel-food and equivalent approvals, plus the industrialization of purification and functionalization at scale, including fermentation-derived proteins. Programs such as Protein Industries Canadas 2025-26 objectives (year three of a five-year plan) reflect ongoing efforts to attract new capital into ingredient manufacturing and to expand reach into geographies including Singapore and Europe.
Recent Industry Developments in Protein Ingredients Market
- July 2026: Archer Daniels Midland (ADM) announced a partnership with The EVERY Company to commence US-based commercial-scale production of OvoPro egg white protein at ADMs Clinton, Iowa, facility using precision fermentation. The new arrangement expands ADMs footprint in fermentation-enabled proteins and adds a bio-based route to functional egg proteins for applications that require consistent performance and supply security.
- August 2025: ADM announced plans to streamline its soy protein production network, including the closure of its Bushnell, Illinois facility while leveraging capacity at its Decatur, Illinois plant. The consolidation reflects portfolio and asset optimization in established plant proteins, with implications for regional supply arrangements and manufacturing efficiency in soy isolates and concentrates.
- February 2024: Cargill expanded its partnership with ENOUGH to scale ABUNDA mycoprotein through commercial agreements and growth funding. The collaboration supports larger-volume mycoprotein availability for meat analogs and other food applications, strengthening the microbial protein pipeline alongside conventional plant and dairy proteins.
Protein Ingredients Market Report Scope and Research Methodology
Market Definition and Coverage
For this study, the market covers the value of protein ingredients used as functional or nutritional inputs across food and beverage, animal feed, and selected personal care and clinical uses. It includes proteins from animal, plant, microbial, and insect sources, tracked in USD across major regions.
Scope exclusions: Finished consumer products where protein is not sold as an ingredient input, plus on-farm raw commodities before they are processed into ingredient-grade formats, are not counted.
Segments Covered in This Report
- By Source
- Animal Protein
- Dairy Ingredients
- Whey Protein Concentrates
- Whey Protein Hydrolysates
- Whey Protein Isolates
- Casein and Caseinates
- Egg Protein
- Gelatin and Collagen
- Other Animal Proteins
- Dairy Ingredients
- Plant Proteins
- Soy
- Pea
- Wheat
- Rice
- Potato
- Hemp
- Others
- Microbial Proteins
- Mycoprotein
- Algea Protein
- Insect Protein
- Animal Protein
- By Form
- Concentrates
- Isolates
- Textured/Hydrolyzed
- By Application
- Food and Beverage
- Bakery and Confectionery
- Meat Analogs and Extenders
- Dairy Alternatives
- Savoury Snacks and Bars
- Beverages
- Infant and Early-Life Nutrition
- Dietary Supplements and Sports Nutrition
- Animal Feed
- Personal Care and Cosmetics
- Pharmaceuticals and Clinical Nutrition
- Food and Beverage
- By Geography
- North America
- United States
- Canada
- Mexico
- Rest of North America
- Europe
- Germany
- France
- United Kingdom
- Italy
- Spain
- Russia
- Rest of Europe
- Asia-Pacific
- China
- Japan
- India
- Australia
- Rest of Asia-Pacific
- South America
- Brazil
- Argentina
- Rest of South America
- Middle East and Africa
- Saudi Arabia
- United Arab Emirates
- South Africa
- Rest of Middle East and Africa
- North America
Data Sources, Market Sizing, and Validation
Desk Research
Desk research was used to build the starting map of supply, demand, and pricing signals for protein ingredients, before assumptions were stress-tested in interviews. We mainly relied on public, repeatable references such as USDA databases, FAO production and trade series, UN Comtrade-style customs statistics, and food ingredient and dairy association publications, along with peer-reviewed food science journals.
Company annual reports, investor decks, and product specification sheets were also reviewed to understand capacity additions, mix shifts across concentrates versus isolates, and typical application adoption. In parallel, we used paid subscriptions for company financials and intelligence, patent databases, and shipment-level import and export data where it helped confirm trade flows and regional availability. These source examples are illustrative rather than exhaustive, since many other public and paid references were also used for data collection, validation, and research clarification.
Primary Interviews and Surveys
Primary work focused on validating how volumes and pricing move across major sources and end uses, since many ingredients are traded under broad categories and need practical checks. We spoke with a mix of ingredient suppliers, distributors, brand and formulation teams, and downstream buyers across APAC, EMEA, and the Americas so adoption rates, substitution patterns, and margin ladders could be triangulated with lived purchasing behavior. When desk inputs suggested large swings, we went back to respondents to re-check the assumption before it was used in the final model.
Distribution of primary research fieldwork respondents
| Company type | Respondent position | Region |
|---|---|---|
| Top tier: 32% | CXOs: 14% | APAC: 42% |
| Mid tier: 52% | Functional/Unit leaders: 31% | EMEA: 34% |
| Smaller Players: 16% | Managers: 55% | Americas: 24% |
Market-Sizing & Forecasting
Sizing started with a top-down build where protein ingredient demand was reconstructed by linking source-level production and trade indicators to application pull in food, feed, and selected non-food uses, then translated into value using observed pricing ranges. To keep totals realistic, the model was corroborated with selective bottom-up approximations, such as sampled supplier revenue splits, channel checks for key forms, and volume times average selling price for high-visibility categories.
Inputs that materially moved the model included protein fortification trends in packaged foods, animal feed inclusion rates, dairy and crop output patterns, import-export momentum by region, mix shifts between concentrates, isolates, and textured or hydrolyzed formats, and typical price spreads by source type. Forecasts were built using scenario analysis supported by short-run smoothing on key drivers, and then refined based on what interviewees expected for capacity ramp-ups, substitution, and near-term pricing. Where bottom-up visibility was limited for smaller formats, gaps were filled using conservative penetration assumptions and then adjusted only after cross-checking with trade and application indicators.
Data Validation & Update Cycle
Outputs were validated through triangulation across independent signals, including production and trade movements, price ranges observed in channel checks, and adoption feedback from downstream users. Variance checks were run at region and application level so abnormal jumps could be isolated, explained, and corrected before sign-off. If any outliers could not be reconciled through the available signals, we re-contacted primary respondents.
The report is refreshed annually, and interim updates are made when material events occur, such as major capacity announcements or sharp input cost shocks. Before delivery, a final review pass is completed so the numbers and assumptions reflect the latest available information.
Mordor Intelligence's Protein Ingredients Market2 Market Size Compared Against Other Published Estimates
It is normal to see different market sizes for protein ingredients because publishers do not always count the same product forms, end uses, and conversion rules between volumes and value. Differences also come from how each model treats mixed blends, how it handles regional price differences, and how often assumptions are refreshed.
A common split in this market is whether the sizing strictly follows ingredient-grade formats (concentrates, isolates, and textured or hydrolyzed proteins) across the stated applications, or whether broader nutrition and finished-product value gets pulled in. Currency timing and average selling price progression can also widen the spread, especially when plant and dairy inputs swing in opposite directions, and when trade-led availability is not used as a cross-check. This is why the scope is tied to ingredient-format demand signals and validated against production and trade direction before sign-off in Mordor Intelligence.
Benchmark comparison
| Source | Market Size | Gaps in Research Methodology |
|---|---|---|
| Mordor Intelligence | USD 28.32 B (2025) | |
| Global Consultancy A | USD 55.06 B (2025) | Uses a broader definition that appears to combine additional nutrition-related categories beyond ingredient-grade proteins, which can lift totals when finished product value or a wider dietary protein basket is included. |
| Industry Publisher B | USD 63.75 B (2025) | Likely applies a wider application interpretation and value conversion across end uses, where blended formulations and downstream value capture can be counted beyond ingredient-level demand. |
The comparison shows that scope and value-conversion choices explain most of the spread across published totals. By keeping inputs traceable to form-level demand signals and then checking regional totals against production and trade movement, the final number stays repeatable when assumptions change.
Key Questions Answered in the Report
What is the current size of the protein ingredients market?
The protein ingredients market size stands at USD 29.77 billion in 2026 and is projected to reach USD 38.21 billion by 2031.
Which protein source holds the largest market share?
Plant proteins command the largest share at 63.52% of 2025 revenue, reflecting consumer demand for sustainable options.
Which region is growing the fastest?
The Middle East and Africa region leads with a 6.41% CAGR forecast, driven by food-security investments in alternative protein facilities.
Why are isolates growing faster than concentrates?
Isolates offer ≥90% purity and superior solubility, attributes sought in premium beverages and clinical-nutrition products, supporting their 8.18% CAGR.