Market Overview
| Study Period | 2020 - 2030 |
|---|---|
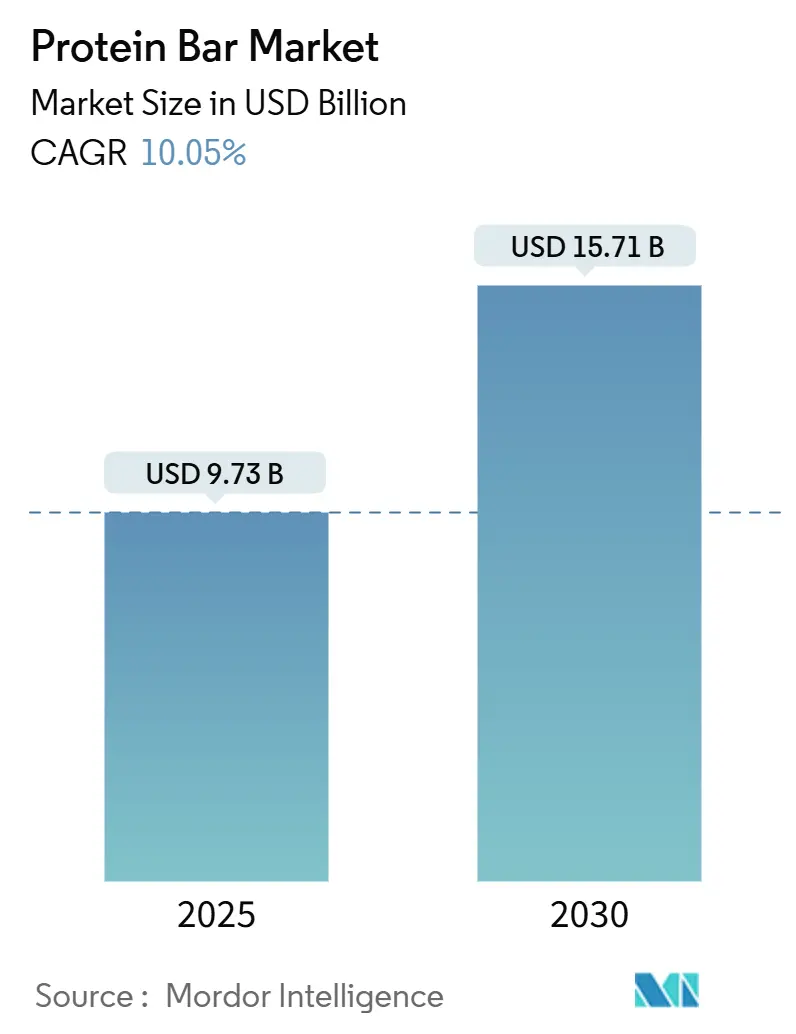
| Market Size (2025) | USD 9.73 Billion |
| Market Size (2030) | USD 15.71 Billion |
| Growth Rate (2025 - 2030) | 10.05% CAGR |
| Fastest Growing Market | Asia Pacific |
| Largest Market | North America |
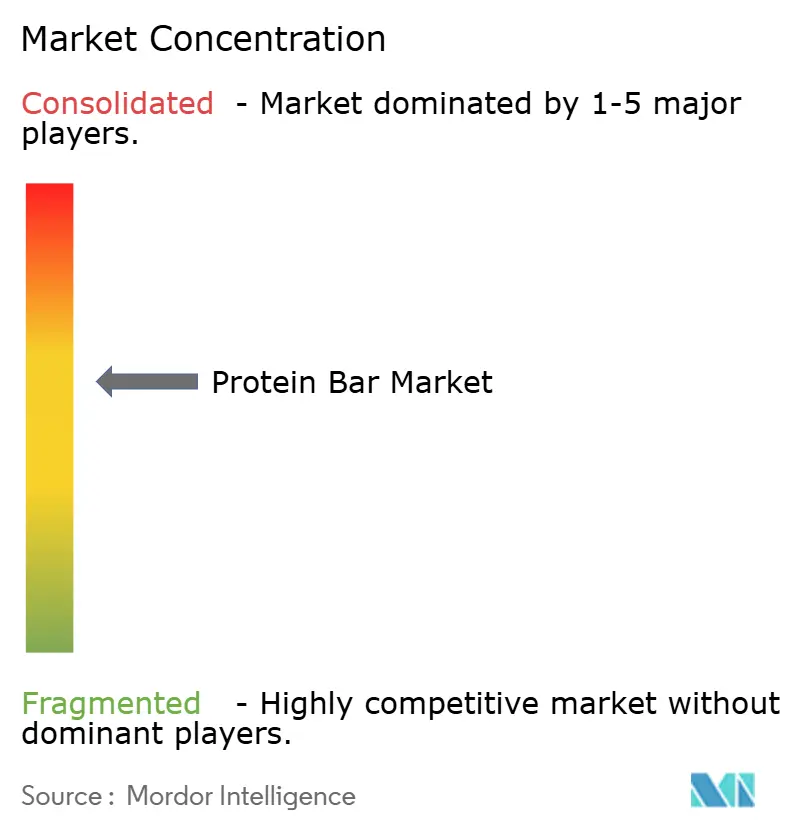
| Market Concentration | Medium |
Major Players
*Disclaimer: Major Players sorted in no particular order Image © Mordor Intelligence. Reuse requires attribution under CC BY 4.0. |
|
Protein Bar Market Analysis by Mordor Intelligence
Growing at a CAGR of 10.05%, the protein bar industry is set to expand from USD 9.73 billion in 2025 to USD 15.71 billion by 2030. Once limited to bodybuilding circles, protein bars are now widely consumed as pantry staples, workplace snacks, and travel-friendly meal substitutes. This growth is driven by rising demand for clean-label recipes, advancements in plant-based protein technology, and the convenience of digital retail platforms. Established confectionery companies face increasing competition from direct-to-consumer brands focusing on ingredient transparency and indulgent taste profiles. North America leads in market value, while the Asia-Pacific region is growing rapidly due to higher disposable incomes and the global fitness trend. Premium product lines with simplified ingredients and innovative protein sources are gaining traction, supported by subscription models that reduce price comparisons. However, challenges such as regulatory inconsistencies, counterfeit risks in e-commerce, and scrutiny over sugar content could impact growth.
Key Report Takeaways
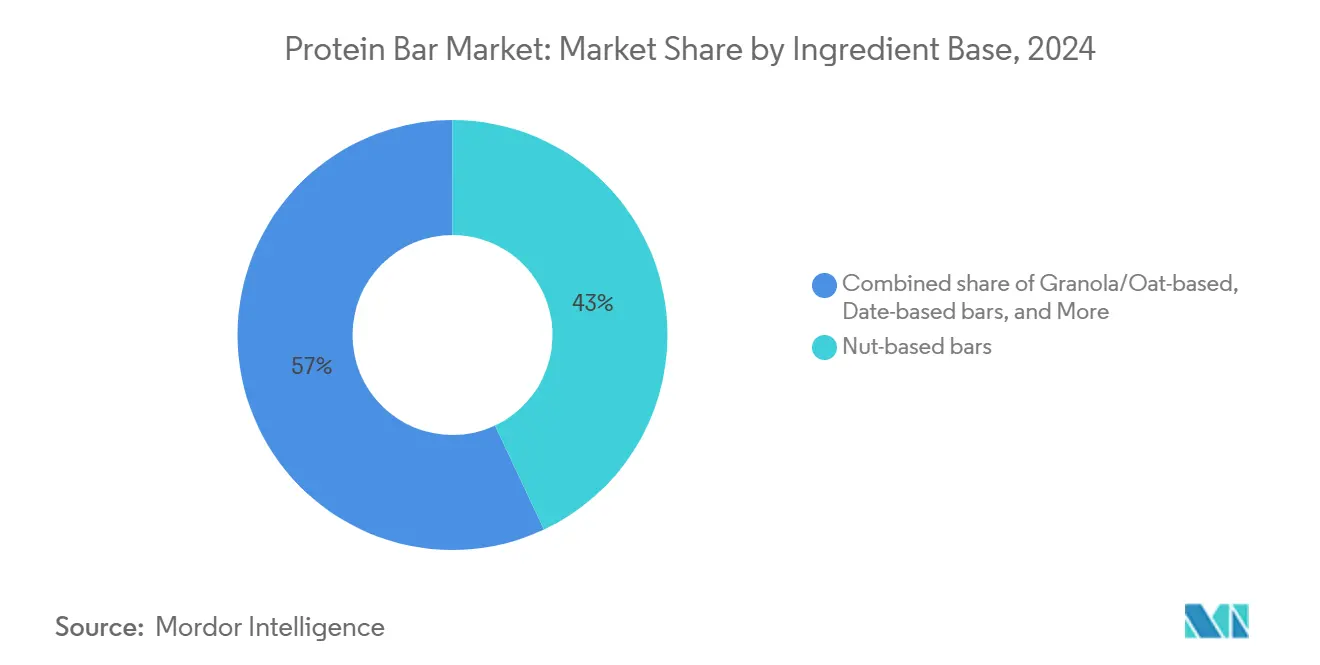
- By ingredient base, nut-based bars led with 43.01% of the protein bar market share in 2024, while date-based bars are projected to expand at an 8.02% CAGR through 2030.
- By price category, the mass segment held 68.02% of the protein bar market share in 2024, whereas premium offerings are forecast to grow at a 7.33% CAGR during 2025-2030.
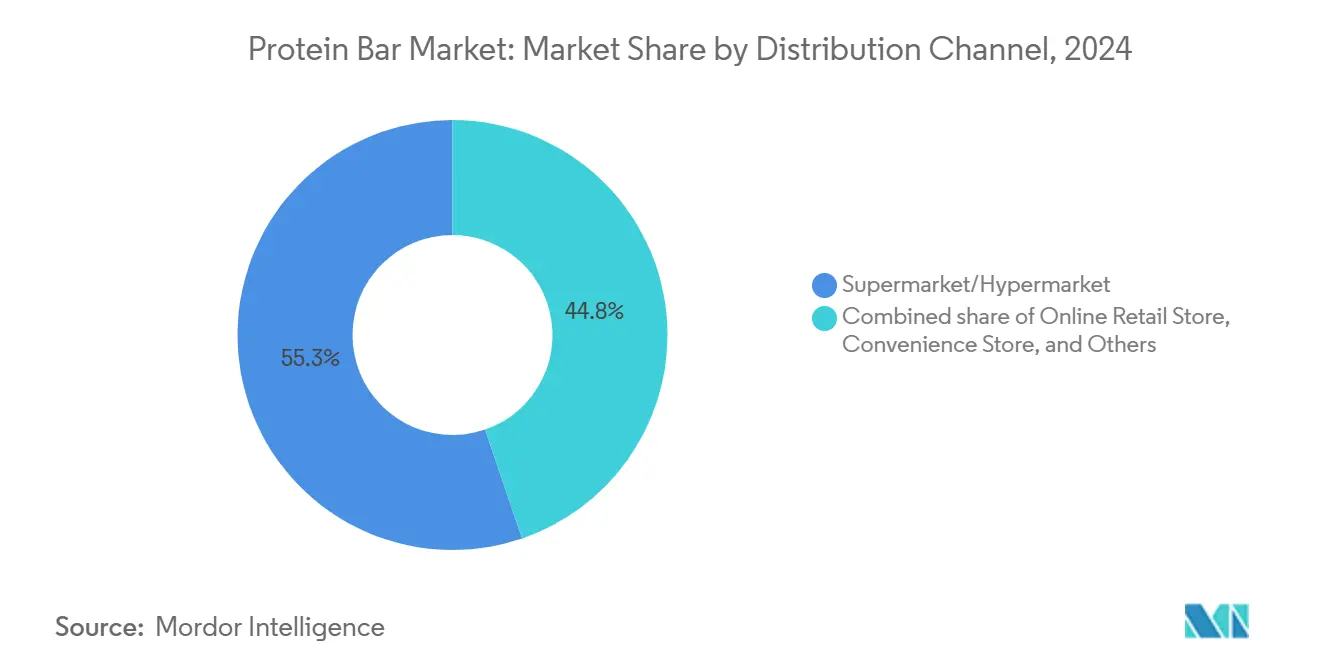
- By distribution channel, supermarkets and hypermarkets accounted for 55.25% of the protein bar market size in 2024; online retail is set to grow at an 8.45% CAGR to 2030.
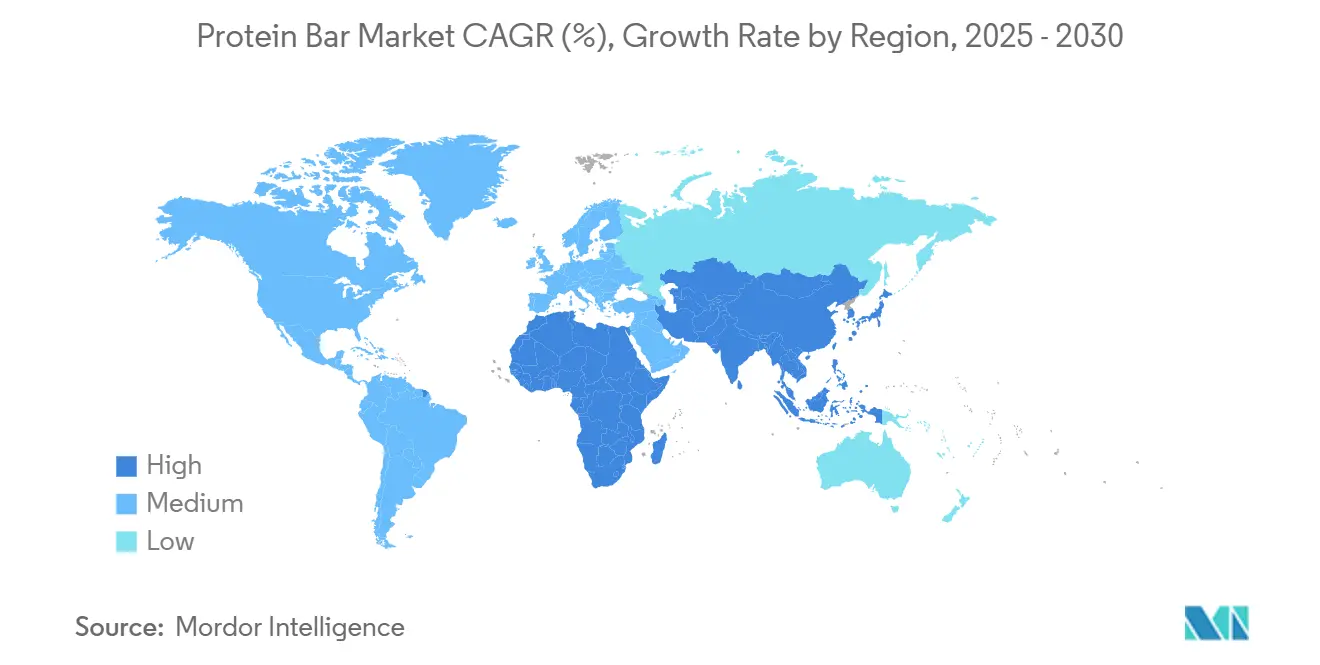
- By geography, North America captured 38.23% revenue share in 2024, while Asia-Pacific is poised to register the fastest 9.24% CAGR during the forecast period.
Global Protein Bar Market Trends and Insights
Drivers Impact Analysis
| Drivers | (~) % Impact on CAGR Forecast | Geographic Relevance | Impact Timeline |
|---|---|---|---|
| Increased Demand for Antimicrobial and Health-Focused Formulations | +1.8% | Global, with early adoption in North America & Europe | Medium term (2-4 years) |
| Rise of Plant-Based Protein Systems with Improved Taste/Texture | +2.1% | Global, strongest in North America, Europe, and urban Asia-Pacific | Medium term (2-4 years) |
| Growth of Fitness Centers and Gyms | +1.5% | Global, concentrated in North America, Europe, and Asia-Pacific urban centers | Long term (≥ 4 years) |
| Retail Modernization and E-Commerce Adoption | +1.9% | Global, accelerating in Asia-Pacific and Middle East | Short term (≤ 2 years) |
| Portion-Controlled, On-the-Go Snacking and Permissible Indulgence | +1.6% | Global, particularly North America and Europe | Medium term (2-4 years) |
| Expansion of Clean-Label and Short-Ingredient-List Claims in Bar | +1.4% | Global, led by North America and Europe | Medium term (2-4 years) |
| Source: Mordor Intelligence | |||
Understand The Key Trends Shaping This Market
Download PDF
Increased Demand for Antimicrobial and Health-Focused Formulations
In 2024, ProGo launched collagen-infused protein bars designed to enhance skin elasticity and support joint health, catering to the rising consumer demand for functional benefits in everyday products. Similarly, NoFuss introduced bars fortified with vitamins D3, B12, and zinc to address common micronutrient deficiencies in plant-based diets. This shift highlights the growing preference for protein bars that offer multiple health benefits, with consumers increasingly willing to pay a premium for such innovative solutions. The active nutrition sector experienced steady growth in 2024, as these products gained popularity for various daily uses beyond fitness and workouts. To differentiate their offerings, manufacturers are leveraging advanced ingredients like postbiotic strains and prebiotic fibers, which support gut health and overall wellness. However, inconsistent regulatory frameworks for structure-function claims across different markets continue to pose challenges for the industry. By focusing on holistic wellness and functional credibility, brands are successfully capturing market share from traditional meal-replacement bars, which often fail to meet the evolving expectations of health-conscious consumers.
Rise of Plant-Based Protein Systems with Improved Taste/Texture
Recent advancements in plant-based protein technology have significantly improved product quality, achieving sensory parity with whey and addressing a major barrier to plant-based adoption. In 2024, Ingredion introduced Vitessence Pea 100 HD, a pea protein isolate known for its neutral flavor and smooth texture. This innovation allows manufacturers to eliminate the use of masking agents such as cocoa or peanut butter, simplifying formulations. Vivici also launched BLG protein in 2024, developed through precision fermentation. This protein offers a complete amino acid profile while avoiding common legume allergens, making it suitable for a wider range of consumers. Furthermore, CSIRO developed a meat protein powder in 2024 that retains 95% of its original nutritional value, opening new possibilities for hybrid animal-plant protein products, such as protein bars[1]Commonwealth Scientific and Industrial Research Organisation, "Great balls of protein: CSIRO turns red meat into nutritious powder", csiro.au. In April 2025, Barebells introduced vegan Fudge Brownie and Caramel Choco Chip bars, each providing 16 grams of plant protein per serving. This launch demonstrates how European brands are leveraging taste and innovation to compete effectively with established U.S. market leaders.
Growth of Fitness Centers and Gyms
In 2024, gym memberships in the United States experienced significant growth, creating a strong distribution channel for protein bars marketed as post-workout recovery products. According to Life Time Fitness surveys, building muscle has become the top fitness goal for members, replacing weight loss. This shift highlights the increasing importance of protein consumption as a key nutritional focus. FrieslandCampina reported that 71% of consumers prioritized protein intake in 2024, a notable increase from 59% in 2022. Additionally, 46% of consumers reported increasing their late-night protein consumption to support overnight muscle recovery and synthesis. Gyms are now evolving into retail hubs, where B2B sports nutrition brands strategically offer single-serve protein bars at workout locations to encourage impulse purchases. The market is becoming more fragmented with the rise of boutique fitness studios such as CrossFit, F45, and Orangetheory. Each of these formats caters to specific workout intensities and durations, shaping distinct protein preferences among their members.
Retail Modernization and E-Commerce Adoption
Direct-to-consumer channels and subscription models are transforming how consumers find and repurchase protein bars, bypassing traditional retail intermediaries. According to SPINS data, online sales of active nutrition products have grown significantly as brands use personalized nutrition algorithms to recommend bars based on individual dietary needs, taste preferences, and fitness goals. Research highlights that e-commerce is expanding rapidly in the Asia-Pacific and Middle East markets, where modern retail infrastructure is still developing, but smartphone usage has exceeded 80%. Programs like Amazon's Subscribe & Save and specialized platforms such as Thrive Market are lowering per-unit costs by 15-20%, making premium protein bars more affordable for price-sensitive consumers. To compete with the rise of digital platforms, retailers are enhancing in-store experiences. For example, Whole Foods has upgraded its protein bar sections with QR codes that link to videos about ingredient sourcing and third-party lab certifications. These efforts aim to attract more foot traffic and retain customers in the face of increasing online competition.
Restraints Impact Analysis
| Restraint | (~) % Impact on CAGR Forecast | Geographic Relevance | Impact Timeline |
|---|---|---|---|
| Regulatory Complexity and Compliance Burden | -1.2% | Global, particularly North America, Europe, and Asia-Pacific | Long term (≥ 4 years) |
| Counterfeit and Low-Quality Products | -0.9% | Global, concentrated in e-commerce channels and emerging markets | Medium term (2-4 years) |
| Negative Perception of High Sugar Bars Among Health-Conscious Consumers | -0.7% | Global, strongest in North America and Europe | Short term (≤ 2 years) |
| Allergen Management and Cross-Contamination Risks | -0.6% | Global, particularly North America and Europe | Medium term (2-4 years) |
| Source: Mordor Intelligence | |||
Regulatory Complexity and Compliance Burden
Multinational brands face challenges due to varying labeling standards enforced by the FDA, EFSA, and FSSAI. These differences require companies to create separate SKUs and production runs, increasing costs by 12-18% compared to brands operating in a single market. In 2024, the FDA will implement updated nutrition facts panel requirements, which include dual-column labeling for bars containing more than 200 calories[2]U.S. Food and Drug Administration, "FDA Nutrition Facts Label.", fda.gov. This change complicates packaging design and reduces shelf visibility. Similarly, EFSA's approval process for health claims demands clinical trials costing between USD 500,000 and USD 1 million per claim, making it difficult for smaller brands to adopt functional positioning. In India, FSSAI's 2024 front-of-pack labeling regulations introduce a color-coded system, red, amber, or green, to indicate sugar, salt, and fat content. Products with more than 5 grams of sugar per serving may face negative consumer perceptions. These regulatory requirements place a heavier burden on smaller and emerging brands, which often lack dedicated regulatory teams, while established players with strong legal and compliance infrastructures gain a competitive advantage in the market.
Counterfeit and Low-Quality Products
Counterfeit protein bars, designed to mimic well-known brands but made with low-quality ingredients, are increasingly prevalent on e-commerce platforms. This issue damages consumer trust and exposes manufacturers to legal risks. Platforms like Amazon and Alibaba have seen third-party sellers listing protein bars with exaggerated claims. Verified lab tests revealed that these bars often contain 30-40% less protein than what their labels claim. To address this, brands such as Quest Nutrition and Clif Bar have implemented blockchain-enabled QR codes on their packaging, allowing consumers to check product authenticity. However, consumer adoption remains low, with less than 15% using this feature due to usability challenges. Regulatory enforcement has been inconsistent; the FDA conducted only 12 recalls of protein bars in 2024, down from 18 in 2023, despite the growing number of counterfeit products. To combat counterfeiting, brands are advocating for mandatory third-party certifications, such as NSF and Informed-Choice, to create stricter barriers for counterfeiters. However, the high cost of certification, ranging from USD 10,000 to USD 25,000 per SKU, poses a significant challenge for smaller manufacturers.
Segment Analysis
By Ingredient Base: Date-Based Bars Gain Ground on Natural Sweetness
In 2024, nut-based bars accounted for 43.01% of the market, driven by consumers' preference for almonds, cashews, and peanuts. These nuts are popular for their crunchy texture, high protein content, and fats that help keep consumers feeling full for longer. Almonds, for instance, provide 6 grams of protein per ounce and are rich in vitamin E and magnesium, making them a nutrient-dense option that aligns with the growing demand for clean-label products. In the same year, Quaranta launched a nut protein bar combining hazelnuts and almonds with whey isolate, targeting European consumers who favor Mediterranean-inspired ingredients. Similarly, Arla introduced its Essentials Bar in 2024, featuring cashews and peanuts in a simple 10-ingredient recipe free from artificial sweeteners, appealing to health-conscious buyers.
Date-based bars are expected to grow at a CAGR of 8.02% from 2025 to 2030, thanks to their dual role as natural binders and sweeteners. These bars eliminate the need for added sugars or syrups, making them a healthier alternative. Although dates contain 66 grams of sugar per 100 grams, they have a low glycemic index of 42, which helps regulate blood sugar levels better than cane sugar or agave. In 2024, Veganz introduced bars sweetened only with date syrup, offering 12 grams of protein per serving without any added sugars. L-Nutra also launched bars using whole dates, providing fiber and potassium along with protein, catering to consumers looking for functional nutrition beyond basic macronutrients. Additionally, Oobli combined dates with sweet proteins derived from oubli fruit, achieving a 70% reduction in sugar content without the cooling aftertaste associated with erythritol, making it a preferred choice for those seeking reduced-sugar options.
Note: Segment shares of all individual segments available upon report purchase
Get Detailed Market Forecasts at the Most Granular Levels
Download PDF
By Price Category: Premium Gains Traction on Clean Formulations
In 2024, mass-market bars held a commanding 68.02% share of the market, driven by their strong presence in supermarkets and convenience stores. These bars, priced between USD 1.50 and USD 2.50, align well with consumer impulse-buying habits. Leading brands like Kellogg's NutriGrain and General Mills' Nature Valley rely on their established brand reputation and prominent shelf placement to maintain their market position. However, they are under increasing pressure to reformulate their products as consumers demand transparency and healthier ingredients. In August 2024, Mars acquired Kellanova for USD 35.9 billion, consolidating ownership of RXBAR and NutriGrain. This acquisition highlights how major players are turning to protein bars as a strategic response to declining confectionery sales. To stay competitive, mass-market brands are introducing mid-tier options, such as Clif Bar's Thins, priced at USD 1.99 per bar, which aim to bridge the gap between value and premium offerings.
Premium bars are expected to grow at a compound annual growth rate (CAGR) of 7.33% from 2025 to 2030. This growth is fueled by consumers willing to pay USD 3.50 to USD 5.00 per bar for products with cleaner ingredients, innovative protein sources, and added functional benefits. In September 2024, Simply Good Foods acquired the plant-based brand OWYN for USD 42.75 million, reflecting the rising demand for dairy-free formulations, which often command a 30-40% price premium over whey-based alternatives. Barebells, leveraging European flavor innovation, launched its Marshmallow Peanut Road and Wild Cherry flavors in April and January 2025, respectively. These bars, priced at USD 3.99 each, target U.S. specialty channels and justify their premium positioning with unique taste profiles. The premium segment's growth is concentrated in direct-to-consumer and specialty retail channels, where brands can control product presentation and educate consumers about ingredient quality and nutritional benefits.
By Distribution Channel: Online Retail Disrupts Traditional Gatekeepers
In 2024, supermarkets and hypermarkets led the distribution market, accounting for 55.25% of the market share. Their dominance is attributed to offering a wide variety of products, competitive promotional pricing, and strategically placing impulse-buy items at checkout counters. Retailers like Walmart and Kroger dedicate 12-16 linear feet of shelf space to protein bars, balancing well-known national brands such as Quest and Clif Bar with their private-label options, which are priced 20-30% lower. However, emerging brands face significant challenges due to high slotting fees, ranging from USD 50,000 to USD 150,000 per SKU, and promotional allowances of 15-25%, which reduce profit margins. These costs often limit distribution opportunities for smaller brands, favoring established players with larger trade-marketing budgets.
Online retail is expected to grow at a strong CAGR of 8.45% from 2025 to 2030, driven by subscription-based models, personalized nutrition solutions, and direct-to-consumer strategies that eliminate retailer margins. For example, Amazon's Subscribe and Save program offers a 15% discount on recurring protein bar orders, making prices comparable to supermarket promotions while providing added convenience. According to SPINS data, online sales of active nutrition products have surged as brands use personalized algorithms to recommend protein bars based on individual dietary needs, taste preferences, and fitness goals. Leading brands like Quest Nutrition and RXBAR generate 25-30% of their sales through their own e-commerce platforms, allowing them to retain full profit margins and gather valuable consumer data. Thrive Market, a membership-based online grocer, focuses on curating protein bars that meet organic, non-GMO, and fair-trade standards, appealing to consumers willing to pay an annual fee of USD 60 for access to carefully selected products.
Note: Segment shares of all individual segments available upon report purchase
Get Detailed Market Forecasts at the Most Granular Levels
Download PDF
Geography Analysis
In 2024, North America accounted for 38.23% of the market share, driven by a strong fitness culture, over 64 million gym memberships, and significant retail shelf space dedicated to protein bars. The U.S. leads this demand, with consumers increasingly using protein bars as meal replacements rather than just sports nutrition products. Approximately 57% of active nutrition users consume these bars for various occasions beyond workouts. Additionally, the use of GLP-1 receptor agonists like semaglutide by 5.6 million Americans in 2024 has indirectly boosted protein intake, as users aim to preserve muscle mass during weight loss. Canada and Mexico also contribute to growth, but regulatory challenges, such as Health Canada's strict health claim standards and Mexico's front-of-pack warning labels, complicate regional product launches. The growing preference among U.S. consumers to reduce sugar intake has led to reformulations using alternatives like erythritol, stevia, and monk fruit.
Asia-Pacific is the fastest-growing region, with a projected CAGR of 9.24% from 2025 to 2030. Rising disposable incomes, urbanization, and increasing fitness center penetration in countries like China, India, Japan, and Australia are driving this growth. According to the National Bureau of Statistics of China, in 2024, the average annual per capita disposable income of households in China amounted to approximately 41,300 CNY, up from 39,218 CNY in 2023[3]National Bureau of Statistics of China, "Average annual per capita disposable income of households in China from 1990 to 2024", stats.gov.cn. China's middle class, exceeding 400 million people, is adopting fitness habits, with gym memberships steadily increasing and fueling demand for post-workout nutrition. Japan's aging population is creating demand for protein bars fortified with leucine and HMB to prevent muscle loss in individuals over 60. In Australia, protein bars are widely used as convenient energy sources for outdoor activities such as hiking and cycling. The rapid growth of e-commerce across the region is helping brands bypass fragmented retail networks and reach consumers in smaller cities, including tier-2 and tier-3 markets.
Europe and South America are experiencing moderate growth due to economic challenges and consumer preferences for traditional snacks. In Europe, Germany, the U.K., and France lead demand, with consumers prioritizing organic certifications and simple ingredient lists. Brands like Arla and Trek cater to these preferences, while Barebells introduced five new flavors, including vegan options, in 2025 to compete with U.S. brands. In South America, high tariffs and currency fluctuations have raised protein bar prices by 40-60% compared to North America, limiting the market to affluent urban consumers. In the Middle East and Africa, the market is still emerging, with early adoption seen in the UAE and South Africa among expatriates and fitness enthusiasts. Regulatory changes, such as India's FSSAI front-of-pack labeling rules in 2024 and similar initiatives in Saudi Arabia, are influencing how brands position their products regarding sugar content and health claims.
Get Analysis on Important Geographic Markets
Download PDF
Competitive Landscape
The protein bar market is moderately consolidated, with a mix of established global brands and fast-growing functional nutrition companies holding notable market shares. Leading players such as Clif Bar & Company, Kellanova, Mars Incorporated, General Mills Inc., and PepsiCo Inc. dominate shelf space through strong brand equity, extensive distribution networks, and continuous flavor and format innovation. Their ability to cater to diverse consumer needs—from sports recovery and weight management to everyday snacking, gives them a competitive edge and shapes overall category dynamics.
Alongside these large brands, emerging companies and niche functional food start-ups contribute to competitive intensity by focusing on clean-label formulations, plant-based proteins, reduced sugar content, and specialty dietary claims such as keto, gluten-free, or high-fiber. These players often win consumer attention through transparency, novel textures, and unique ingredients, appealing especially to health-conscious and younger demographics seeking minimally processed, high-protein snacks. Their agility in product development and digital-first marketing strategies enables them to capture market share despite operating at smaller scale.
The market’s moderate consolidation is reinforced by rising demand for convenient, on-the-go nutrition and the growing influence of e-commerce, which allows both established companies and new entrants to expand rapidly. However, higher R&D requirements, increasing ingredient costs, and stricter regulations on health claims and sugar content favor companies with robust supply chains and technical capabilities. As competition intensifies, major brands are expected to strengthen their portfolios through cleaner formulations, functional ingredients, and strategic acquisitions, while smaller players will focus on differentiation to retain niche consumer loyalty.
Protein Bar Industry Leaders
-
Mars Incorporated
-
PepsiCo Inc.
-
Clif Bar & Company
-
General Mills Inc.
-
Kellanova
- *Disclaimer: Major Players sorted in no particular order
Need More Details on Market Players and Competitors?
Download PDF
Recent Industry Developments
- December 2025: Fermenta announced its plans to introduce Solein-powered protein bars in the United States. The products will be available for consumers during Q1 2026, and they will be among the first Solein-powered products available to consumers in the United States.
- November 2025: One Brands, a protein brand, in collaboration with The Hershey Co., introduced One x Hershey’s double chocolate-flavored protein bar. According to the brand, the bar is formulated with Hershey’s cocoa and chocolate chips. The protein bar offers 18 grams of protein and 1 gram of sugar.
- May 2025: Clif Builders has expanded its high-protein bars portfolio with the launch of its three new products. The latest innovations include BUILDERS OREO-flavored and BUILDERS Reduced Sugar Crispy Protein bars.
- May 2025: Myprotein has launched a bar worldwide that is “incredible to eat, impossible to name.” According to the brand, the nameless bar will be available in three flavors: caramel nut, white chocolate cookie, and double dark chocolate, each containing 16g of protein.
Global Protein Bar Market Report Scope
Convenience Store, Online Retail Store, Supermarket/Hypermarket, Others are covered as segments by Distribution Channel. Africa, Asia-Pacific, Europe, Middle East, North America, South America are covered as segments by Region.
Ingredient Base
| Nut-based bars |
| Granola/Oat-based |
| Date-based bars |
| Hybrid blends |
| Others |
Price Category
| Mass |
| Premium |
Distribution Channel
| Supermarket/Hypermarket |
| Online Retail Store |
| Convenience Store |
| Other Distribution Channels |
Geography
| North America | United States |
| Canada | |
| Mexico | |
| Rest of North America | |
| Europe | Germany |
| United Kingdom | |
| Italy | |
| France | |
| Spain | |
| Netherlands | |
| Poland | |
| Belgium | |
| Sweden | |
| Rest of Europe | |
| Asia-Pacific | China |
| India | |
| Japan | |
| Australia | |
| Indonesia | |
| South Korea | |
| Thailand | |
| Singapore | |
| Rest of Asia-Pacific | |
| South America | Brazil |
| Argentina | |
| Colombia | |
| Chile | |
| Peru | |
| Rest of South America | |
| Middle East and Africa | South Africa |
| Saudi Arabia | |
| United Arab Emirates | |
| Nigeria | |
| Egypt | |
| Morocco | |
| Turkey | |
| Rest of Middle East and Africa |
| Ingredient Base | Nut-based bars | |
| Granola/Oat-based | ||
| Date-based bars | ||
| Hybrid blends | ||
| Others | ||
| Price Category | Mass | |
| Premium | ||
| Distribution Channel | Supermarket/Hypermarket | |
| Online Retail Store | ||
| Convenience Store | ||
| Other Distribution Channels | ||
| Geography | North America | United States |
| Canada | ||
| Mexico | ||
| Rest of North America | ||
| Europe | Germany | |
| United Kingdom | ||
| Italy | ||
| France | ||
| Spain | ||
| Netherlands | ||
| Poland | ||
| Belgium | ||
| Sweden | ||
| Rest of Europe | ||
| Asia-Pacific | China | |
| India | ||
| Japan | ||
| Australia | ||
| Indonesia | ||
| South Korea | ||
| Thailand | ||
| Singapore | ||
| Rest of Asia-Pacific | ||
| South America | Brazil | |
| Argentina | ||
| Colombia | ||
| Chile | ||
| Peru | ||
| Rest of South America | ||
| Middle East and Africa | South Africa | |
| Saudi Arabia | ||
| United Arab Emirates | ||
| Nigeria | ||
| Egypt | ||
| Morocco | ||
| Turkey | ||
| Rest of Middle East and Africa | ||
Need A Different Region or Segment?
Customize Now
Market Definition
- Milk and White Chocolate - Milk chocolates is a solid chocolate made with milk (in the form of either milk powder, liquid milk, or condensed milk) and cocoa solids. White chocolate is made from cocoa butter and milk and contains no cocoa solids whatsoever. The scope includes regular chocolates, low-sugar, and sugar-free variants
- Toffees & Nougats - Toffees include hard, chewy, and small or one-bite candies marketed with labels as toffee or toffee-like confectionery. Nougat is a chewy confection with almond, sugar, and egg white as a basic ingredient; and it originated in Europe and Middle East countries.
- Cereals Bars - A snack composed of breakfast cereal that has been compressed into a bar shape and is held together with a form of edible adhesive. The scope includes snack bars made with cereals such as rice, oats, corn, etc. mixed with a binding syrup. These also include products labeled as cereal bars, cereal treat bars, or grain bars.
- Chewing Gum - This is a preparation for chewing, usually made of flavored and sweetened chicle or such substitutes as polyvinyl acetate. The types of chewing gums included in the scope are sugar-chewing gums and sugar-free chewing gums
| Keyword | Definition |
|---|---|
| Dark Chocolate | Dark chocolate is a form of chocolate containing cocoa solids and cocoa butter without the milk. |
| White Chocolate | White chocolate is the type of chocolate containing the highest percentage of milk solids, typically around or over 30 percent. |
| Milk Chocolate | Milk chocolate is made from dark chocolate that has a low cocoa solid content and higher sugar content, plus a milk product. |
| Hard Candy | A candy made of sugar and corn syrup boiled without crystallizing. |
| Toffees | A hard, chewy, often brown sweet that is made from sugar boiled with butter. |
| Nougats | A chewy or brittle candy containing almonds or other nuts and sometimes fruit. |
| Cereal bar | A cereal bar is a bar-shaped food product, made by pressing cereals and usually dried fruit or berries, which are in most cases held together by glucose syrup. |
| Protein bar | Protein bars are nutrition bars that contain a high proportion of protein to carbohydrates/fats. |
| Fruit & Nut bar | These are often based on dates with other dried fruit and nut additions and, in some cases, flavorings. |
| NCA | The National Confectioners Association is an American trade organization that promotes chocolate, candy, gum and mints, and the companies that make these treats. |
| CGMP | Current good manufacturing practices are those conforming to the guidelines recommended by relevant agencies. |
| Unstandardized foods | Unstandardized foods are those that do not have a standard of identity or that deviate from a prescribed standard in any manner. |
| GI | The glycemic index (GI) is a way of ranking carbohydrate-containing foods based on how slowly or quickly they are digested and increase blood glucose levels over a period of time |
| Skimmed milk powder | Skimmed milk powder is obtained by removing water from pasteurized skim milk by spray-drying. |
| Flavanols | Flavanols are a group of compounds found in cocoa, tea, apples, and many other plant-based foods and beverages. |
| WPC | Whey protein concentrate- the substance obtained by the removal of sufficient nonprotein constituents from pasteurized whey so that the finished dry product contains greater than 25% protein. |
| LDL | Low density Lipoprotein- the bad cholesterol |
| HDL | High density Lipoprotein- the good cholesterol |
| BHT | butylated Hydroxytoluene is a lab-made chemical that is added to foods as a preservative. |
| Carrageenan | Carrageenan is an additive used to thicken, emulsify, and preserve foods and drinks. |
| Free form | Not containing certain ingredients, such as gluten, dairy, or sugar. |
| Cocoa butter | It is a fatty substance obtained from cocoa beans, used in the manufacture of confectionery. |
| Pastellies | A type of of Brazilian candy made from sugar, eggs, and milk. |
| Draggees | Small, round candies that are coated with a hard sugar shell |
| CHOPRABISCO | Royal Belgian Association of the chocolate, pralines, biscuit, and confectionery industry- A trade association that represents the Belgian chocolate industry. |
| European Directive 2000/13 | A European Union directive that regulates the labeling of food products |
| Kakao-Verordnung | The German chocolate ordinance, a set of regulations that define what can be labeled as "chocolate" in Germany. |
| FASFC | Federal Agency for the Safety of the Food Chain |
| Pectin | A natural substance that is derived from fruits and vegetables. It is used in confectionery to create a gel-like texture. |
| Invert sugars | A type of sugar that is made up of glucose and fructose. |
| Emulsifier | A substance that helps to mix to liquids that does not mix together. |
| Anthocyanins | A type of flavonoid that is responsible for the red, purple, and blue colors of confectionery. |
| Functional Foods | Foods that have been modified to provide additional health benefits beyond basic nutrition. |
| Kosher certificate | This certification verifies that the ingredients, production process including all machinery, and/or food-service process complies with the standards of Jewish dietary law |
| Chicory root extract | A natural extract from the chicory root that is a good source of fiber, calcium, phosphorous, and folate |
| RDD | Recommended daily dose |
| Gummies | A chewy gelatin-based candy that is often flavored with fruit. |
| Nutraceuticals | Food or dietary supplements that are claimed to have health benefits. |
| Energy bars | Snack bars that are high in carbohydrates and calories are designed to provide energy on the go. |
| BFSO | Belgian Food Safety Organization for the food chain. |
Need More Details on Market Definition?
Ask a Question
Research Methodology
Mordor Intelligence follows a four-step methodology in all our reports.
- Step-1: Identify Key Variables: In order to build a robust forecasting methodology, the variables and factors identified in Step 1 are tested against available historical market numbers. Through an iterative process, the variables required for market forecast are set, and the model is built on the basis of these variables.
- Step-2: Build a Market Model: Market-size estimations for the forecast years are in nominal terms. Inflation is not a part of the pricing, and the average selling price (ASP) is kept constant throughout the forecast period for each country.
- Step-3: Validate and Finalize: In this important step, all market numbers, variables, and analyst calls are validated through an extensive network of primary research experts from the market studied. The respondents are selected across levels and functions to generate a holistic picture of the market studied.
- Step-4: Research Outputs: Syndicated Reports, Custom Consulting Assignments, Databases & Subscription Platforms

Get More Details On Research Methodology
Download PDF


