
Protein A Resin Market Size and Share
Market Overview
| Study Period | 2020 - 2031 |
|---|---|
| Market Size (2026) | USD 1.38 Billion |
| Market Size (2031) | USD 2.08 Billion |
| Growth Rate (2026 - 2031) | 8.58 % |
| Fastest Growing Market | Asia Pacific |
| Largest Market | North America |
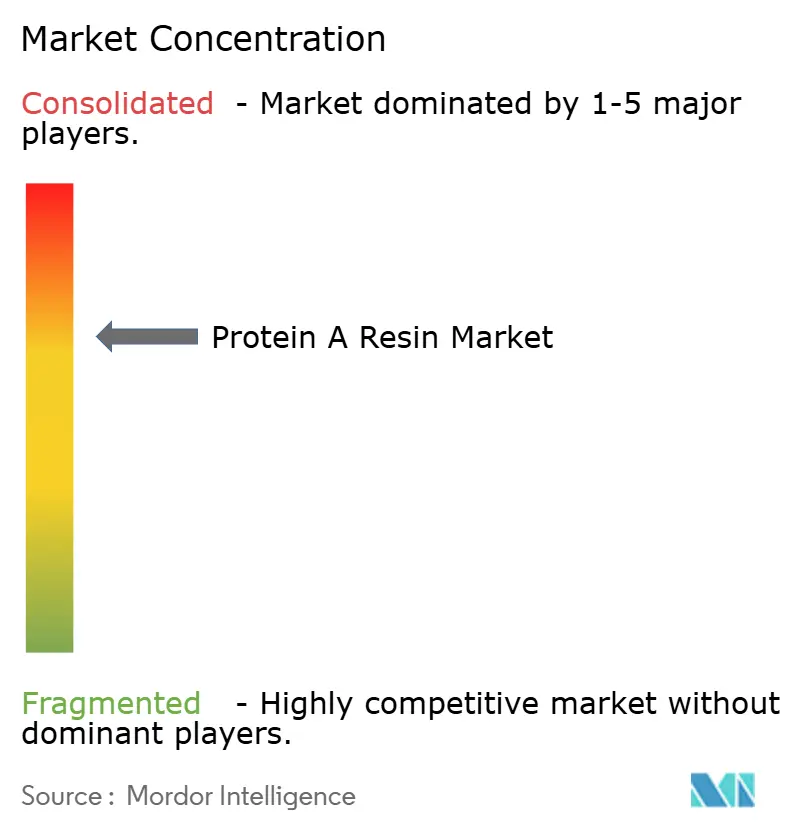
| Market Concentration | Medium |
Major Players *Disclaimer: Major Players sorted in no particular order Image © Mordor Intelligence. Reuse requires attribution under CC BY 4.0. | |
Protein A Resin Market Analysis by Mordor Intelligence
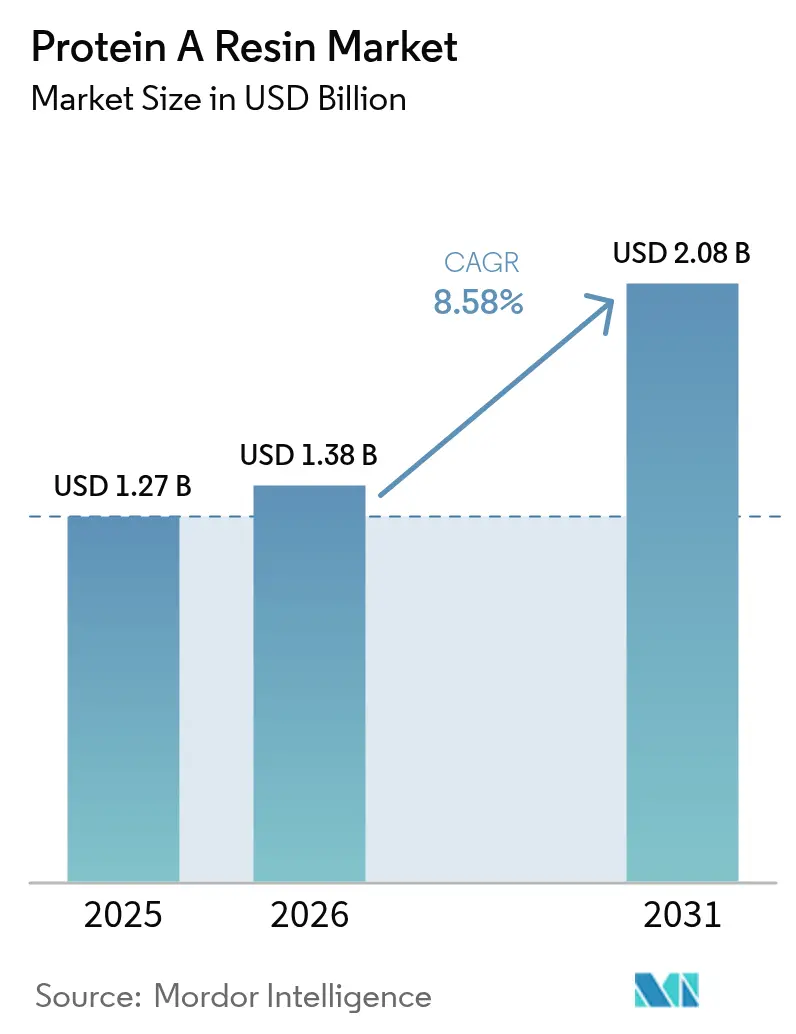
The Protein A Resin Market size was valued at USD 1.27 billion in 2025 and estimated to grow from USD 1.38 billion in 2026 to reach USD 2.08 billion by 2031, at a CAGR of 8.58% during the forecast period (2026-2031). Strong uptake of monoclonal antibody (mAb) therapeutics, rapid biosimilar commercialization, and wider deployment of single-use bioprocessing equipment collectively underpin this expansion. Large-volume antibody manufacturers are scaling capture chromatography capacity in parallel with upstream titer gains, prompting sustained procurement of high-capacity agarose and next-generation fiber matrices. Suppliers are also benefiting from dual-sourcing strategies that biopharma firms have adopted to reduce supply-chain risk, a move that opens incremental opportunities for regional resin producers. Meanwhile, emerging fiber-based adsorbents offering minute-level cycles appeal to process-development groups chasing aggressive productivity targets. Competitive dynamics remain moderate: leading vendors defend share through recombinant-ligand innovations and global regulatory-support programs, yet polymer and fiber challengers are narrowing performance gaps.
Key Report Takeaways
- By matrix composition, agarose commanded 47.10% share of the Protein A resin market size in 2025 and organic polymer-based media are projected to grow at 9.31% CAGR during 2026-2031.
- By ligand source, recombinant Protein A captured 59.10% share of the Protein A resin market size in 2025; natural Protein A is advancing at a 9.55% CAGR to 2031.
- By application, antibody purification led with 61.45% of Protein A resin market share in 2025, while immunoprecipitation is forecast to expand at a 9.05% CAGR through 2031.
- By end user, pharmaceutical and biopharmaceutical companies held 59.80% of Protein A resin market share in 2025, whereas academic and research institutes are rising fastest at 9.42% CAGR through 2031.
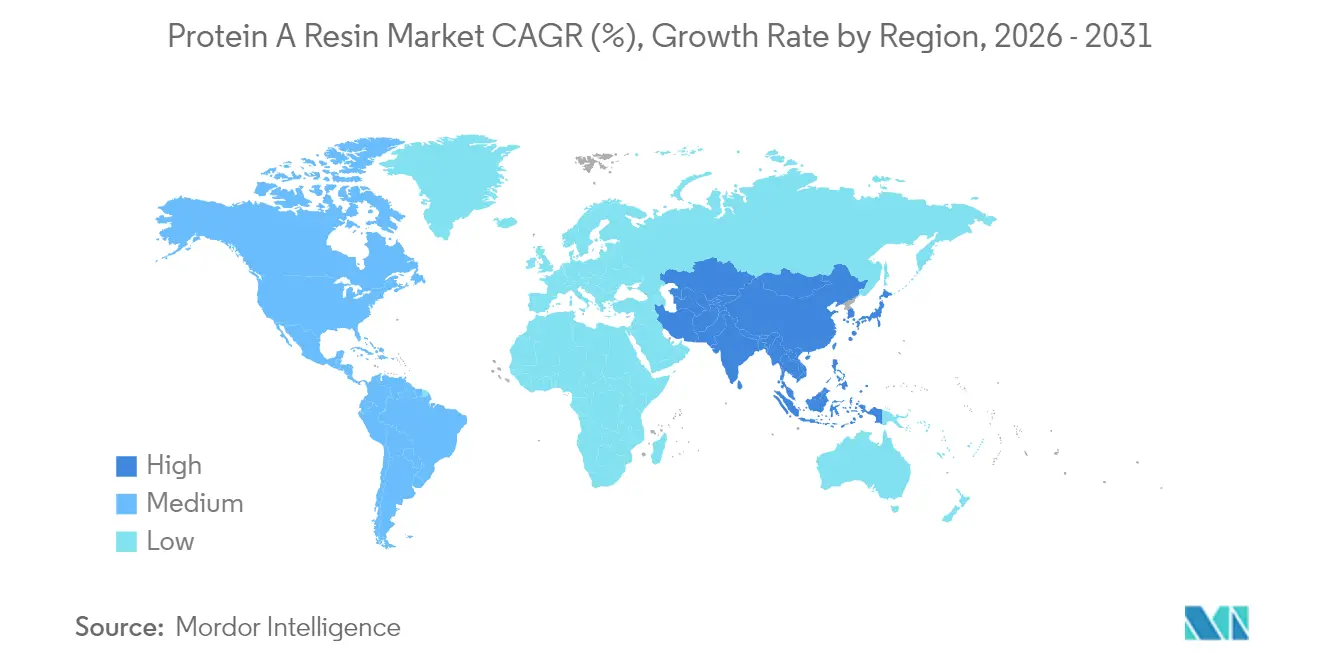
- By geography, North America accounted for 40.50% of Protein A resin market share in 2025 and Asia-Pacific is on track for a 9.82% CAGR to 2031.
Note: Market size and forecast figures in this report are generated using Mordor Intelligence’s proprietary estimation framework, updated with the latest available data and insights as of 2026.
Market Trends and Insights
Drivers Impact Analysis of Protein A Resin Market*
| Driver | (~) % Impact on CAGR Forecast | Geographic Relevance | Impact Timeline |
|---|---|---|---|
| Rising Demand for Monoclonal Antibodies | +2.1% | Global, with concentration in North America & Europe | Long term (≥ 4 years) |
| Expansion of Biosimilar Manufacturing Capacity | +1.8% | APAC core, spill-over to North America & Europe | Medium term (2-4 years) |
| Growing Adoption of Single-Use Bioprocessing Systems | +1.5% | Global, led by North America & Europe | Medium term (2-4 years) |
| Increasing R&D Spending by CDMOs & Big Pharma | +1.3% | Global, with emphasis on North America & APAC | Long term (≥ 4 years) |
| Emergence of Fiber-Based Protein A Media for Rapid Cycles | +0.9% | North America & Europe, expanding to APAC | Short term (≤ 2 years) |
| Dual-Sourcing Strategies to Mitigate Resin Supply-Chain Risk | +0.7% | Global, particularly North America & Europe | Short term (≤ 2 years) |
| Source: Mordor Intelligence | |||


Rising Demand for Monoclonal Antibodies
Global mAb revenue growth continues near 8% per year, triggering new antibody-capture installations and repeat purchases of Protein A adsorbents.[1]Source: BioProcess International, “30 Years of Upstream Productivity Improvements,” bioprocessintl.com Contract manufacturers have responded with large-scale expansions, including a 15,000 L line in Hangzhou that trimmed per-gram costs by nearly 70%. Average upstream titers moved from 0.5 g/L in the 1980s to 2.56 g/L in 2024, raising downstream workload and rewarding high-capacity resins. Emerging bispecifics and antibody-drug conjugates further widen purification demand because each format still relies on Fc-binding capture. Suppliers offering NaOH-tolerant recombinant ligands and high-flow matrices are ideally positioned for these productivity-driven buyers.
Expansion of Biosimilar Manufacturing Capacity
Asia-Pacific manufacturers secure cost advantages and streamlined approval pathways, spurring volume orders for Protein A columns that mirror reference biologic purification standards. Survey data show CMOs and hybrid firms moving from 43% of global biologics capacity in 2024 toward 54% by 2028, concentrating resin demand among a smaller buyer set. Chinese facilities rank top among outsourcing destinations, reinforcing regional pull for resin supply. Harmonized regulations allow standardized purification templates across multiple markets, encouraging suppliers to build logistic hubs near major biosimilar clusters.
Growing Adoption of Single-Use Bioprocessing Systems
Single-use facilities require roughly 40% lower capital outlays than stainless-steel plants and reduce carbon footprints by a similar margin. Integrating disposable Protein A columns eliminates cleaning validation, a key benefit for personalized therapy developers with small campaign volumes. Pre-packed columns and membrane adsorbers arrive sterile and ready, shortening facility turnarounds while ensuring segregation of multi-product suites. The trend supports modular plant concepts and increases demand for cartridge-format resins that fit gamma-irradiated flow paths.
Increasing R&D Spending by CDMOs & Big Pharma
Public-sector grants continue to prime private R&D investment; economic modeling shows a 25% cut to public funding could slice U.S. GDP by 3.8%, underscoring government influence on pipeline health. University–industry alliances multiply, boosting procurement of research-grade Protein A media for candidate screening. CDMOs invest in process-development labs, adopting rapid-cycle adsorbents that support parallel experimentation. Collectively, higher R&D outlays translate to steady baseline consumption of smaller-volume, higher-value resins.
Restraints Impact Analysis of Protein A Resin Market*
| Restraint | (~) % Impact on CAGR Forecast | Geographic Relevance | Impact Timeline |
|---|---|---|---|
| High Upfront Cost of Agarose-Based Resins | -1.4% | Global, particularly impacting emerging markets | Medium term (2-4 years) |
| Ligand Leaching & Regulatory Validation Burdens | -1.1% | Global, with stricter enforcement in North America & Europe | Long term (≥ 4 years) |
| Competitive Threat from Alternative Affinity Ligands | -0.8% | Global, led by innovation hubs in North America & Europe | Medium term (2-4 years) |
| Sustainability Pressures on Mineral-Oil Jetting Processes | -0.5% | Europe & North America, expanding globally | Long term (≥ 4 years) |
| Source: Mordor Intelligence | |||
High Upfront Cost of Agarose-Based Resins
Premium agarose adsorbents can represent more than 50% of consumable costs in a mAb campaign, straining budgets for small biotech and biosimilar firms.[2]Source: Frontiers in Bioengineering and Biotechnology, “Chromatography consumables cost,” frontiersin.org Cost-sensitive buyers evaluate polymer or membrane alternatives, or attempt resin recycling—adding complexity to validation. Contract manufacturers absorb part of this burden but pass charges through to clients. Suppliers respond with higher-capacity beads to reduce grams of resin per gram of product, yet price hurdles persist in markets with limited capital access.
Ligand Leaching & Regulatory Validation Burdens
FDA guidance on extractables and leachables and EMA process-validation updates intensify analytical scrutiny of Protein A residuals. Demonstrating ligand clearance demands orthogonal assays, lengthening development timelines and adding expense for smaller sponsors. Recombinant ligands with enhanced NaOH resistance mitigate leaching but still require equivalence dossiers. Established vendors leverage regulatory-support files to ease adoption, whereas new entrants face steeper qualification obstacles.
*Our forecasts treat driver/restraint impacts as directional, not additive. The impact forecasts reflect baseline growth, mix effects, and variable interactions.
Protein A Resin Market Segment Analysis
By Matrix Composition:
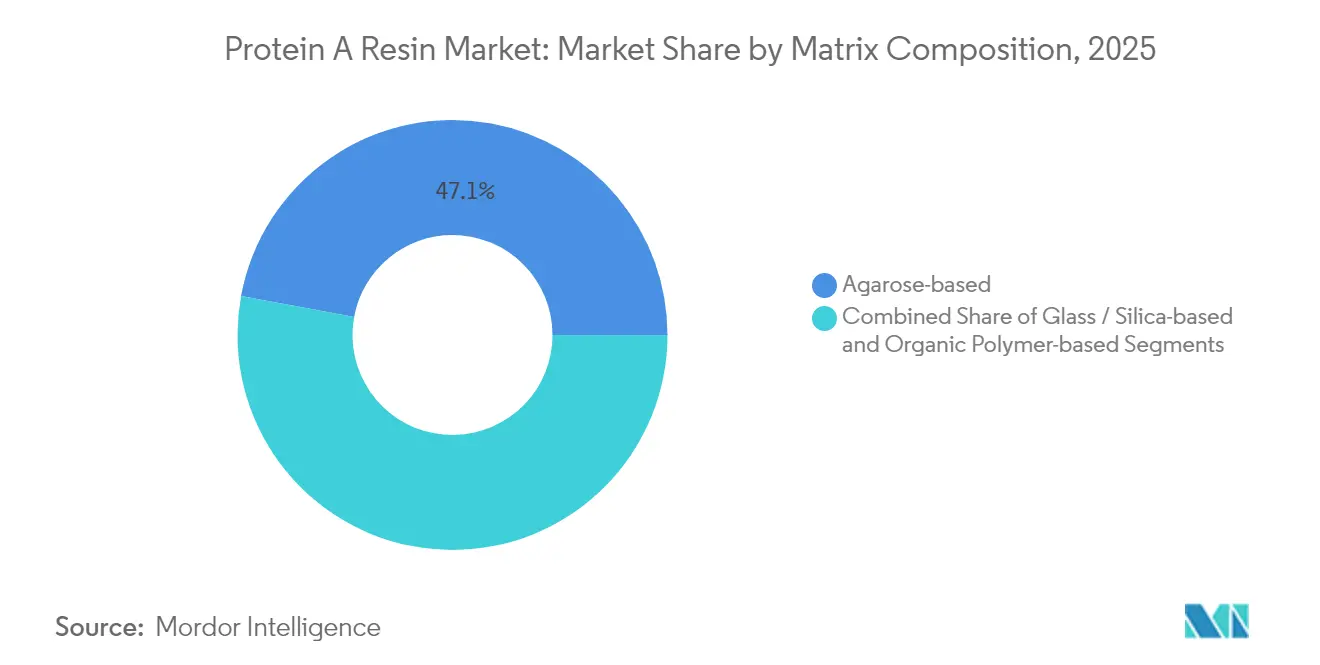
Agarose Dominance Faces Polymer InnovationAgarose media captured 47.10% of Protein A resin market share in 2025, buoyed by decades of regulatory acceptance and robust binding capacity. Within this group, recombinant-ligand variants supporting 0.5 M NaOH cleaning secure longer lifecycles, reducing per-gram costs and reinforcing loyalty. The Protein A resin market size tied to agarose formats is projected to grow steadily as blockbuster mAb volumes rise, yet polymer beads are encroaching due to superior pressure tolerance.
Organic polymer matrices, expanding at 9.31% CAGR, allow higher linear flow rates, trimming column footprints in space-constrained suites. Manufacturers tout hydrophilic coatings that curb non-specific binding while maintaining >50 g/L capacity. Fiber and silica chemistries remain niche but illustrate the sector’s appetite for productivity leaps. As users retrofit facilities, many adopt hybrid strategies: agarose for legacy products and polymer or fiber platforms for new assets, spreading spend across technology classes.


By Ligand Source:
Recombinant Protein A Strengthens Market PositionRecombinant ligands held 59.10% share in 2025 as drug makers prioritized batch consistency, reduced adventitious-agent risk, and higher caustic stability. The Protein A resin market size attributable to recombinant platforms will rise further because emerging high-titer processes impose harsher cleaning protocols that native ligands cannot withstand.
Natural Protein A, though growing 9.55% CAGR, serves specialized R&D or diagnostic applications where authentic binding kinetics matter more than caustic durability. Suppliers engineer plant-derived production routes to sidestep animal-origin concerns, yet still face lot-variability challenges. In commercial manufacturing, stringent validation steers users to recombinant versions bundled with exhaustive leachables data, an advantage hard to replicate for newcomers.
By Application:
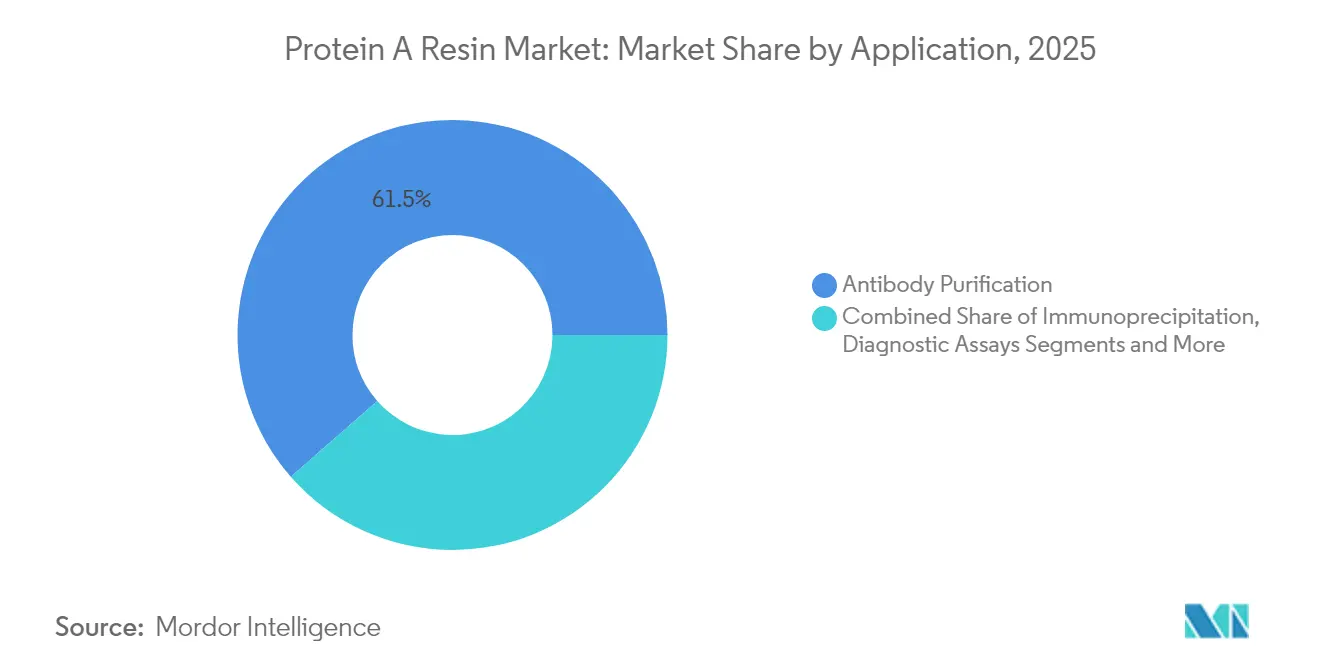
Antibody Purification Drives Market ExpansionAntibody capture accounted for 61.45% of Protein A resin's market share in 2025, the most significant slice of the market. New drug approvals and indication expansions sustain this volume, while next-generation modalities (bispecifics, ADCs) largely retain Fc regions, ensuring continued reliance on Protein A.
Immunoprecipitation, set for a 9.05% CAGR, benefits from academic funding and high-throughput proteomics that consume small pre-packed columns. Diagnostic assay developers demand ever-tighter ligand leaching specs, fostering micro-scale resin variants with stringent QC certificates. Collectively, application diversification insulates the Protein A resin market from lifecycle dips in any single therapeutic class.
By End User:
Pharma Leadership with Academic AccelerationCommercial manufacturers controlled a 59.80% share in 2025, underpinning the bulk of recurring bulk resin orders that define the Protein A resin market. Their priorities revolve around column lifetime, supply security, and regulatory support. The Protein A resin industry also observes CDMOs increasing share as outsourcing momentum accelerates.
Academic and research institutes, expanding at a 9.42% CAGR, elevate demand for smaller cartridge formats and rapid-cycle fibers suited to parallel screening. Grant-funded labs value up-front cost and ready-to-use convenience over ultrahigh binding, prompting vendors to offer flexible pack sizes. Diagnostic labs, though niche, are exploring continuous capture to improve reagent throughput, an adjacent growth pocket for sophisticated resin chemistries.
Geography Analysis
North America Protein a Resin Market
North America commanded 40.50% of Protein A resin market share in 2025, aided by USD 1 billion-plus capacity builds from Amgen and a USD 1.2 billion CDMO expansion by Fujifilm in North Carolina. The region’s stringent FDA oversight elevates recombinant-ligand adoption and rewards suppliers offering comprehensive DMF support. Federal initiatives that link public R&D to domestic manufacturing further fortify local demand for high-performance resins.
APAC Protein a Resin Market
Asia-Pacific is the fastest-growing arena, charting a 9.82% CAGR to 2031 as China consolidates its role as an outsourcing powerhouse and governments push self-sufficiency. WuXi Biologics’ 15,000 L PPQ milestone in Hangzhou signals large-scale technical maturity, stimulating broader uptake of advanced adsorbents. Regional suppliers are investing in local bead production to sidestep import duties and shorten lead times, yet multinational vendors still dominate complex ligand chemistries.
EMEA and South America Protein a Resin Market
Europe retains a sizeable installed base but faces evolving GMP Annex 1 directives that tighten contamination control expectations. Sustainability mandates are reshaping procurement, causing buyers to scrutinize mineral-oil usage and resin recyclability. Vendors with verified low-carbon jetting processes gain a competitive edge. Secondary markets in South America, the Middle East, and Africa show emerging activity through technology-transfer pacts and government-backed biopark initiatives, but presently generate limited volume.

Regulatory Landscape
The United States Pharmacopeia (USP) 130 Protein A Quality Attributes governs ligand leaching clearance and validation of removal steps in Protein A resin processing. U.S. FDA and EMA oversight shape raw-material qualification and process validation, and regulator guidance places emphasis on residual testing using ELISA, alongside documented resin and ligand quality throughout the manufacturing lifecycle.
Competitive Landscape
Global competition is moderately concentrated, with Cytiva and Thermo Fisher Scientific collectively controlling a meaningful portion of the Protein A resin market share through broad portfolios and global service networks. Product innovation remains the primary differentiator: Cytiva’s PrismA fibers offer ten-fold productivity jumps, whereas Thermo Fisher leverages recombinant Poros ligands to extend caustic tolerance. Repligen pursues acquisitive growth, including its 2024 purchase of chromatography innovator Tantti to deepen modal diversification.
Strategic partnerships surface as an avenue to blend ligand expertise with bead fabrication know-how. Ecolab’s USD 3.7 billion acquisition of Purolite delivered immediate scale and proprietary jetted-bead technology, showcased in the 50-micron AP+50 launch that promises record binding per liter. Similarly, the Ecolab-Repligen DurA Cycle affinity resin collaboration enables longer operational lifetimes for large-scale plants.
Barriers to entry hinge on regulatory files, ligand IP, and supply reliability rather than manufacturing capex alone. Polymer and fiber challengers are nibbling at share, yet must overcome entrenched customer validation data sets. The competitive set increasingly markets sustainability credentials to satisfy ESG procurement filters, adding a new battlefield alongside conventional quality and cost metrics.
Protein A Resin Industry Leaders
Bio-Rad Laboratories, Inc.
Merck KGaA
Agarose Bead Technologies
Danaher Corporation (Cytiva)
Thermo Fisher Scientific Inc.
- *Disclaimer: Major Players sorted in no particular order
Protein A Resin Market Companies Covered in this Report
- Agarose Beads Technologies
- Agilent Technologies
- Astrea Bioseparations Ltd.
- Astreasorb (TriAltis)
- Avantor Inc.
- Axplora
- Bio-Rad Laboratories
- Bio-Works Technologies AB
- Danaher
- GenScript Corporation
- JSR Life Sciences
- Kaneka
- Merck
- Novasep (Sartorius Axplora)
- Nuvia (Resin brand, Bio-Rad)
- ProMetic Bioseparations Ltd.
- Purolite Life Sciences (Ecolab)
- Repligen
- Thermo Fisher Scientific
- Tosoh Bioscience LLC

Market Opportunities and Future Outlook
Process-development white space is centered on resins that support continuous chromatography workflows and offer higher alkaline stability to extend cycle lifetimes, particularly as upstream titers rise and downstream capacity becomes the limiting factor. As buyers continue to adopt dual-sourcing for critical consumables, including Protein A resins, qualified secondary suppliers that can supply regulatory documentation and consistent lead times gain room to win repeat orders. Cytiva is investing in a second resin manufacturing site in Muskegon, Michigan, with operations anticipated by the end of 2028.
Recent Industry Developments in Protein A Resin Market
- April 2026: Merck completes acquisition of JSR Life Sciences' chromatography business, adding Amsphere A3 and Amsphere A+ Protein A resins. The acquisition strengthens Merck's downstream purification portfolio for mAbs and improves its Protein A resin market position.
- October 2025: Merck KGaA to acquire the chromatography business of JSR Life Sciences, including Amsphere Protein A resin technology. The transaction consolidates Merck's access to Protein A resin technology and expands its ligand capability and product family to compete on performance and regulatory support.
- June 2025: Purolite AP+50 50-micron jetted affinity resin launched. The launch introduces a high-capacity option with shorter lead times, shaping resin supplier dynamics and potential uptake in large-scale antibody purification.


Protein A Resin Market Report Scope and Research Methodology
Market Definition and Coverage
For this study, the protein A resin market includes revenue generated from protein A affinity chromatography resins used to capture and purify immunoglobulins, mainly during downstream bioprocessing of antibodies.
Scope exclusions: This sizing does not count chromatography systems, columns, buffers, or contract purification services that are purchased separately from the resin.
Segments Covered in This Report
- By Matrix Composition
- Agarose-based
- Glass / Silica-based
- Organic Polymer-based
- By Ligand Source
- Natural Protein A
- Recombinant Protein A
- By Application
- Antibody Purification
- Immunoprecipitation
- Diagnostic Assays
- Other Applications
- By End User
- Pharmaceutical & Biopharmaceutical Companies
- Contract Development & Manufacturing Organizations (CDMOs)
- Academic & Research Institutes
- Clinical Diagnostic Laboratories
- By Geography
- North America
- United States
- Canada
- Mexico
- Europe
- Germany
- United Kingdom
- France
- Italy
- Spain
- Rest of Europe
- Asia-Pacific
- China
- Japan
- India
- Australia
- South Korea
- Rest of Asia-Pacific
- Middle East and Africa
- GCC
- South Africa
- Rest of Middle East and Africa
- South America
- Brazil
- Argentina
- Rest of South America
- North America
Data Sources, Market Sizing, and Validation
Desk Research
Desk research was used to anchor the market to public signals that do not move with opinion. We relied on sources such as the US FDA approvals database for antibody launches, the WHO INN lists for biologics naming activity, and World Bank and IMF materials for macro and currency context, with OECD health and R&D indicators to cross-check demand direction.
We also reviewed peer-reviewed chromatography and bioprocessing papers to understand typical resin lifetimes, binding capacity trends, and changeovers between natural and recombinant ligands. This helped us avoid unrealistic usage rates. Company annual reports, investor decks, and reputable trade press were reviewed to frame capacity additions, supply constraints, and pricing pressure points. For hard-to-find but important confirmations, we used paid subscriptions for company financials and intelligence, news and financials, and a patent database to track innovation and commercialization signals. These desk sources are illustrative only, and additional references were used for data collection, validation, and research clarification.
Primary Interviews and Surveys
Primary work focused on validating the demand pool and practical pricing ranges for protein A resins, since procurement behavior can vary by manufacturing scale and regulatory readiness. We spoke with a mix of resin suppliers, bioprocessing users at biopharma manufacturing sites, and downstream processing specialists, then used follow-up checks to confirm replacement cycles, the impact of single-use adoption on resin consumption, and the share of spend that stays with protein A versus shifts to alternative capture options. Because this is a global market, responses were balanced across APAC, EMEA, and the Americas so regional capacity expansions and purchasing patterns were not over-weighted.
Distribution of primary research fieldwork respondents
| Company type | Respondent position | Region |
|---|---|---|
| Top tier: 25% | CXOs: 12% | APAC: 48% |
| Mid tier: 59% | Functional/Unit leaders: 32% | EMEA: 29% |
| Smaller Players: 16% | Managers: 56% | Americas: 23% |
Market-Sizing & Forecasting
We sized the market mainly through a top-down build where we reconstructed the downstream bioprocessing demand pool using antibody manufacturing scale indicators, then filtered it through capture-step intensity. To keep results realistic, we corroborated totals with selective bottom-up checks, including sampled resin volumes multiplied by typical ASP ranges, plus supplier and channel checks where coverage gaps appeared.
Key inputs that shaped the model included the pace of monoclonal antibody and biosimilar approvals, biomanufacturing capacity additions, typical protein A resin lifetime and reuse cycles, average binding capacity improvements that can reduce resin consumption per batch, and expected ASP movement by resin class as competitive offerings expand. Where data was thin for smaller countries, we used proxy indicators such as biologics production footprint and imports of bioprocessing consumables, then adjusted using interview feedback so the output stayed grounded.
For forecasting, scenario analysis was used around two high-impact items: the timing of biologics capacity ramps and the rate of process intensification that changes resin usage per gram of antibody. The final growth path was aligned to expert consensus collected during interviews, and it was stress-tested against historical growth patterns so we did not rely on a single aggressive assumption.
Data Validation & Update Cycle
Outputs were checked through multiple steps so the final value is not dependent on one assumption. We compared implied resin consumption against independent signals such as biomanufacturing capacity expansion announcements and biologics pipeline momentum, then reviewed anomalies before sign-off.
If a variance appeared between modeled spend and what buyers described in interviews, we re-contacted respondents and revisited assumptions on ASP, reuse cycles, and regional mix. Reports are refreshed annually, with interim updates when material events occur, such as sudden capacity expansions, supply interruptions, or notable price resets. Before delivery, an analyst performs a fresh pass on currency rates and key indicators so the latest updated view is reflected in the final numbers.
Mordor Intelligence's Protein A Resin Market Size Versus Other Published Estimates
Published numbers for protein A resin are often different because the market boundary is easy to stretch, and because pricing and replacement assumptions can swing the math. We also see gaps when estimates are carried forward without updating key inputs like currency timing, resin lifetime expectations, and recent ASP resets.
The main differences usually come from whether the estimate counts only protein A affinity resins or also bundles other chromatography resins and downstream consumables, which inflates totals. Another frequent driver is how pricing is handled, since some models keep one ASP trend for all resin types, while buyers often negotiate differently by scale and by qualification stage. By refreshing FX and price checkpoints closer to publication and re-validating reuse cycle assumptions with manufacturing-side respondents, the 2025 total stays tied to current procurement reality, which is a step applied in Mordor Intelligence.
Benchmark comparison
| Source | Market Size | Gaps in Research Methodology |
|---|---|---|
| Mordor Intelligence | USD 1.27 B (2025) | |
| Global Consultancy A | USD 1.12 B (2025) | This estimate appears to use a narrower demand pool, where slower ASP progression and longer resin replacement cycles reduce the implied annual spend, especially in large-scale antibody manufacturing. |
| Industry Publisher B | USD 0.74 B (2025) | The number aligns with a lower starting base and a more conservative view of resin consumption per batch, which can happen when capacity additions and process intensification impacts are not fully reflected in near-term demand. |
The table shows that the spread is mainly explained by how pricing and replacement behavior are treated, followed by how wide the included scope is around capture chromatography. Our approach keeps assumptions visible, updates the most sensitive inputs on a defined cadence, and cross-checks totals with buyer-side reality so the final value can be repeated and audited.


Key Questions Answered in the Report
How large is the Protein A resin market in 2026?
The Protein A resin market size is USD 1.38 billion in 2026.
What is the expected CAGR for Protein A resins through 2031?
The market is forecast to post an 8.58% CAGR between 2026 and 2031.
Which region is growing fastest for Protein A resin demand?
Asia-Pacific leads with a projected 9.82% CAGR over the forecast period.
Which application segment dominates Protein A resin consumption?
Antibody purification holds the largest share at 61.45% in 2025.
What is the main technological shift influencing future resin selection?
Adoption of fiber-based Protein A media that cut cycle times to minutes is reshaping purification strategies.
Page last updated on:


 Your data is secure and never sold or shared.


