
Propylene Glycol Market Size and Share
Market Overview
| Study Period | 2020 - 2031 |
|---|---|
| Market Volume (2026) | 5.36 Million tons |
| Market Volume (2031) | 7.76 Million tons |
| Growth Rate (2026 - 2031) | 7.68 % |
| Fastest Growing Market | Middle East and Africa |
| Largest Market | Asia Pacific |
| Market Concentration | Medium |
Major Players *Disclaimer: Major Players sorted in no particular order Image © Mordor Intelligence. Reuse requires attribution under CC BY 4.0. | |
Propylene Glycol Market Analysis by Mordor Intelligence
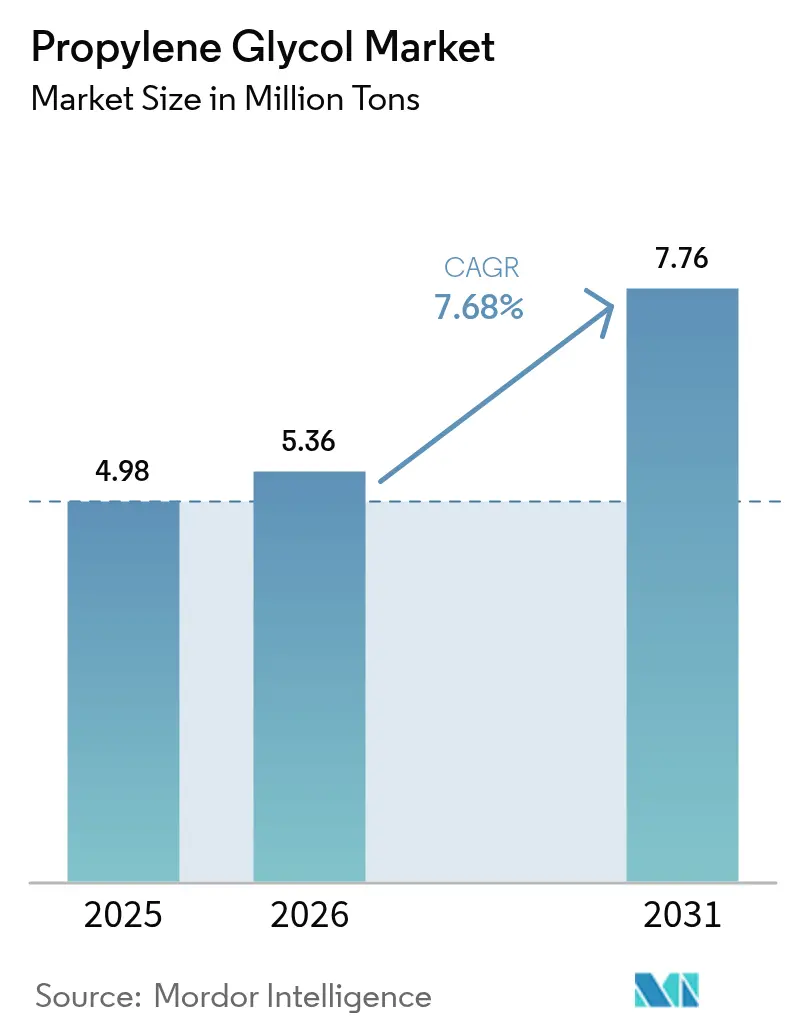
The Propylene Glycol market size is expected to grow from 4.98 million tons in 2025 to 5.36 million tons in 2026 and is forecast to reach 7.76 million tons by 2031 at 7.68% CAGR over 2026-2031. Demand strength comes from unsaturated polyester resin (UPR) composites used in wind-energy blades, the widening use of United States Pharmacopeia-grade material in injectable drugs, and rising volumes of low-toxicity thermal-management fluids for electric vehicles. Direct catalytic technologies that convert propylene to propylene glycol in a single step are lowering unit costs and easing the integration of bio-circular feedstocks, while large Chinese capacity additions weigh on near-term margins in commodity grades. Automotive electrification, global infrastructure spending, and regulatory momentum for safer excipients underpin medium-term growth, yet price swings in propylene oxide feedstock and tighter impurity limits in high-dose pharmaceutical uses introduce volatility. Producers that secure International Sustainability and Carbon Certification (ISCC) PLUS status and scale bio-based routes capture a price premium in personal-care and drug channels, creating a two-tier market characterized by sustainability-attributed and commodity volumes.
Key Report Takeaways
- By application, unsaturated polyester resins led with a 32.02% share of the propylene glycol market size in 2025. Personal-care intermediates are projected to expand at an 8.03% CAGR through 2031.
- By end-user industry, food and beverages accounted for 28.21% of the propylene glycol market share in 2025. Pharmaceuticals are forecast to post the fastest growth rate of 8.11% from 2021 to 2031.
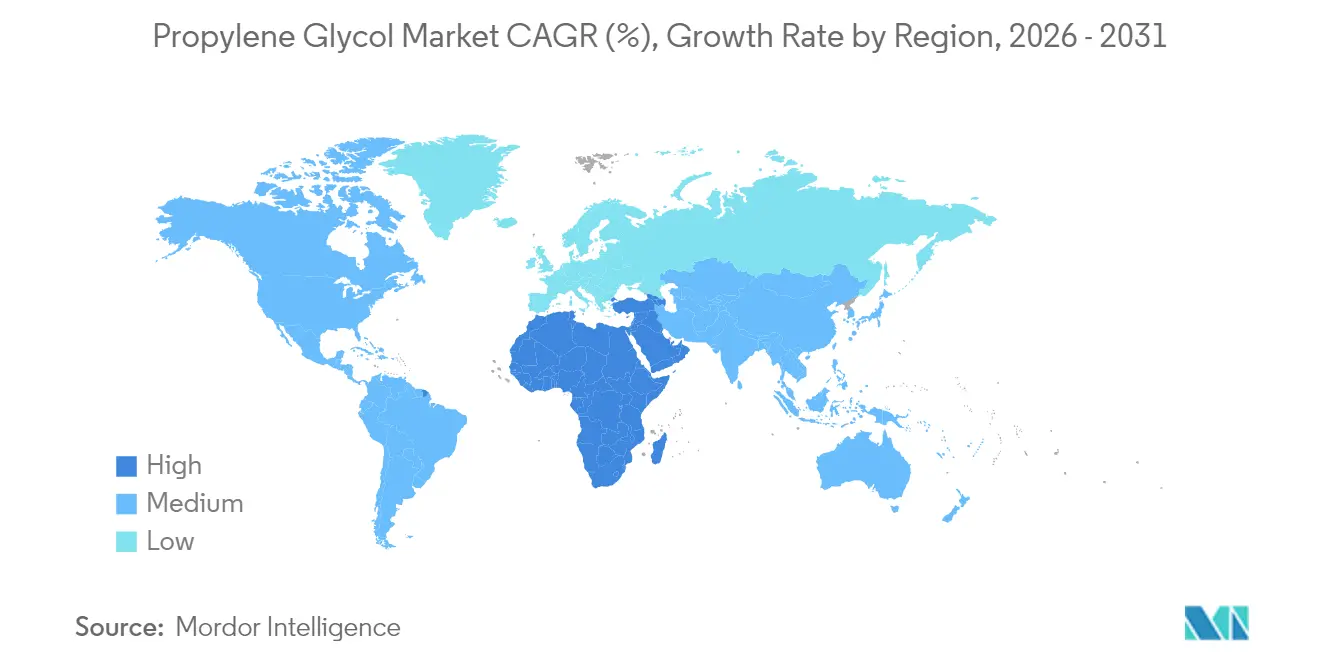
- By geography, the Asia-Pacific region captured 46.11% of the global volume in 2025, while the Middle-East and Africa are expected to register the highest 8.66% CAGR through 2031.
Note: Market size and forecast figures in this report are generated using Mordor Intelligence’s proprietary estimation framework, updated with the latest available data and insights as of 2026.
Market Trends and Insights
Drivers Impact Analysis of Propylene Glycol Market*
| Drivers | (~) % Impact on CAGR Forecast | Geographic Relevance | Impact Timeline |
|---|---|---|---|
| Surging demand from food and beverage formulators | +1.2% | North America, Europe, Asia-Pacific | Medium term (2-4 years) |
| Growing automotive coolant and de-icing fluid consumption | +1.8% | North America, Europe, China, Japan, South Korea | Short term (≤ 2 years) |
| Unsaturated polyester resin growth in composites and construction | +2.1% | Global, led by Asia-Pacific and Europe | Long term (≥ 4 years) |
| Bio-based capacity build-out in Asia | +1.0% | Thailand, China, spill-over to North America | Medium term (2-4 years) |
| Direct propylene-to-PG catalytic routes | +1.5% | Early adopters in North America and Europe | Long term (≥ 4 years) |
| Source: Mordor Intelligence | |||
Surging Demand from Food and Beverage Formulators
Regulatory recognition by the U.S. Food and Drug Administration under 21 CFR 184.1666 and the European Food Safety Authority’s E1520 listing allows formulators to use propylene glycol without labeling hurdles, making it one of the few synthetic humectants accepted in mainstream and value formulations. Beverage-alcohol producers rely on the molecule to carry flavor concentrates and preserve mouthfeel in reduced-sugar products, while bakery manufacturers use it to retain moisture and lengthen shelf life in ambient distribution. The September 2024 addition of new PG derivatives to the Environmental Protection Agency Safer Chemical Ingredients List confirmed regulators’ comfort with PG chemistry, and dairy processors across humid Asian markets now specify PG-based texture modifiers to prevent spoilage. Although premium organic brands still favor glycerin, mass-market products maintain high PG penetration in wet-snack and confectionery lines, resulting in a measurable 1.2 percentage-point lift to overall growth[1].
Growing Automotive Coolant and De-Icing Fluid Consumption
Electric-vehicle battery packs require thermal-management fluids that maintain cell temperatures between 15 °C and 35 °C, a specification that favors propylene glycol over ethylene glycol due to its lower toxicity and excellent low-temperature fluidity. Each battery electric vehicle consumes PG-based coolant during its lifetime, and incremental demand is substantial. Aviation safety norms also underpin growth, as Type I aircraft de-icing formulations depend on PG for freeze-point depression, and worldwide departures are projected to increase annually through 2030. Cold-climate markets in North America and Northern Europe account for a significant share of coolant volumes, but the Asia-Pacific region’s share is rising as national carbon-neutrality mandates in China and South Korea accelerate commercial-fleet electrification[2].
Unsaturated Polyester Resin Growth in Composites and Construction
Wind-energy expansion drives UPR consumption, with each gigawatt of new capacity requiring resin that contains propylene glycol as a reactive diluent. Offshore turbines employ next-generation resins containing PG by weight to achieve salt-spray resistance and longer maintenance intervals. Municipal infrastructure, such as chemical storage tanks and wastewater systems, utilizes PG-extended resins for corrosion resistance at a competitive cost. Meanwhile, governments in India and Southeast Asia specify UPR panels in modular housing programs, targeting a long service life. The construction sector’s uptick and wind-energy buildouts combine to provide a boost to the CAGR.
Bio-Based PG Capacity Build-Out in Asia Accelerates Adoption
Thailand’s Map Ta Phut platform and China’s glycerol-to-PG pilots are bringing commercial-scale bio-routes to market. International Sustainability and Carbon Certification PLUS accreditation enables the mass-balance allocation of used cooking oil and agricultural residue feedstocks, allowing brand owners to record lower Scope 3 emissions without changing their formulations. U.S. soybean-based production exhibits lower greenhouse-gas intensity compared to petroleum-based routes, and similar metrics are attracting European personal-care brands facing 2030 recycled-content mandates. The supply push from new plants and the demand pull from sustainability scorecards contribute another 1 percentage point to growth.
Restraints Impact Analysis of Propylene Glycol Market*
| Restraints | (~) % Impact on CAGR Forecast | Geographic Relevance | Impact Timeline |
|---|---|---|---|
| Propylene-oxide price volatility linked to crude swings | −1.3% | Import-dependent Europe, India | Short term (≤ 2 years) |
| Regulatory scrutiny over residual impurities in high-dose uses | −0.6% | North America, Europe | Medium term (2-4 years) |
| Looming oversupply from rapid Chinese capacity additions | −1.8% | Global, price pressure from Asia | Short term (≤ 2 years) |
| Source: Mordor Intelligence | |||
Propylene-Oxide Price Volatility Linked to Crude Swings
Propylene oxide prices can fluctuate significantly within a single year because co-product credits and cracker run rates move in tandem with crude oil prices. When Brent drops beneath a certain threshold, naphtha crackers idle and propylene scarcity lifts PO prices, just as downstream demand weakens. Conversely, crude rallies encourage cracking, flooding the propylene pool, and compressing PO margins. Such instability forces buyers to hold larger inventories and erodes producer visibility.
Regulatory Scrutiny Over Residual Impurities in High-Dose Uses
Injectable pharmaceuticals may deliver gram-level doses of PG per administration, and agencies now mandate tighter limits on diethylene glycol and propylene oxide residues after well-publicized contamination fatalities in 2022. Extra analytical steps add additional costs and extend batch release timelines. Some formulators substitute polyethylene glycol or propylene carbonate, reducing what would have been incremental pharmaceutical demand and impacting growth.
*Our forecasts treat driver/restraint impacts as directional, not additive. The impact forecasts reflect baseline growth, mix effects, and variable interactions.
Propylene Glycol Market Segment Analysis
By Application:
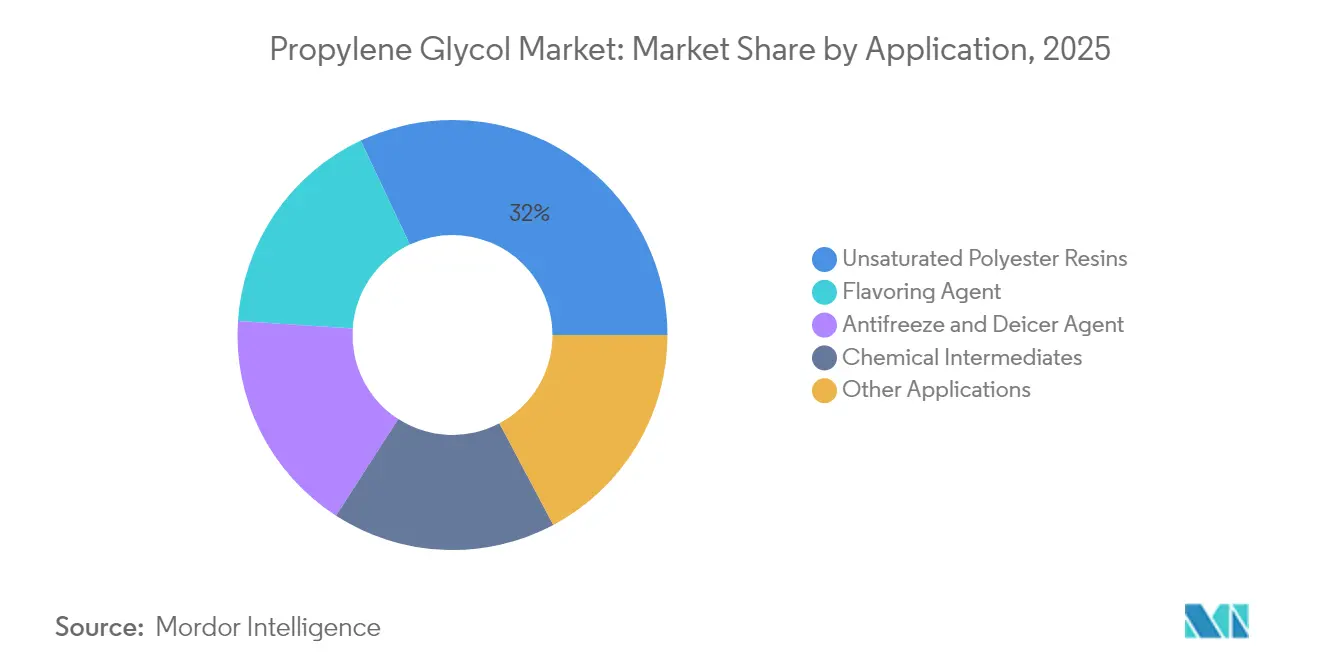
Composites Anchor Volume, Personal Care Leads GrowthUnsaturated polyester resins accounted for 32.02% of the propylene glycol market size in 2025, as wind-turbine blades and corrosion-resistant infrastructure absorbed large volumes of resin. Vehicle electrification and aviation safety rules demand antifreeze and de-icing agents, while chemical intermediates such as propylene carbonate and dipropylene glycol underpin the production of polyurethane and surfactants. Personal-care intermediates grow at the fastest rate, with an 8.03% CAGR, as esters and ethers penetrate leave-on cosmetics.
More formulators now pay premiums for ISCC PLUS-certified bio-circular grades, especially in the personal care sector, whereas cost-sensitive UPR compounders adopt them only when green-building certifications are required. Semiconductor photoresist strippers rely on propylene glycol monomethyl ether, a niche product that commands a premium price due to its electronics-grade purity. The diversification of demand across specialty and commodity uses enables producers to hedge cyclical exposure; however, success hinges on solvent-purity investments and quick-change logistics for multi-grade portfolios.

By End-User Industry:
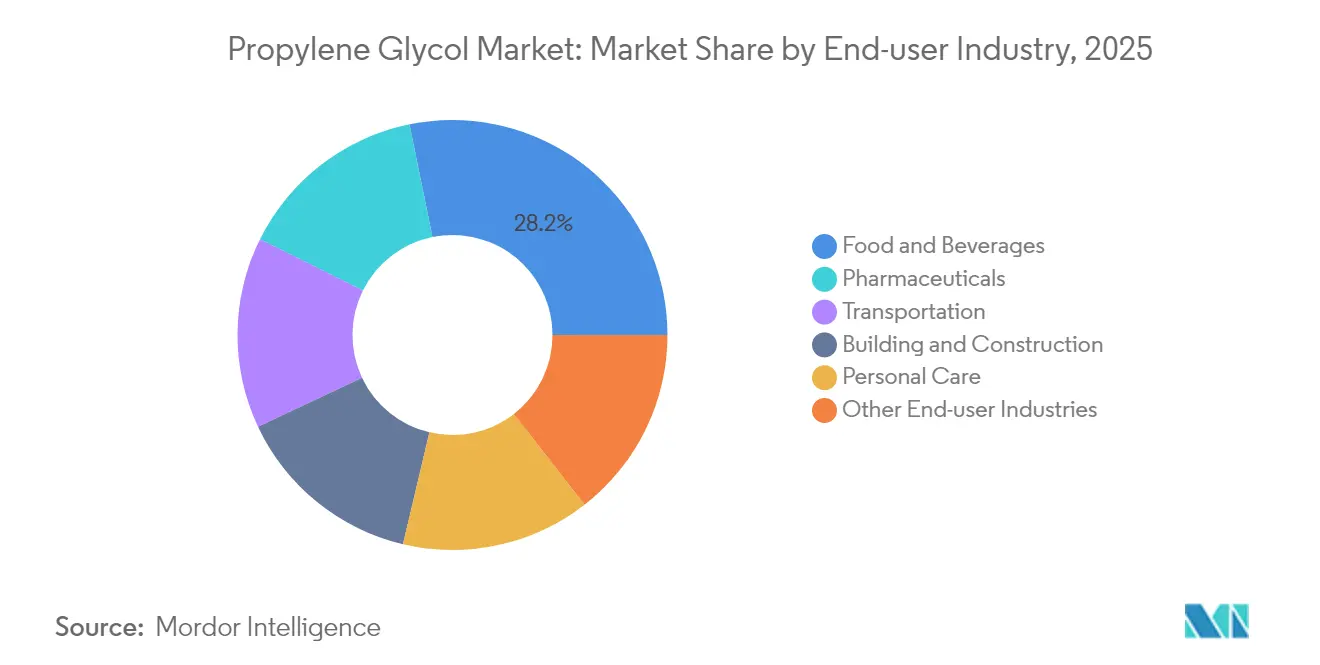
Pharmaceuticals Outpace Food Despite Smaller BaseFood and beverages retained 28.21% of the propylene glycol market share in 2025, as GRAS and EFSA clearances simplify formulation across beverages, bakery, and confectionery products. Pharmaceuticals, however, are expected to grow at an 8.11% CAGR as drug makers switch from ethylene glycol to meet stricter toxicity thresholds and adopt polyglycol in topical and transdermal systems. Transportation, encompassing automotive, aviation, and marine coolants, trajectory lifted by the growing needs for electric-vehicle battery thermal management.
Building and construction consume a significant portion of PG via UPR composites, and personal-care products secure a notable share through humectants and emollients. Electronics cooling in data centers and agricultural adjuvants provide smaller but rising outlets. Pharmaceutical purity requirements favor large, dedicated facilities that can quickly certify batches, pushing smaller players toward commodity niches unless they retrofit high-purity trains.
Geography Analysis
APAC Propylene Glycol Market
Asia-Pacific controlled 46.11% of the global propylene glycol market volume in 2025, driven by integrated propane dehydrogenation and PO chains in China, as well as export-oriented plants in Thailand. The Map Ta Phut site in Thailand, which has recently expanded, now ships ISCC PLUS-certified grades to Japan and South Korea. India is set to significantly increase its domestic capacity once Manali Petrochemicals gains operating consent, targeting high-margin food and pharmaceutical users. Yet the region’s near-term margins remain pressured by under-utilized Chinese assets that weigh on spot prices.
MEA Propylene Glycol Market
The Middle-East and Africa are expected to record the fastest growth rate of 8.66% from 2026 to 2031, driven by Saudi Arabian projects that monetize refinery off-gases into propylene derivatives. Low ethane costs give regional producers an energy advantage that supports exports to Europe and India, although recent feedstock price adjustments have compressed margins.
North America Propylene Glycol Market
North America represents a notable portion of demand, primarily driven by the United States’ automotive, pharmaceutical, and beverage sectors. New propylene metathesis capacity at Channelview, Texas, promises feedstock flexibility, while EPA NESHAP rules could force consolidation among smaller players that lack capital for emission controls.
Europe Propylene Glycol Market
Europe accounts for a significant share of the global volume. The bloc’s carbon-border measures and 2030 recycled-content targets accelerate bio-PG uptake, with ISCC PLUS-certified grades from Germany and Thailand filling premium channels. Electrically heated crackers, pilot-tested in Germany, hint at a future decarbonized propylene; however, their economics depend on carbon prices reaching certain thresholds.
South America Propylene Glycol Market
South America holds a smaller share, led by Brazil’s beverage and personal-care manufacturers. Limited local PO assets compel imports, which face duties and restrain growth, even though sugarcane ethanol and biodiesel glycerol present long-term bio-feedstock opportunities.
Mordor Intelligence provides coverage of the propylene glycol market across other key regional markets. Detailed country-level analysis extends to Germany incorporating local coverage and market participation, as required.
Regulatory Landscape
Propylene glycol retains broad food-use acceptance, which supports demand in mainstream formulations. In the US, the FDA lists propylene glycol as GRAS under 21 CFR 582.4666 (updated through 2026), while Codex Alimentarius provisions for INS 1520 set maximum use levels in specific categories, including bakery wares and chewing gum in the GSFA online listing. With EFSA and JECFA positions supporting a 25 mg/kg body weight/day ADI reference, compliance is centered on good manufacturing practice and category-specific limits rather than blanket restrictions.
For pharmaceutical uses, regulators have tightened quality expectations for toxic contaminants following contamination incidents in excipient supply chains. The European Pharmacopoeia revised the Propylene Glycol monograph (Ph. Eur. 0430), effective January 1, 2025, adding explicit testing requirements for ethylene glycol and diethylene glycol, while FDA guidance and cGMP expectations reinforce similar risk-based testing for high-risk contaminants in drug components. This has pushed producers and distributors toward stronger analytical controls, traceability, and segregation of USP/Ph. Eur. grades from commodity volumes.
Value Chain Analysis
The value chain begins with petrochemical feedstocks, where propylene is converted to propylene oxide (PO) and then hydrated to mono propylene glycol. Co-products and purification steps yield other glycols and solvent-grade derivatives. A renewable alternative uses glycerol hydrogenolysis, often linked to biodiesel-derived glycerin streams, and is increasingly commercialized alongside mass-balance approaches that rely on third-party certification such as ISCC PLUS for claims in personal care and pharmaceutical channels.
For large-volume producers, upstream integration into PO and access to reliable utilities and logistics remain key cost drivers. Specialty demand then shifts the chain toward dedicated purification, QC labs, and compliant packaging for USP/Ph. Eur. grades. Distribution generally moves through bulk terminals, regional chemical distributors, and direct supply to large formulators using propylene glycol in UPR, food and beverages, transportation fluids, and pharmaceuticals. Recent steps like Dow earning ISCC PLUS certification for Map Ta Phut (March 2025) and Manali Petrochemicals bringing on additional capacity (July 2025) illustrate how certification and regional capacity additions affect channel access and lead times.
Competitive Landscape
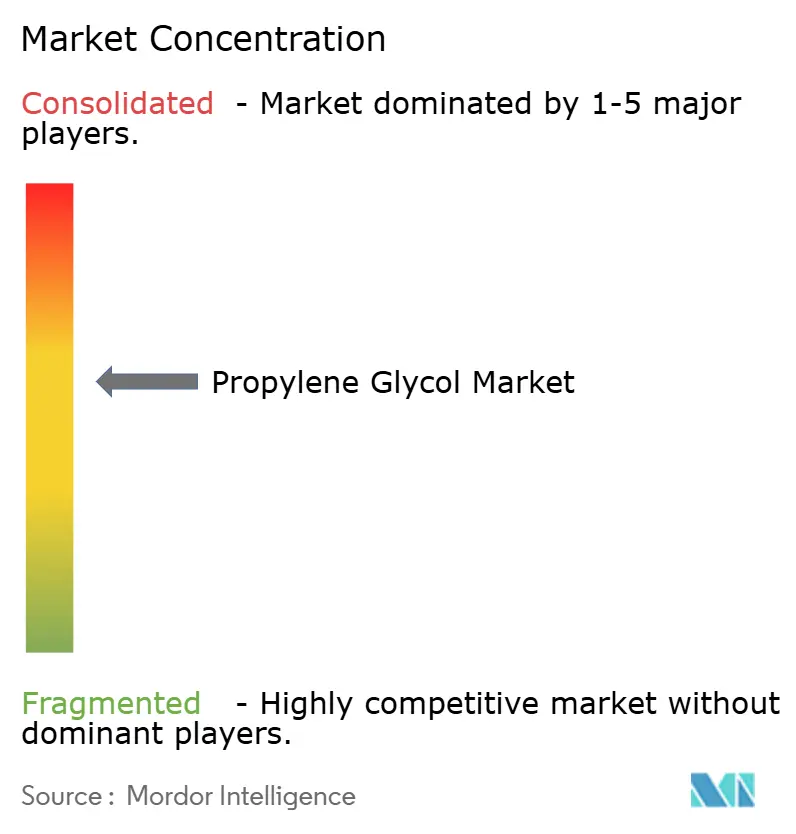
The propylene glycol market is moderately consolidated. White-space opportunities include high-purity injectable grades, electronics-grade propylene glycol monomethyl ether for semiconductor fabs, and bio-circular volumes that satisfy European Scope 3 reporting. Technology disruptors aim to cut costs and emissions simultaneously. Process-licensing revenue is emerging as a strategic play for innovators without large balance sheets. Certification has become a competitive moat, and smaller producers lacking audit-ready traceability may seek mergers to gain market access.
Propylene Glycol Industry Leaders
-
Dow
-
LyondellBasell Industries Holdings B.V.
-
BASF
-
INEOS
-
ADM
- *Disclaimer: Major Players sorted in no particular order
Propylene Glycol Market Companies Covered in this Report
- ADEKA Corporation
- ADM
- AGC Chemicals
- BASF
- Cargill, Incorporated.
- Chaoyang Chemicals Inc.
- Dow
- Eastman Chemical Company
- Global Bio-chem Technology Group Co. Ltd
- Golden Dyechem
- Huntsman International LLC
- Indorama Ventures Public Company Limited.
- INEOS
- KLK Temix
- Lonza
- LyondellBasell Industries Holdings B.V.
- Manali Petrochemicals Limited
- Repsol
- Shell plc
- SKC Chemicals
- Sumitomo Chemical Co., Ltd.
Market Opportunities and Future Outlook
A key whitespace is the expansion of sustainability-attributed propylene glycol (bio-circular, circular, or bio-based), where brand owners can document Scope 3 reductions without reformulating, assuming suppliers can support chain-of-custody audits. Dow has used ISCC PLUS to commercialize circular and bio-circular propylene glycol (CIR and REN). On the supply side, it started up an 80,000 tons per year capacity expansion at Map Ta Phut, Thailand (May 2024), increasing total capacity there to 250,000 tons per year and strengthening Asia export capability for certified grades.
A second opportunity is building non-PO renewable production routes to diversify feedstock risk and broaden the premium addressable segment beyond mass-balance volumes. In May 2026, UPM agreed to acquire intellectual property related to Avantium's Ray Technology for producing bio-based mono propylene glycol from plant-based sugars, and UPMs Leuna biorefinery startup activities in 2026 point to a path toward commercial sugar-to-glycol output. In parallel, tighter impurity scrutiny in high-dose pharmaceutical applications supports demand for producers that invest in enhanced analytical controls, segregation, and dedicated high-purity trains to meet evolving pharmacopoeial and regulator expectations.
Recent Industry Developments in Propylene Glycol Market
- May 2026: Dow announced a price increase for several propylene glycol product lines in North America, effective June 2, 2026. The announcement reflected ongoing cost and supply tightness across glycol chains, and it influenced contract negotiations for major end uses such as transportation fluids, food formulations, and industrial intermediates.
- March 2025: Dow secured ISCC PLUS certification for its propylene glycol manufacturing at Map Ta Phut, Thailand and introduced mass-balance offerings positioned as circular and bio-circular grades. The certification expanded access for customers that require audited sustainability claims, particularly in personal care, pharmaceuticals, and food applications.
- May 2024: Dow started up an 80,000 tons per year propylene glycol capacity expansion at its Map Ta Phut facility in Thailand, raising total capacity there to 250,000 tons per year. The additional capacity increased supply availability into Asia-Pacific and export markets, shifting regional balances for both commodity and higher-value certified grades.
Propylene Glycol Market Report Scope and Research Methodology
Market Definition and Coverage
For this methodology, the propylene glycol market is defined as the global demand and supply of propylene glycol sold across grades for downstream uses such as antifreeze and deicers, unsaturated polyester resins, chemical intermediates, and other industrial and consumer formulations.
Scope exclusions: We exclude upstream propylene oxide and other feedstock markets, along with downstream finished products where propylene glycol is only one input (for example, packaged coolants, resins, or personal care end products).
Segments Covered in This Report
- By Application
- Flavoring Agent
- Antifreeze and Deicer Agent
- Unsaturated Polyester Resins
- Chemical Intermediates
- Other Applications (Antioxidants, Household Care, etc.)
- By End-user Industry
- Transportation
- Building and Construction
- Food and Beverages
- Personal Care
- Pharmaceuticals
- Other End-user Industries (Electronics, Paints and Coatings, etc.)
- By Geography
- Asia-Pacific
- China
- India
- Japan
- South Korea
- ASEAN Countries
- Rest of Asia-Pacific
- North America
- United States
- Canada
- Mexico
- Europe
- Germany
- United Kingdom
- Italy
- France
- Spain
- Russia
- Rest of Europe
- South America
- Brazil
- Argentina
- Rest of South America
- Middle-East and Africa
- Saudi Arabia
- South Africa
- Rest of Middle-East and Africa
- Asia-Pacific
Data Sources, Market Sizing, and Validation
Desk Research
Desk research was used to set the industry boundaries and to build the first list of supply nodes, demand centers, and typical end-use splits. We referenced public sources such as UN Comtrade for trade flows, national statistics offices for chemical output indicators, the US International Trade Commission data portals for import and export context, and US EPA and ECHA publications that clarify chemical use and handling rules. For application-side demand signals, we also reviewed sources like the US Department of Energy (for automotive and thermal fluids context) and peer-reviewed polymer and composites journals that discuss UPR consumption patterns.
Along with these, we looked at annual reports, investor presentations, and press releases to track capacity changes, turnaround schedules, and grade positioning, which then helped us set sensible volume and price ranges. Where needed, paid subscriptions were used for company financials and news screening, import-export shipment level checks, and patent databases to corroborate technology shifts that can influence yields and cost curves. The sources listed here are illustrative only, and we also used other public references to collect data points, validate assumptions, and clarify open questions.
Primary Interviews and Surveys
Primary interviews and structured surveys were used to validate the demand pool and the pricing logic across key end uses, especially where public datasets do not clearly separate propylene glycol from adjacent glycols. We spoke with a mix of producers, distributors, formulators, and large end users so that grade-level demand shifts and substitution behavior could be described in practical terms. Since this is a global market, inputs were balanced across APAC, EMEA, and the Americas to reflect regional differences in capacity additions, import reliance, and typical contract cycles.
Distribution of primary research fieldwork respondents
| Company type | Respondent position | Region |
|---|---|---|
| Top tier: 26% | CXOs: 12% | APAC: 46% |
| Mid tier: 57% | Functional/Unit leaders: 42% | EMEA: 35% |
| Smaller Players: 17% | Managers: 46% | Americas: 19% |
Market-Sizing & Forecasting
The market was primarily sized using a top-down approach where production and trade indicators were used to reconstruct apparent consumption by region, which was then allocated to major applications based on adoption patterns discussed by industry participants. To keep totals realistic, we corroborated the outputs with selective bottom-up approximations, such as sampled supplier volumes, distributor channel checks, and typical ASP ranges multiplied by estimated volumes for major end uses.
A few practical inputs shaped the model: regional capacity additions and operating rates, net imports and exports by relevant HS codes, the share of USP and other higher grade material in total consumption, and end-use activity signals like UPR composite output and antifreeze and deicer demand patterns tied to vehicle parc and weather exposure. Pricing was handled using blended ASPs that reflect contract versus spot behavior, grade mix, and region-specific currency timing, and then the values were aligned back to volume sanity checks. Where direct volume splits were missing, gaps were handled by using proxy ratios from closely tracked application indicators and then confirmed in follow-up calls before final allocation.
For forecasting, we used scenario analysis anchored to expected capacity changes, trade rebalancing, and end-use growth expectations, with assumptions reviewed against expert consensus from primary discussions. The forecast was then stress-tested by checking whether implied supply-demand balances remain feasible and whether the modeled ASP progression stays inside realistic historical ranges.
Data Validation & Update Cycle
Outputs were checked through triangulation across independent signals, including whether regional consumption patterns align with trade direction, whether implied operating rates fall within normal bounds, and whether application shares move in ways that match known end-market trends. Any large variance triggered a second pass on assumptions, followed by targeted re-contacts with respondents to confirm whether the issue was scope related, timing related, or data related.
Before sign-off, the model is reviewed in multiple steps, including an internal analyst review focused on arithmetic integrity, unit consistency, and outlier behavior across regions and applications. The report is refreshed annually, and interim updates are made when material events occur, such as major capacity restarts, disruptions, or policy changes that impact flows. Right before delivery, we run a final update sweep so clients receive the latest aligned view rather than an older snapshot.
Mordor Intelligence's Propylene Glycol Market Size Versus Other Published Estimates
Published market sizes for propylene glycol often differ because the underlying measurement unit, scope edges, and price timing are not handled in the same way across sources. Some studies report only value, others lead with volume, and a few blend the two without explaining how prices were built up from grades and contract cycles.
The gaps usually come from what gets counted as propylene glycol demand versus adjacent glycols, how regional trade is netted out, and whether the price deck uses a single annual average or a period-aligned mix of spot and contract ASPs. Another common driver is refresh cadence, since late capacity changes and currency swings can shift the latest year more than the long-term trend. To address this, our model keeps currency timing and validation checks current in each update cycle, which aligns with a refresh-led choice applied by Mordor Intelligence.
Benchmark comparison
| Source | Market Size | Gaps in Research Methodology |
|---|---|---|
| Mordor Intelligence | USD 5.36 M (2026) | |
| Trade Journal A | USD 4.81 B (2024) | This figure is value-led and appears to use a single blended price for the year, which can shift totals when grade mix and contract timing differ by region. The scope notes are limited, so adjacent glycols and downstream formulations may be partially included, which inflates comparability gaps. |
| Global Consultancy B | USD 6.40 B (2025) | The estimate is anchored to a different base year and may rely on broader type definitions and simplified import-export handling, which can misstate apparent consumption in net importing regions. It also appears to apply a uniform CAGR and price progression, rather than adjusting ASPs based on regional contract cycles and currency timing. |
Looking across the three values, the spread is mainly explained by unit treatment and price construction, followed by what is included at the boundary between propylene glycol and nearby categories. By keeping the model traceable to capacity, trade balance, application shares, and realistic ASP ranges, the final number can be followed and repeated without needing hard-to-access datasets.
Key Questions Answered in the Report
How big is the propylene glycol market in 2026?
The market is projected to stand at 5.36 million tons in 2026 and is expected to reach 7.76 million tons by 2031.
What is the expected growth rate for propylene glycol through 2031?
Volume is projected to increase at a 7.68% CAGR over the 2026-2031 period.
Which application segment consumes the most propylene glycol?
Unsaturated polyester resins lead, holding 32.02% of demand in 2025, largely from wind-energy and infrastructure composites.
Which end-user industry will grow fastest?
Pharmaceuticals will advance at an 8.11% CAGR as injectable and topical formulations adopt propylene glycol for solubilization.
Which region offers the highest growth potential?
The Middle-East and Africa are expected to lead with an 8.66% CAGR, supported by integrated petrochemical investments in Saudi Arabia and the UAE.