
Market Overview
| Study Period | 2020 - 2031 |
|---|---|
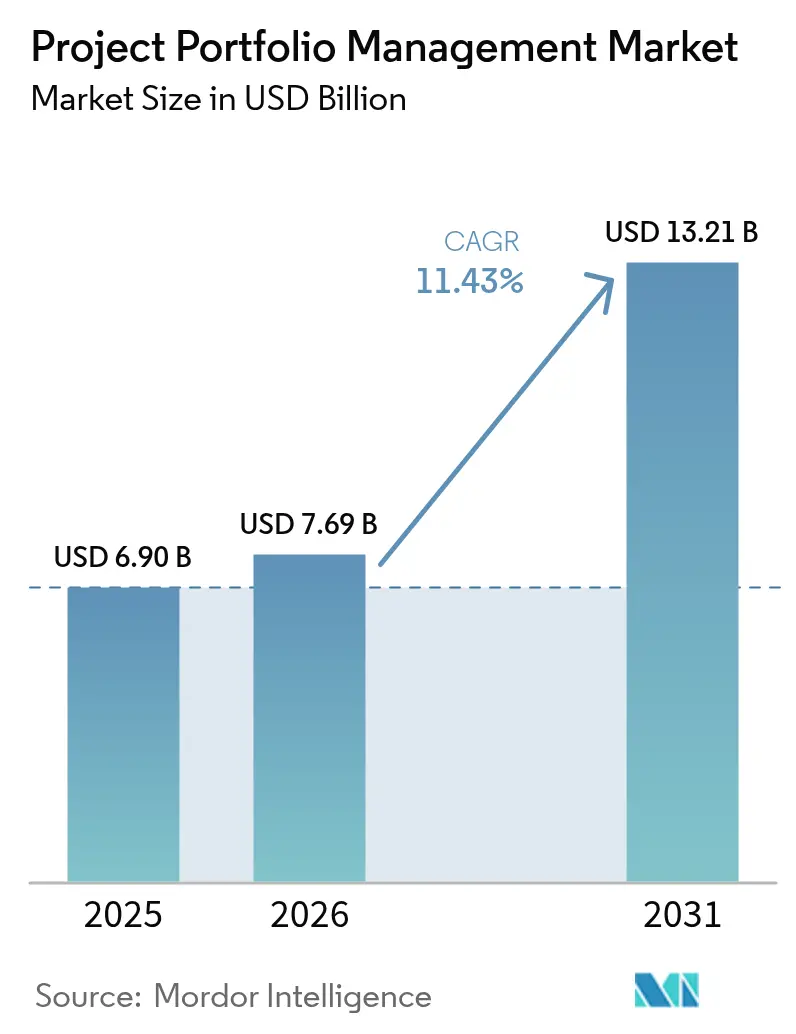
| Market Size (2026) | USD 7.69 Billion |
| Market Size (2031) | USD 13.21 Billion |
| Growth Rate (2026 - 2031) | 11.43 % |
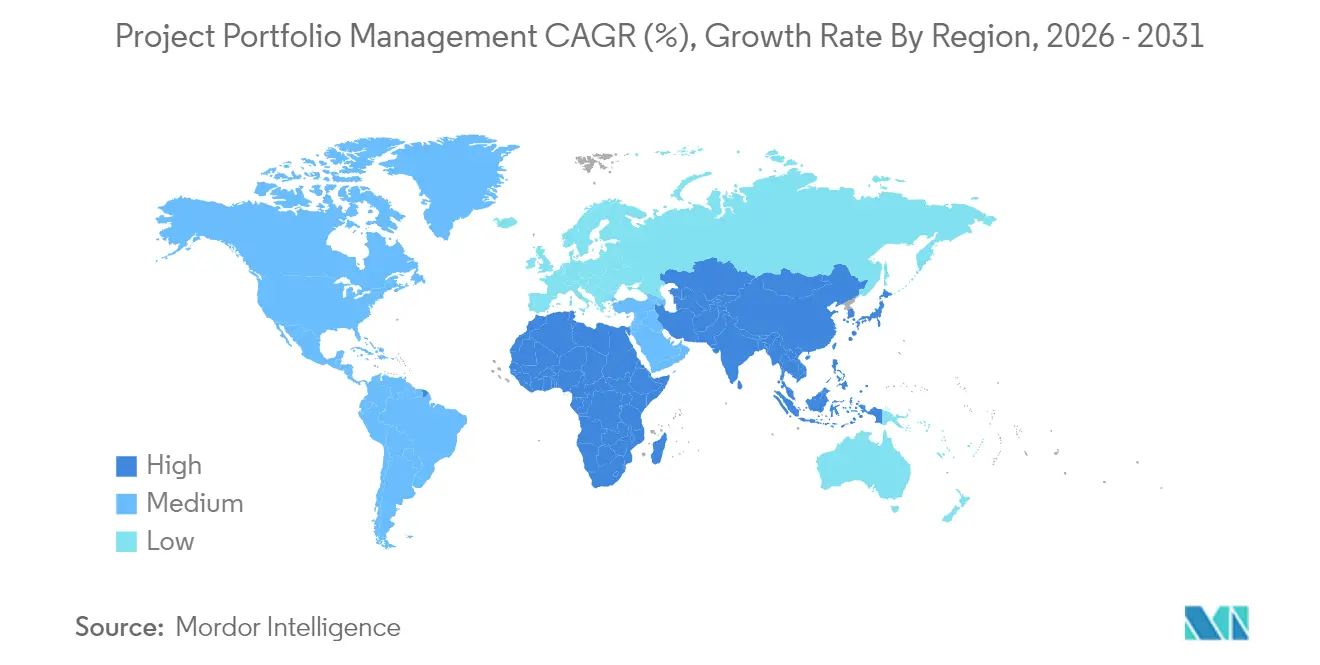
| Fastest Growing Market | Asia Pacific |
| Largest Market | North America |
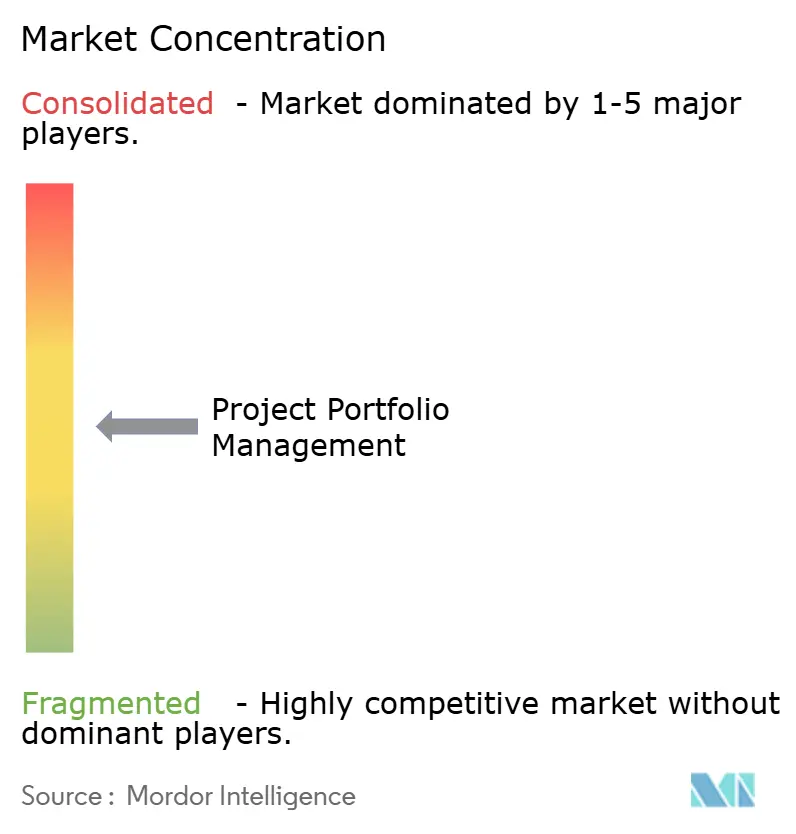
| Market Concentration | Medium |
Major Players *Disclaimer: Major Players sorted in no particular order Image © Mordor Intelligence. Reuse requires attribution under CC BY 4.0. | |
Project Portfolio Management Market Analysis by Mordor Intelligence
The project portfolio management market size is expected to grow from USD 6.90 billion in 2025 to USD 7.69 billion in 2026 and is forecast to reach USD 13.21 billion by 2031 at 11.43% CAGR over 2026-2031. Demand accelerates as hybrid work norms, AI-enabled forecasting, and stricter governance requirements make traditional point tools inadequate for multi-cloud, cross-functional programs. Organizations now treat project portfolio management platforms as strategic infrastructure that unifies financial governance with ESG-aligned capital deployment, sharpening competitive differentiation and enhancing resilience. Cloud deployment dominates because subscription pricing speeds time-to-value, while embedded analytics surfaces real-time insights that reduce budget overruns and resource idle time. Consolidation among vendors—backed by private-equity capital—signals confidence in long-term growth and raises barriers to entry through broader functionality, deeper integrations, and expanded geographic reach.
Key Report Takeaways
- By deployment type, cloud solutions held 69.45% of 2025 revenue while expanding at a 16.85% CAGR through 2031.
- By component, solutions accounted for 68.40% of 2025 revenue; services represent the fastest-growing component at a 11.74% CAGR to 2031.
- By organization size, large enterprises commanded 60.30% of 2025 spending, whereas SMEs are set to grow at a 12.60% CAGR to 2031.
- By application, project management captured 31.60% of the 2025 project portfolio management market share, while resource and capacity management is poised for a 14.78% CAGR.
- By end-user vertical, IT and telecom captured 35.60% of 2025, healthcare & life sciences posts the fastest 13.58% CAGR, fueled by clinical-trial digitization, FDA 21 CFR Part 11 validation, and telehealth infrastructure rollouts.
- By geography, North America led with 39.40% of 2025 revenue; APAC is forecast to rise at an 10.95% CAGR through 2031.
Note: Market size and forecast figures in this report are generated using Mordor Intelligence’s proprietary estimation framework, updated with the latest available data and insights as of 2026.
Market Trends and Insights
Drivers Impact Analysis of Project Portfolio Management Market*
| Driver | (~) % Impact on CAGR Forecast | Geographic Relevance | Impact Timeline |
|---|---|---|---|
| Hybrid/remote-work acceleration requires centralized resource visibility | +2.1% | Global; strongest in North America and Europe | Short term (≤ 2 years) |
| Rise of cloud-native, AI-augmented PPM suites | +2.8% | Global; led by North America, expanding in APAC | Medium term (2-4 years) |
| Integration of Agile & DevOps with strategic portfolio planning | +1.9% | North America and Europe core; spill-over to APAC | Medium term (2-4 years) |
| Demand for real-time project financial governance amid cost inflation | +1.7% | Global; acute in developed markets | Short term (≤ 2 years) |
| Vertical-specific compliance boosting niche PPM uptake | +1.4% | Regulated markets globally, concentrated in NA & EU | Long term (≥ 4 years) |
| ESG-driven capital-allocation scrutiny | +1.3% | Europe leading; NA following; emerging in APAC | Long term (≥ 4 years) |
| Source: Mordor Intelligence | |||
Hybrid/Remote-Work Acceleration Requires Centralized Resource Visibility
Distributed work now anchors corporate operating models. Seventy-nine percent of knowledge workers collaborate across time zones, forcing enterprises to seek real-time dashboards that surface utilization gaps, predict bottlenecks, and maintain accountability. Traditional Gantt-centric oversight cannot track asynchronous workloads, so adoption of enterprise-wide resource engines is surging. These platforms support instant cross-portfolio re-prioritization, enabling managers to redeploy scarce skills without disrupting delivery commitments. By creating a single source of truth, organizations both improve productivity and de-risk regulatory audits that demand transparent labor reporting.
Rise of Cloud-Native, AI-Augmented PPM Suites
Cloud implementations provision in weeks rather than quarters and eliminate capital hardware outlays, generating 40-80% cost savings while releasing IT staff for higher-value tasks [1]. Embedded machine-learning models predict risk, auto-schedule tasks, and recommend resource swaps, lifting on-time delivery rates and sharpening strategic alignment. Twenty-one percent of project managers already use AI frequently, and 82% of executives expect material operational impact within five years [2]. As decision velocity becomes a board-level mandate, AI-enabled portfolio optimization shifts PPM from retrospective reporting to forward-looking orchestration.
Integration of Agile & DevOps with Strategic Portfolio Planning
Enterprises blend agile sprints with long-horizon business roadmaps, making bidirectional data flows between delivery tools and governance layers indispensable. Modern platforms plug into Jira, Azure DevOps, and Microsoft Planner to fuse backlog status with financial and capacity views. Unified telemetry cuts manual reconciliation by 50% and elevates visibility for C-suite stakeholders, ensuring iterative releases stay tethered to enterprise value streams.
Demand for Real-Time Project Financial Governance Amid Cost Inflation
Cost volatility requires continuous budget validation rather than quarter-close snapshots. Advanced PPM suites ingest live price feeds, model currency swings, and recalibrate contingencies, enabling proactive mitigation of material spikes. Automated variance alerts and multi-currency ledgers uphold fiscal discipline across global portfolios, supporting CFO mandates for leaner capital allocation.
Restraints Impact Analysis of Project Portfolio Management Market*
| Restraint | (~) % Impact on CAGR Forecast | Geographic Relevance | Impact Timeline |
|---|---|---|---|
| Shadow-IT and data-sovereignty risks in multi-cloud PPM roll-outs | -2.10% | Europe, APAC, regulated industries globally | Short to medium term (1–3 yrs) |
| Long pay-back periods in the SME segment | -1.70% | Global; strongest impact in emerging markets | Medium term (2–4 yrs) |
| Vendor-lock-in concerns with single-stack ecosystems | -1.50% | Global | Medium term (2–4 yrs) |
| Skills shortage in value-realisation offices (VROs) | -1.20% | North America, Europe, Asia-Pacific | Medium term (2–4 yrs) |
| Source: Mordor Intelligence | |||
Shadow-IT & Data-Sovereignty Risks in Multi-Cloud Roll-outs
As business units spin up cloud services independently, duplicate PPM instances fragment data and complicate governance. Misconfigured permissions enlarge cyber-attack surfaces, while regional privacy statutes limit cross-border data flows. Enterprises must institute strict provisioning policies and invest in unified identity management before reaping the full benefits of federated architectures.
Long Pay-Back Periods in SME Segment
PPM license fees of USD 60-100 per user monthly and implementation costs reaching USD 100,000 stretch SME cash flows. With smaller project volumes, breakeven often arrives after 18-36 months. Vendors that unbundle advanced modules, offer tiered pricing, and embed guided onboarding lower the adoption hurdle yet still face buyer hesitation when near-term ROI is unclear.
*Our forecasts treat driver/restraint impacts as directional, not additive. The impact forecasts reflect baseline growth, mix effects, and variable interactions.
Project Portfolio Management Market Segment Analysis
By Deployment Type:
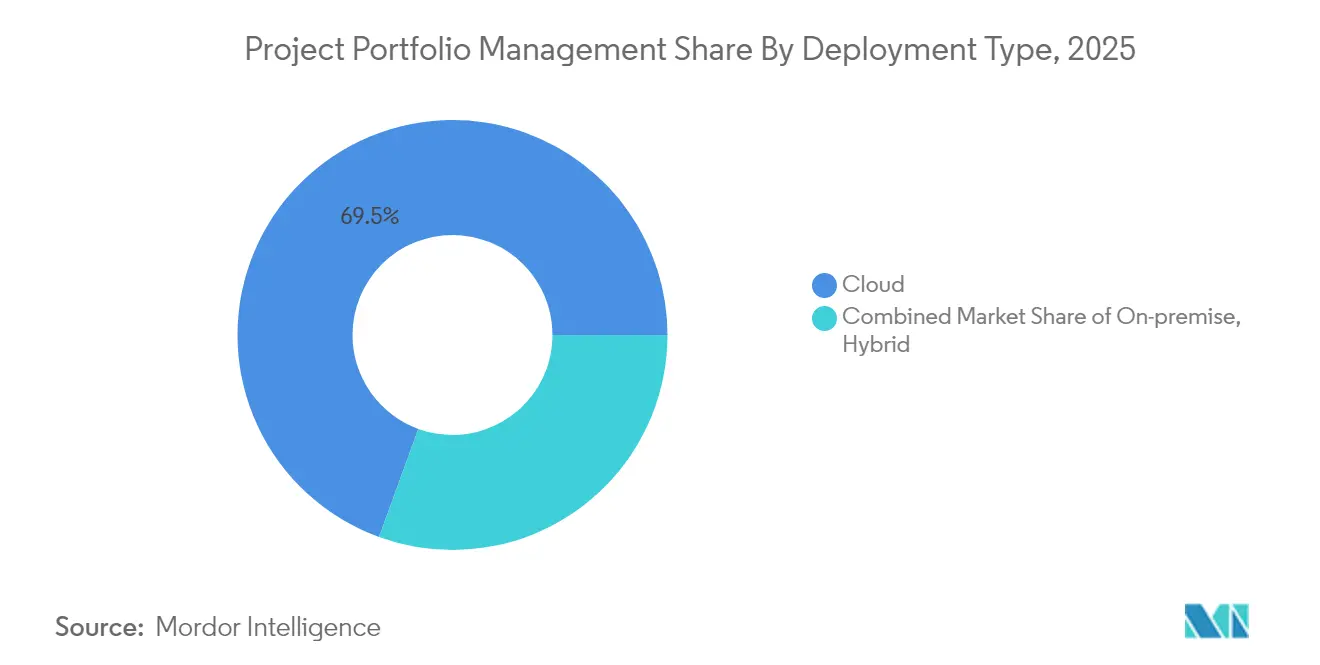
Cloud Dominance AcceleratesCloud deployments accounted for 69.45% of 2025 revenue, generating the largest slice of the project portfolio management market size and expanding at a 16.85% CAGR. Enterprises favor web-based access, elastic capacity, and automatic upgrades that eliminate lengthy patch cycles. Hybrid models serve organizations needing on-premise data segregation while tapping cloud elasticity for collaboration. As multi-tenant architectures mature, total cost of ownership declines, fueling further migration from legacy instances. Continuous security updates from hyperscale providers mitigate vulnerability exposure, a persuasive argument for boards seeking stronger cyber postures amid rising breach costs.
On-premise installations retain footholds in defense, government, and heavily regulated finance where data residency or air-gapped environments trump modernization speed. Even here, containerization allows selective workloads to move outward over time, signaling that pure on-premise footprints will contract. By 2031, analysts expect cloud to underpin the majority of strategic program governance, positioning SaaS vendors as natural consolidators of adjacent analytics and automation tools.

By Component:
Solutions Lead, Services AccelerateSolutions contributed 68.40% of 2025 spending, underscoring buyer preference for integrated suites that bundle scheduling, resource, and financial controls into a single workspace. These platforms reduce swivel-chair inefficiencies and standardize reporting semantics across business units. As AI modules embed deeper into core code, solutions revenue will remain the anchor of the project portfolio management market.
Services, however, are the growth catalyst at a 11.74% CAGR as enterprises seek advisory support for process redesign, system integration, and change management. Advanced implementations now involve mapping value streams, configuring predictive algorithms, and aligning dashboards with ESG frameworks—tasks that demand specialized consultants. Managed-service agreements extend vendor influence post-go-live, yielding recurring revenue while ensuring the client extracts full transformational value.
By Organization Size:
Large Enterprises Dominate, SMEs Show PromiseLarge enterprises drove 60.30% of 2025 outlays and continue to rely on PPM to coordinate hundreds of concurrent initiatives, optimize scarce expert skills, and meet stringent audit requirements. Their global footprints amplify the need for unified governance to support acquisitions, product launches, and regulatory filings across jurisdictions. The project portfolio management market size for large enterprises is forecast to keep pace with GDP expansion, but growth will plateau as penetration nears saturation.
SMEs deliver the highest incremental CAGR at 12.60% as subscription pricing, low-code configurations, and templated best practices democratize sophisticated oversight. Nonetheless, long pay-back periods and limited change-management capacity remain barriers. Vendors courting this cohort emphasize quick-start accelerators, freemium trials, and embedded learning paths to compress time-to-value and justify the investment calculus.
By Application:
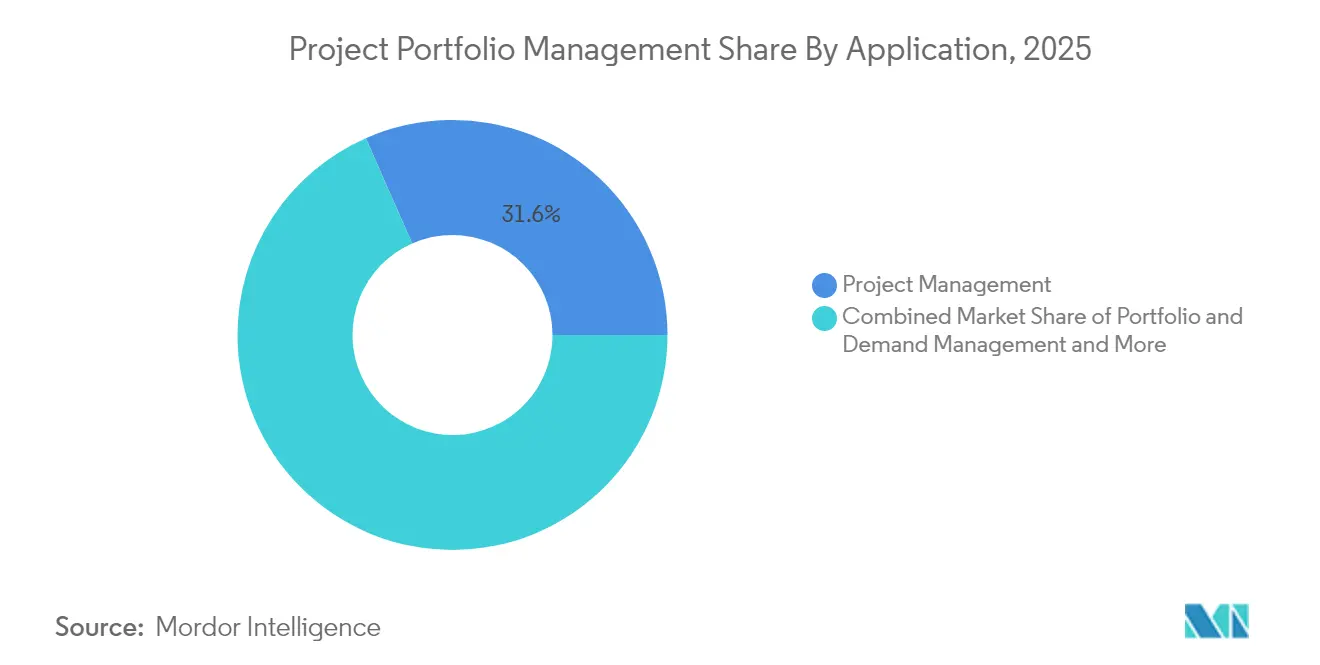
Project Management Leads, Resource Management SurgesProject management modules held 31.60% of 2025 revenue, reflecting their role as the entry point for buyers. They standardize task sequencing, milestone tracking, and status visibility—capabilities no portfolio initiative can forgo. Yet resource & capacity management is the star performer with a 14.78% CAGR, propelled by chronic skill shortages and the shift to outcome-based planning. This segment alone will add a significant portion to the project portfolio management market size by 2031 as organizations pivot from static headcount plans to dynamic, skill-centric deployment.
Demand and portfolio management extensions mature adoption paths by introducing scenario modeling and investment scoring. Financial and risk management add defensibility in inflationary climates, where every capital request competes for scarce budget. Together, these applications transform PPM from a scheduling dashboard into a corporate capital allocator.
By End-User Vertical:
IT & Telecom Leads, Healthcare AcceleratesIT & telecom captured 35.60% of 2025 revenue and uses PPM to synchronize digital transformation waves, infrastructure upgrades, and DevOps pipelines that span hybrid-cloud estates. Continuous delivery cadences make real-time governance indispensable, driving deeper integrations with code repositories and monitoring stacks.
Healthcare & life sciences posts the fastest 13.58% CAGR, fueled by clinical-trial digitization, FDA 21 CFR Part 11 validation, and telehealth infrastructure rollouts. Compliance mandates dovetail with patient-safety imperatives, making audit-ready documentation and risk logs central to funding decisions. Manufacturing, BFSI, construction, and public sector each contribute diversified use cases ranging from predictive maintenance scheduling to budget oversight of infrastructure megaprojects—underscoring the broadening relevance of the project portfolio management market.
Geography Analysis
North America Project Portfolio Management Market
North America generated 39.40% of 2025 revenue, underpinned by mature cloud ecosystems, robust capital budgets, and a concentration of leading vendors. Board mandates for AI-driven insight and ESG reporting fuel steady license renewals and module add-ons. Government incentives for digital resilience further support adoption across critical infrastructure, healthcare, and defense.
Europe Project Portfolio Management Market
Europe shows healthy expansion as manufacturers and utilities modernize operations to meet Green Deal objectives and granular data-sovereignty statutes. Cloud adoption proceeds under strict privacy frameworks, prompting demand for platforms offering regional hosting options and in-product compliance accelerators. Health-system investments in e-hospital frameworks and cross-border research consortia sustain momentum.
APAC Project Portfolio Management Market
APAC is the fastest-growing region at an 10.95% CAGR, reflecting massive infrastructure spending, mobile-first work cultures, and intensifying competition for digital talent. Chinese and Indian enterprises scale PPM suites to orchestrate multiregional programs and mitigate supply-chain volatility. SME digitalization incentives in Southeast Asia also unlock green-field opportunities, making the region pivotal to global expansion strategies.
Regulatory Landscape
Project portfolio management deployments are increasingly shaped by public-sector governance and cybersecurity requirements that call for auditable, repeatable controls over program execution and investment decisions. In the United States, OMB Memorandum M-26-10 (March 2026) reinforced CIO accountability for federal technology oversight by requiring monthly reporting (starting May 2026) on IT program performance and decisions to continue, modify, or terminate projects, complementing existing FITARA and FISMA expectations for centralized investment oversight.
Security and privacy requirements for systems that manage portfolio data and integrate across ERP, EAM, and delivery toolchains are also tightening. NIST released SP 800-18r2 (June 2026), updating guidance so that security, privacy, and cybersecurity supply chain risk management (C-SCRM) planning is integrated into the system life cycle, which in turn supports procurement and implementation patterns that favor policy-driven access control, continuous monitoring, and standardized risk documentation within PPM platforms.
Value Chain Analysis
The PPM value chain starts with platform development, covering core portfolio, resource, financial, and workflow capabilities, and extends through cloud hosting, integration, and implementation services that connect PPM to ERP, EAM, and delivery ecosystems (including Agile and DevOps toolchains). Vendors and cloud marketplaces support subscription distribution, while systems integrators and specialist consultancies handle configuration, data migration, governance model design, and change management. This is particularly relevant for large-enterprise rollouts where financial controls and audit trails are embedded into portfolio processes.
Downstream value realization concentrates in vertical operating models that run complex, cross-functional programs at scale, including IT and telecom, where PPM helps coordinate digital transformation and infrastructure initiatives alongside operational tooling. Partnerships and ecosystem connectors act as key value-chain enablers, for example Planisware partnering with ClearPlan Consulting (April 2025) to expand support for PPM requirements in IT and telecom. Adjacent operational platforms in TMT, such as TMT Insights Polaris and the Focus platform launched (September 2025), also reflect a broader software-defined shift that links planning, execution telemetry, and financial governance through integrations rather than stand-alone tools.
Competitive Landscape
The market remains moderately consolidated, with technology majors leveraging integrated stacks while specialty vendors deepen vertical functionality. Microsoft and Oracle cross-sell PPM into ERP and collaboration clouds, creating switching-cost moats. SAP embeds portfolio governance inside S/4HANA workflows, knitting together financial and operational data streams.
Planview’s February 2025 acquisition of Sciforma broadens enterprise reach and enriches agile and strategic planning modules, illustrating a platform roll-up strategy aimed at midmarket expansion [3]. Smartsheet’s USD 8.4 billion privatization by Vista Equity Partners and Blackstone in September 2024 supplies capital for R&D acceleration and underscores private-equity conviction in double-digit growth.
Competitive advantage increasingly hinges on AI depth, ecosystem extensibility, and compliance toolkits. Vendors invest in natural-language risk queries, resource heat-maps, and ESG scorecards to secure renewals and expand average contract value. Partnerships with systems integrators and hyperscalers accelerate global roll-outs, especially in highly regulated or multilingual environments.
Project Portfolio Management Industry Leaders
-
Oracle Corporation
-
Microsoft Corporation
-
SAP SE
-
ServiceNow Inc.
-
Broadcom (CA PPM/Clarity)
- *Disclaimer: Major Players sorted in no particular order
Project Portfolio Management Market Companies Covered in this Report
- Oracle Corporation
- Microsoft Corporation
- SAP SE
- ServiceNow Inc.
- Broadcom (CA PPM)
- Atlassian Corporation plc
- Planview Inc.
- Workday Inc.
- Monday.com Ltd.
- Smartsheet Inc.
- Wrike (Citrix)
- Asana Inc.
- Upland Software Inc.
- Adobe (Workfront)
- Clarizen
- Celoxis Technologies
- KeyedIn Solutions
- Sciforma
- Micro Focus (OpenText)
- Hexagon AB (EcoSys)
- Procore Technologies
Market Opportunities and Future Outlook
A key whitespace remains ROI and governance visibility for AI and hybrid-cloud investment portfolios. Many organizations run many concurrent initiatives, but still struggle to connect costs, risk controls, and outcomes across multiple cloud environments and third-party AI services. This gap supports demand for PPM capabilities that unify scenario modeling, capacity planning, and financial governance, alongside integrations to ERP and execution systems, aligning with buyer priorities for deeper ERP and finance integration and more advanced portfolio analytics.
Telecommunications and IT programs also create opportunity for PPM providers that package best-practice templates and connectors for DevOps-driven delivery and complex infrastructure rollouts, reflecting a broader shift toward tech-led operating models. Regulated environments continue to favor PPM platforms that can support audit-ready documentation and validated workflows, such as healthcare and life sciences use cases tied to FDA 21 CFR Part 11 validation, which increases the value of embedded controls, traceability, and standardized reporting across portfolio governance.
Recent Industry Developments in Project Portfolio Management Market
- April 2026: Oracle announced AI-enabled capabilities in Oracle Primavera Unifier, adding AI-driven workflows, business process summarization, and wizard-driven adapters for secure integrations with ERP and EAM systems. The update targets capital program governance where auditability and cross-system data integrity are central, strengthening Primavera Unifier positioning in compliance-heavy project environments.
- March 2026: SAP delivered SAP S/4HANA 2025 enhancements for Enterprise Portfolio and Project Management (EPPM), including improved OData APIs and tighter planning data transfer between SAP Analytics Cloud and Portfolio Management. The release improves end-to-end integration between portfolio decisions and financial and capacity planning, reinforcing SAP's single-suite advantage for customers standardizing on S/4HANA.
- September 2024: Smartsheet entered a USD 8.4 billion take-private agreement with Vista Equity Partners and Blackstone. The transaction supplied additional capital and strategic latitude for product investment and go-to-market changes, intensifying competitive pressure on midmarket and enterprise work management and PPM platforms.
Project Portfolio Management Market Report Scope and Research Methodology
Market Definition and Coverage
This market covers software and related services used to plan, prioritize, fund, and govern multiple projects under a single portfolio view. It includes tools that track demand, capacity, schedules, and benefits across departments and delivery teams.
Scope exclusions: Stand-alone task boards, general collaboration tools, and unrelated one-time advisory work that is not tied to a PPM platform are excluded.
Segments Covered in This Report
- By Deployment Type
- Cloud
- On-premise
- Hybrid
- By Component
- Solutions
- Services
- By Organization Size
- Large Enterprises
- Small and Mid-sized Enterprises (SMEs)
- By Application
- Project Management
- Portfolio and Demand Management
- Resource and Capacity Management
- Financial and Risk Management
- Others (Collaboration, Reporting)
- By End-user Vertical
- IT and Telecom
- Healthcare and Life Sciences
- Manufacturing
- Construction and Engineering
- Retail and Consumer Goods
- BFSI
- Government and Public Sector
- Others
- By Geography
- North America
- United States
- Canada
- Mexico
- South America
- Brazil
- Argentina
- Rest of South America
- Europe
- Germany
- United Kingdom
- France
- Italy
- Spain
- Netherlands
- Rest of Europe
- Asia
- China
- Japan
- India
- South Korea
- Australia and New Zealand
- Southeast Asia
- Rest of APAC
- Middle East and Africa
- Middle East
- GCC
- Turkey
- Israel
- Rest of Middle East
- Africa
- South Africa
- Nigeria
- Rest of Africa
- Middle East
- North America
Data Sources, Market Sizing, and Validation
Desk Research
We start by mapping what typical project portfolio management spending looks like inside enterprise software budgets, then we test how that spend shifts with cloud adoption, PMO maturity, and program governance needs. Public sources help anchor the inputs, including macro and digital adoption indicators from the World Bank, economy and industry output data from the US Bureau of Economic Analysis, labor and productivity context from the US Bureau of Labor Statistics, and policy and ICT indicators from the OECD.
We also review non-paywalled material such as annual reports, SEC-style filings where available, earnings call transcripts, and investor presentations to understand subscription pricing patterns, services attach rates, and renewal behavior. For cross-checks, we use a limited set of paid database subscriptions for company financial intelligence, news and financials tracking, and patent databases to confirm product direction and adoption themes. These are illustrative examples, and other public and paid sources were also used for data collection, validation, and clarification during the work.
Primary Interviews and Surveys
Our analysts validated demand signals and pricing assumptions through expert interviews and surveys with software providers, implementation partners, and enterprise users involved in portfolio governance and delivery. Since this is a global market, we ensured the feedback reflected buying behavior across APAC, EMEA, and the Americas, and then used the learnings to close gaps from desk research and reconcile differences by deployment approach and use case.
Distribution of primary research fieldwork respondents
| Company type | Respondent position | Region |
|---|---|---|
| Top tier: 35% | CXOs: 16% | APAC: 44% |
| Mid tier: 49% | Functional/Unit leaders: 24% | EMEA: 34% |
| Smaller Players: 16% | Managers: 60% | Americas: 22% |
Market-Sizing & Forecasting
Sizing begins with a top-down build where enterprise software and IT spend signals are reconstructed into an addressable pool for portfolio-level governance tools. That pool is then filtered by adoption and deployment mix across regions. To keep the output realistic, we corroborate it with selective bottom-up approximations, such as sampled subscription price points multiplied by active user ranges, followed by channel checks on typical implementation effort for rollouts.
A few practical inputs guide the model: cloud share progression (cloud held 69.45% of 2025 revenue), solution versus services mix (solutions accounted for 68.40% of 2025 revenue), large enterprise versus SME purchasing weight (large enterprises represented 60.30% of 2025 spending), and application mix (project management captured 31.60% of 2025 revenue). Regional weighting is adjusted using observed momentum, with North America representing about 39.40% of 2025 revenue and APAC expected to grow faster. For forecasting, scenario analysis is used because pricing, cloud migration pace, and implementation cycles can shift the near-term slope, and the scenarios are aligned to what primary respondents see for budgets, rollout timelines, and renewal behavior. Where a direct rollup is incomplete, gaps are handled using conservative adoption ranges by organization size and industry, then re-checked against typical contract values and deployment patterns.
Data Validation & Update Cycle
We run several checks before finalizing the numbers, including cross-verifying totals against independent signals such as enterprise software spending direction, cloud migration indicators, and the observed split between subscriptions and services. When an outlier appears, we review the drivers, then revisit assumptions if the variance cannot be explained by scope, timing, or regional mix.
A multi-step internal review is completed, including a separate analyst pass focused on unit consistency, regional weighting, and growth-rate realism. Reports are refreshed annually, with interim updates made if a material event changes pricing, deployment preferences, or demand patterns. Before delivery, we perform a fresh review of recent public disclosures and news so clients receive an updated view aligned to current market conditions.
Mordor Intelligence's Project Portfolio Management Market Size Compared Against Other Published Estimates
Published market values for project portfolio management often differ because researchers count different items and time periods, and they do not always align on what qualifies as a PPM platform versus adjacent tools. Differences also come from whether services are counted as part of the market, how cloud subscriptions are annualized, and how quickly older on-prem installations are assumed to transition.
Key gap drivers are usually scope and conversion logic. Some estimates fold general work management and collaboration products into PPM, while others keep resource and capacity management in a separate bucket, which can change the total quickly. Another common cause is how pricing is handled, where list prices or aggressive expansion assumptions are applied without being checked against typical contract ranges and renewal realities.
Benchmark comparison
| Source | Market Size | Gaps in Research Methodology |
|---|---|---|
| Mordor Intelligence | USD 7.69 B (2026) | |
| Global Consultancy A | USD 6.90 B (2026) | Uses a narrower definition centered on core project management modules and excludes implementation and managed services tied to PPM deployments, which lowers the value. |
| Industry Association B | USD 8.60 B (2026) | Includes adjacent work management and collaboration software spend and applies broader subscription annualization, which brings in budgets not dedicated to portfolio governance. |
The table shows that the spread is mainly explained by what gets counted as PPM, followed by how subscription pricing and services are treated in the dollar build. When adjacent work management spend is kept out and services are included only when they are directly linked to PPM deployments, the resulting total stays traceable to clear inputs. This scope and counting rule is applied by Mordor Intelligence.
Key Questions Answered in the Report
How are SMEs affecting market dynamics?
SMEs grow at a 12.60% CAGR as subscription pricing and low-code platforms lower barriers, though long pay-back periods remain a restraint.
What is the projected value of the project portfolio management market by 2031?
It is expected to reach USD 13.21 billion, growing at an 11.43% CAGR.
Which deployment model is gaining the most traction?
Cloud solutions dominate with 69.45% of 2025 revenue and are expanding at a 16.85% CAGR.
Why are AI-enabled features critical for PPM adoption?
AI improves schedule accuracy, predicts risks, and boosts ROI; 93% of project managers report positive returns from AI tools.
Which vertical shows the fastest growth?
Healthcare and life sciences leads with a 13.58% CAGR due to stringent compliance and digitization of clinical processes.