
Progressing Cavity Pump Market Size and Share
Market Overview
| Study Period | 2020 - 2031 |
|---|---|
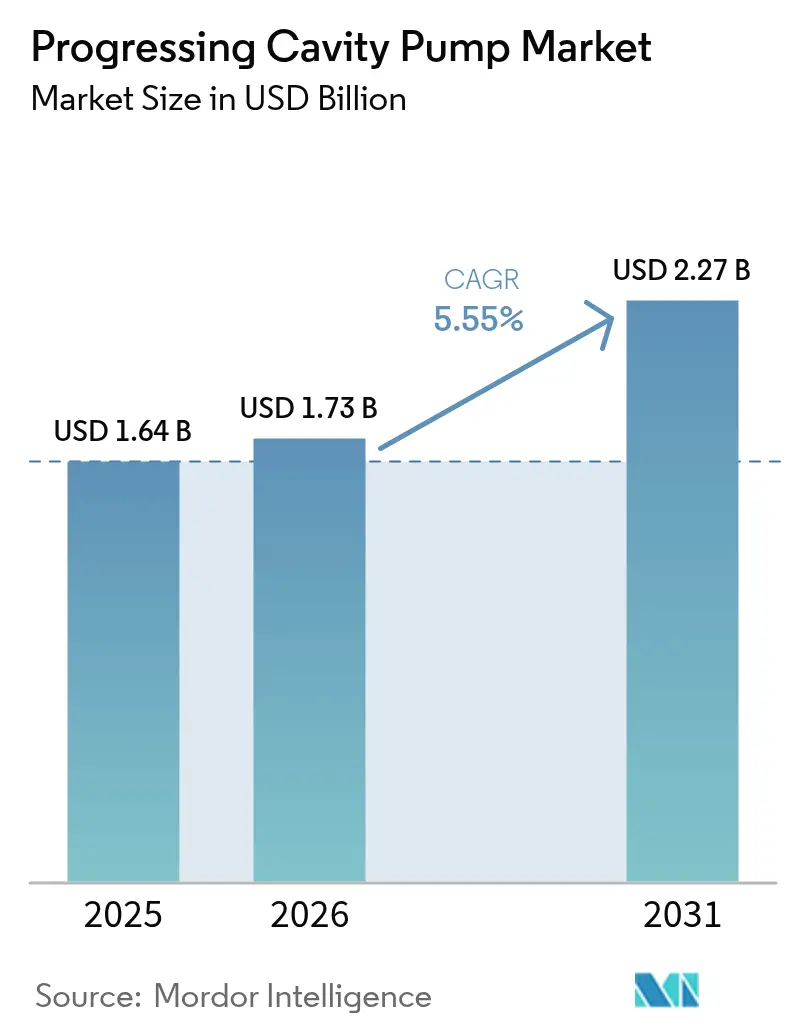
| Market Size (2026) | USD 1.73 Billion |
| Market Size (2031) | USD 2.27 Billion |
| Growth Rate (2026 - 2031) | 5.55 % |
| Fastest Growing Market | Asia-Pacific |
| Largest Market | Asia-Pacific |
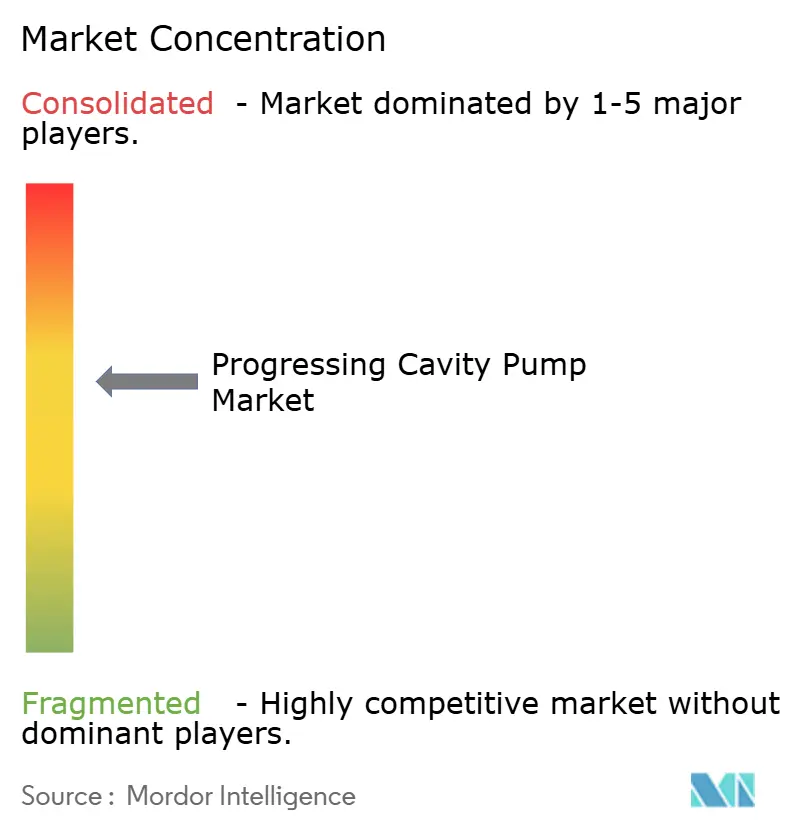
| Market Concentration | Medium |
Major Players *Disclaimer: Major Players sorted in no particular order Image © Mordor Intelligence. Reuse requires attribution under CC BY 4.0. | |
Progressing Cavity Pump Market Analysis by Mordor Intelligence
The progressing cavity pump market size is expected to grow from USD 1.64 billion in 2025 to USD 1.73 billion in 2026 and is forecast to reach USD 2.27 billion by 2031 at 5.55% CAGR over 2026-2031. This growth reflects the technology’s expanding use in sludge handling, thermal enhanced oil recovery, and process industries where conventional pumps fail. Rising demand for energy-efficient equipment, stricter wastewater directives, and expanding heavy-oil production underpin the accelerating adoption of progressing cavity pumps. Multistage designs, electric-submersible variants, and IoT-enabled monitoring extend pump operating envelopes, allowing operators to raise pressures while cutting energy use. Asia-Pacific keeps its lead thanks to large-scale water programs and industrial expansion, while North America’s SAGD projects and Europe’s energy-neutral treatment targets reinforce demand. Digital controls and advanced elastomer formulations help suppliers contain life-cycle costs, supporting market resilience despite high initial prices.
Key Report Takeaways
- By pumping capacity, the up to 500 GPM segment held 46.78% of the progressing cavity pump market size in 2025, while the 501–1000 GPM is forecast to expand at an 8.52% CAGR through 2031.
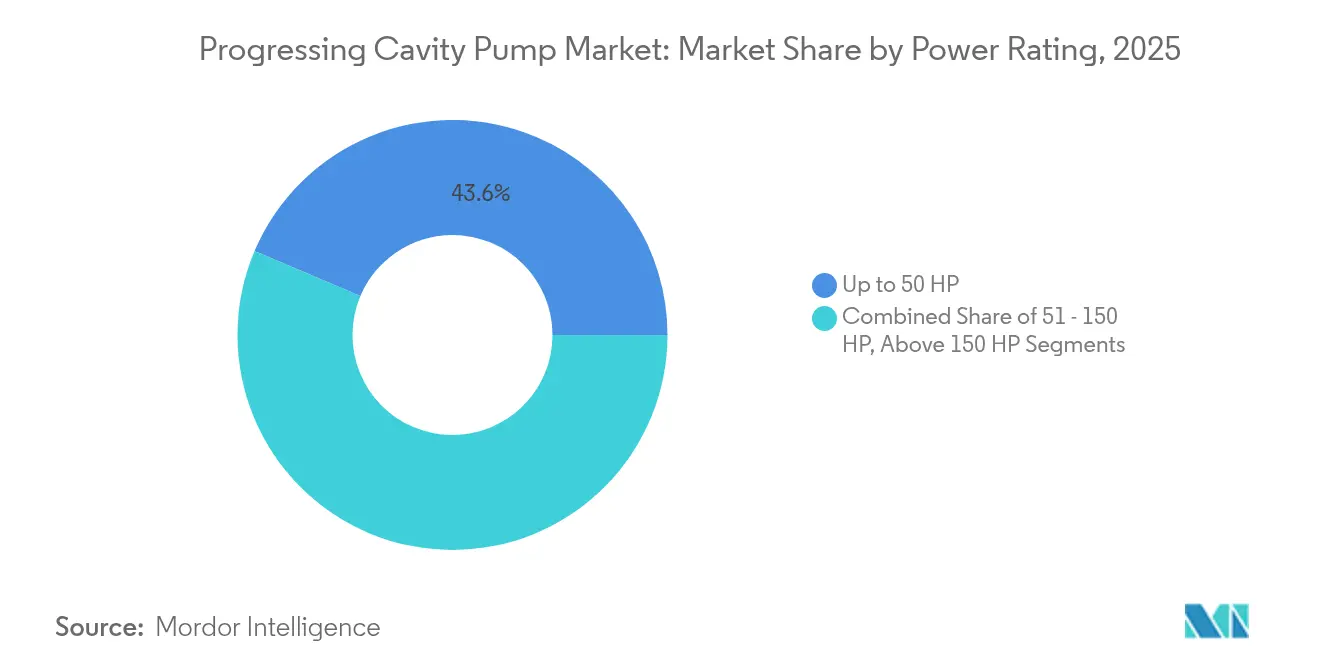
- By power rating, the up to 50 HP segment held 43.62% of the progressing cavity pump market size in 2025, while the 51–150 HP class is forecast to expand at an 8.05% CAGR through 2031.
- By stage type, single-stage units accounted for 53.85% revenue share in 2025; multistage configurations are advancing at a 9.03% CAGR to 2031.
- By end-user industry, water and wastewater operations represented 38.92% of the progressing cavity pump market size in 2025, whereas oil and gas applications lead growth at a 7.45% CAGR.
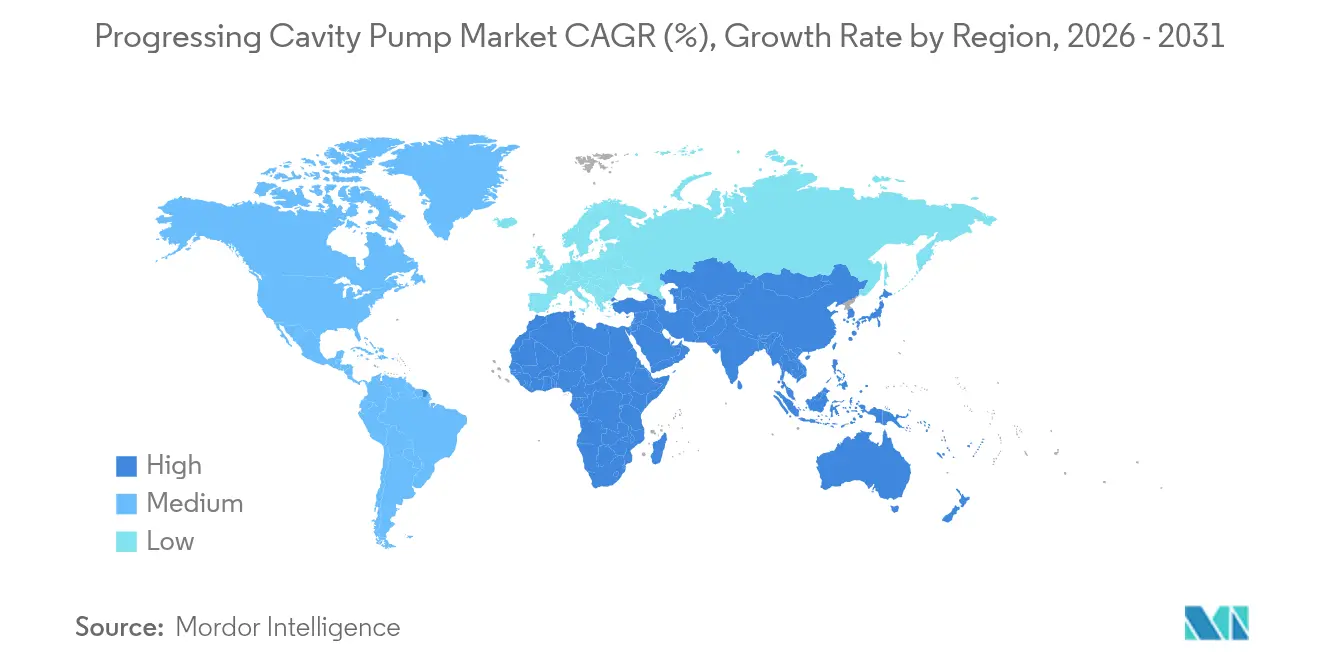
- By geography, Asia-Pacific captured 34.21% of the progressing cavity pump market share in 2025 and is projected to post the fastest 8.72% CAGR to 2031.
Note: Market size and forecast figures in this report are generated using Mordor Intelligence’s proprietary estimation framework, updated with the latest available data and insights as of 2026.
Market Trends and Insights
Drivers Impact Analysis of Progressing Cavity Pump Market*
| Driver | (~) % Impact on CAGR Forecast | Geographic Relevance | Impact Timeline |
|---|---|---|---|
| Rising demand from water and wastewater infrastructure | +1.8% | Global, with concentration in Asia-Pacific and Europe | Long term (≥ 4 years) |
| Suitability for high-viscosity and multiphase fluids | +1.2% | Global, particularly North America and Middle East | Medium term (2-4 years) |
| Investments in heavy-oil artificial-lift (PCP) projects | +1.0% | North America (Canada), South America (Venezuela, Brazil) | Medium term (2-4 years) |
| Electric-submersible PCPs lowering power use | +0.8% | Global, early adoption in North America and Europe | Long term (≥ 4 years) |
| IoT-enabled predictive maintenance for stator-rotor wear | +0.6% | North America, Europe, Asia-Pacific core markets | Medium term (2-4 years) |
| Sludge-dewatering regulations spurring hopper-type PCP retrofits | +0.4% | Europe, North America, expanding to Asia-Pacific | Short term (≤ 2 years) |
| Source: Mordor Intelligence | |||
Rising demand from water and wastewater infrastructure
Major municipal programs have been driving steady orders for progressing cavity pumps used in sludge transfer, thickening, and chemical dosing. Manila Water commissioned a USD 435.73 million pumping station that delivers 50 million liters per day to Binangonan households. [1] Japan’s USD 10 billion Water 2040 Fund channels capital into decentralized recycling systems that rely on high-precision PCPs for nutrient recovery. The European Union’s revised Urban Wastewater Treatment Directive mandates energy-neutral plants by 2045, turning efficient PCPs into compliance tools. Indonesia’s new capital project reinforces regional demand by requiring advanced sludge technology for 2 million future residents. These programs collectively lengthen replacement cycles and open retrofit opportunities for hopper-type PCPs that handle dewatered cakes with minimal footprint.
Suitability for high-viscosity and multiphase fluids
Progressing cavity pumps transfer shear-sensitive, sand-laden, or gas-cut fluids at near-constant flow, a performance unmatched by centrifugal or gear pumps. NETZSCH’s new conical rotor design reached 75–90% volumetric efficiency even under high sand and gas content. Canadian SAGD producers raised recovery rates above 80%, which in turn lifted PCP run hours per well as operators lifted heavy emulsions to surface. Emerging solvent-SAGD schemes using butane-propane blends heighten viscosity challenges that favor PCP adoption. Food processors also deploy PCPs to protect texture in viscous sauces, while chemical firms value the elastomer stator’s corrosion resistance over metal alternatives.
Investments in heavy-oil artificial-lift projects
Thermal-recovery projects in Canada, Venezuela, and Brazil are expanding well counts, each relying on progressing cavity pumps for artificial lift. Canadian in-situ output averaged 1.65 million barrels per day in 2025, up 4% year on year, with incremental wells at Cenovus, MEG Energy, and Imperial driving pump demand. New projects such as Blackrod Phase 1 target 30,000 barrels per day by 2028, sustaining orders for abrasion-tolerant PCP strings. Operators favor PCPs over rod-pump or ESP systems in sand-prone wells because stator-rotor contact maintains lift even as gas slugging increases.
Electric-submersible PCPs lowering power use
Electric-submersible progressing cavity pumps combine the volumetric stability of PCPs with a slim downhole profile, cutting energy and surface footprint. SLB’s Reda PowerEdge system demonstrated up to 55% reduction in power draw and carbon emissions versus conventional top-drive PCPs. BCPGroup’s MAGNETA controller achieved 20–30% energy savings per well by using AI to adjust motor speed in real time. Machine-learning sizing models now forecast optimal motor-pump combinations with the model's predictions being off by 0.3 units from the actual values, giving engineers confidence to down-spec power without risking shutdowns. These advances unlock marginal fields where power costs once exceeded economic thresholds.
Restraints Impact Analysis of Progressing Cavity Pump Market*
| Restraint | (~) % Impact on CAGR Forecast | Geographic Relevance | Impact Timeline |
|---|---|---|---|
| High deployment and maintenance cost | -1.4% | Global, particularly impacting emerging markets | Medium term (2-4 years) |
| Abrasive wear in sand-laden produced fluids | -0.8% | North America, Middle East oil and gas regions | Short term (≤ 2 years) |
| Elastomer supply-chain volatility | -0.6% | Global, concentrated impact in Asia-Pacific manufacturing | Short term (≤ 2 years) |
| Peristaltic-hose pump substitution in low-flow dosing | -0.4% | Europe, North America industrial applications | Medium term (2-4 years) |
| Source: Mordor Intelligence | |||
High deployment and maintenance cost
Life-cycle economics remain a hurdle for widespread adoption, especially in price-sensitive plants. Stator replacement intervals ranged from 6 months to 3 years depending on solids load, making elastomer cost a major budget item. Mechanical seals, large skid bases, and sensor packages push installed costs beyond low-shear alternatives. Comparative studies by Graco noted higher maintenance hours for PCPs versus peristaltic pumps in similar dosing duties. Small utilities in developing regions delay upgrades because specialized technicians and spares are scarce, extending payback periods.
Abrasive wear in sand-laden produced fluids
Oil wells that flow more than 1,000 ppm solids accelerate elastomer fatigue, shortening run life and increasing pulling costs. Research in Frontiers in Energy Research confirmed that abrasive wear scales quadratically with particle velocity, directly impacting rotor-stator interfaces. Field trials show that even advanced chrome coatings degrade in months under severe conditions, forcing operators to balance choke settings against pump longevity. While carbon-nanotube elastomer blends promise stronger tensile properties, commercial use remains limited by raw material price volatility.
*Our forecasts treat driver/restraint impacts as directional, not additive. The impact forecasts reflect baseline growth, mix effects, and variable interactions.
Progressing Cavity Pump Market Segment Analysis
By Power Rating:
Mid-Range Drives Efficiency PushThe up to 50 HP class retained 43.62% of the progressing cavity pump market share in 2025 because small water plants and light industry favor modest power draws. The 51–150 HP bracket, however, is expanding at an 8.05% CAGR and is set to close the gap as digital controllers raise efficiency and cut downtime. Variable-frequency drives paired with mid-range motors achieve 20–30% energy savings, a benefit that appeals to municipal operators with tiered electricity tariffs.
Electric-submersible formats thrive in the same power window, opening new upstream uses where rod strings were space-constrained. Machine-learning sizing tools that predict optimal horsepower now deliver higher accuracy, with chances of error being as low as 0.1%, thus helping engineers use the right-size equipment and prevent overspend. As these analytics mature, the progressing cavity pump market is expected to allocate a greater share of new orders to the 51-150 HP category while low-horsepower units remain dominant in legacy facilities.

By Pumping Capacity:
High-Flow Applications AccelerateHigh-capacity systems ranging from 501–1,000 GPM posted the fastest 8.52% CAGR as municipalities replaced aging equipment with larger units to keep pace with population growth. Manila Water’s East Bay facility installed multiple large-bore PCPs to move 50 million L/day, illustrating the scale of new projects. The ≤500 GPM segment still controlled 46.78% of revenue in 2025 because thousands of food, chemical, and small treatment plants operate within that flow envelope.
Advanced CFD modeling lets manufacturers optimize rotor geometry for each flow band, raising volumetric efficiency to 75–90% across capacities. Digital twins add predictive insights that alert operators to deviations before cavitation sets in. Together, these advances keep life-cycle costs in check and sustain the progressing cavity pump market’s penetration into high-flow duties once reserved for centrifugal machines.
By Stage Type:
Multistage Systems Gain MomentumSingle-stage designs held 53.85% of 2025 revenue because many sludge and dosing duties require moderate pressure only. Multistage configurations, however, are climbing at a 9.03% CAGR as enhanced-oil-recovery projects and high-head industrial lines demand greater discharge pressures. SLB’s Reda Agile compact system widened the operating window of multistage PCPs while trimming footprint.
VDMA reported that conical rotor-stator profiles now deliver longer life under high differential pressures, lowering the cost barrier that once limited multilobe adoption. Predictive maintenance analytics further protect operators from cascading failures across stages. These technical gains should help multistage units capture a larger slice of the progressing cavity pump market by 2030.

By End-User Industry:
Oil and Gas Accelerates Despite Smaller BaseWater and wastewater facilities commanded 38.92% of the progressing cavity pump market size in 2025, benefiting from stringent treatment directives and infrastructure funds. The oil and gas sector, though smaller in absolute revenue, is growing at 7.45% CAGR on the back of SAGD well expansions that require abrasion-tolerant artificial-lift systems.
Chemical and petrochemical plants specify PCPs for corrosive and viscous streams, while food manufacturers rely on gentle pulsation-free transfer to protect product integrity. Mining, pulp, and pharmaceutical industries add steady demand as processes become more water-intensive and regulated. Cross-industry adoption of predictive analytics is creating a common platform approach, enabling vendors to bundle service contracts across disparate verticals within the progressing cavity pump industry.
Geography Analysis
APAC Progressing Cavity Pump Market
Asia-Pacific held 34.21% of the progressing cavity pump market in 2025 and is projected to expand at a 8.72% CAGR to 2031. China’s USD 10 billion Water 2040 Fund and Japan’s near-closed-loop recycling systems underpin sustained municipal spending. Indonesia’s new capital Nusantara opens a multiyear tender pipeline for sludge and dosing equipment. High-growth manufacturing hubs in India and Vietnam add industrial orders that diversify regional revenue.
North America Progressing Cavity Pump Market
North America maintains a strong base through heavy-oil production and water infrastructure refurbishment. Canadian SAGD production averaged 1.65 million bpd in 2025, driving lift system replacements and expansions. The United States faces USD 232 million in annual compliance costs once the EPA’s proposed effluent guidelines take full effect, incentivizing utilities to upgrade to energy-efficient PCPs.
Broader European Markets
Europe’s market revolves around regulatory compliance and efficiency targets. The Urban Wastewater Treatment Directive’s energy-neutral mandate sets a hard deadline that favors low-slip PCPs. Germany and the United Kingdom invest heavily in technology upgrades for chemical dosing and digester feed, while France’s nuclear plants demand robust, leak-free pumps. Eastern Europe and Russia provide incremental revenue through oil production projects despite geopolitical uncertainty.
Regulatory Landscape
Progressing cavity pumps in oil and gas and downstream services commonly align with API STD 676 (4th edition, 2022) for rotary positive displacement pump design, manufacturing, and testing expectations, making it a frequent baseline in procurement specifications where API conformance is required.
In parallel, plant-level environmental compliance requirements are increasingly shaping pump selection and maintenance practices, particularly for fugitive-emissions control in chemical manufacturing. In the United States, the EPA finalized amendments to the Chemical Manufacturing Area Source NESHAP (40 CFR Part 63) on April 1, 2026, tightening LDAR-related requirements that cover equipment such as pumps in light liquid service. Requirements such as periodic instrument monitoring (EPA Method 21) and leak definitions (for example, 10,000 ppmv for certain monitoring provisions) increase the focus on seal integrity, documented inspection programs, and corrective maintenance workflows, influencing demand for lower-leakage configurations and service contracts that support auditable compliance.
Value Chain Analysis
The progressing cavity pump value chain begins with raw materials and components, including alloy steels for rotors, elastomer compounds for stators (for example, hydrogenated nitrile rubber families for demanding duties), and wear-protection inputs such as precision chrome plating and tungsten carbide coatings.
Core manufacturing steps include rotor machining or forming, stator molding and bonding, drive and joint assembly, and factory testing to validate flow and pressure behavior; many established suppliers keep rotor-stator production vertically integrated to control fit, elastomer quality, and performance consistency. Downstream, pumps move through direct OEM sales, EPC and packaged-skid integrators, and specialized distributors serving water and wastewater plants, process industries, and artificial-lift operations. Service providers and OEM aftermarket teams play a central role due to stator wear and joint maintenance, with digital monitoring increasingly embedded as part of lifecycle offerings. Product and supply chain practices show a tilt toward modularity and localization: Roto Pumps introduced its P-Range progressive cavity pumps in April 2025 with modular design elements supporting configuration conversion, while SEEPEX (within the Ingersoll Rand portfolio) has emphasized expanded manufacturing and cloud-based monitoring capabilities to reduce lead times and support predictive maintenance deployments.
Competitive Landscape
Top Companies in Progressing Cavity Pump Market
The progressing cavity pump market is moderately fragmented, with the top five suppliers accounting for roughly 55% of global revenue. SLB’s acquisition of ChampionX in 2024 created a broad artificial-lift portfolio covering PCPs, ESPs, and digital optimization platforms. NETZSCH, PCM, and Roto Pumps emphasize proprietary elastomer blends and maintenance-in-place designs to protect share.
Technology differentiation now rests on digital capabilities. BCPGroup’s MAGNETA controller shaved 20–30% power use and 40% maintenance costs in pilot wells, a value proposition quickly emulated by rivals. [4] Patent filings focus on conical stators, abrasion-resistant coatings, and self-diagnosing rotors, signaling a shift from raw horsepower battles to life-cycle analytics.
Regional alliances and service networks shape purchasing decisions, particularly in remote oilfields and small municipal plants where uptime is critical. Suppliers with integrated monitoring, quick-ship spares, and on-site technicians secure long-term framework agreements. Mid-tier companies carve niches in specialty elastomers or high-temperature applications, while new entrants pursue software-as-a-service models that decouple monitoring from hardware sales within the progressing cavity pump industry.
Progressing Cavity Pump Industry Leaders
-
Schlumberger Limited.
-
National-Oilwell Varco, Inc.
-
Xylem Inc
-
NETZSCH Holding GmbH & Co. KG
-
PCM S.A.
- *Disclaimer: Major Players sorted in no particular order
Progressing Cavity Pump Market Companies Covered in this Report
- Schlumberger Limited
- National Oilwell Varco, Inc.
- Xylem Inc.
- NETZSCH Holding GmbH & Co. KG
- PCM S.A.
- Weatherford International plc
- Halliburton Company
- Seepex GmbH
- ChampionX Corporation
- Moyno, LLC
- Roto Pumps Limited
- Pumpenfabrik Wangen GmbH
- Leistritz Pumpen GmbH
- Liberty Process Equipment, Inc.
- Verder Liquids BV
- Borets International Limited
- Canadian Advanced ESP Inc.
- John Crane Production Solutions, Inc.
- Baker Hughes Company
- C-Flex Pump Company
- Allweiler GmbH (CIRCOR Intl.)
- Atlas Copco AB (Varisco PCP line)
- Graco Inc.
- NETCO Pumps & Equipment Pty Ltd
- BBP Pumps BV
- Shanley Pump & Equipment, Inc.
Market Opportunities and Future Outlook
Digitalization and integrated monitoring are expanding across process industries and artificial lift, where operators seek pump health data tied directly into PLC and plant control environments. Controllers with Ethernet connectivity and protocol support for integration into industrial automation systems, alongside embedded sensing for stator wear, temperature, and pressure, support preventive interventions that reduce unplanned shutdowns and protect rotor-stator sets. SEEPEX highlighted this direction at IFAT 2026 in Munich through smart pump innovations centered on real-time monitoring and IoT-enabled controls, reinforcing market momentum toward software-enabled PCP packages rather than standalone hardware.
Reliability-led redesign and maintainability upgrades are opening an additional opportunity set in oil and gas, especially for remote well sites where pull frequency and intervention logistics dominate total cost of ownership. NETZSCH announced a new generation of progressing cavity pump technology for oil and gas applications in March 2026, including an insertable maintenance concept and compact drive heads targeted at easier field servicing. Field-scale adoption evidence also supports this opportunity: an SPE report in May 2026 described a 1,000-well implementation of slim-hole PCPs in 3.5-inch tubing that reduced failure rates and delivered USD 16 million in savings, reinforcing the commercial value of slimmer designs, better sizing, and integrated operating controls in high-run-hour lift applications.
Recent Industry Developments in Progressing Cavity Pump Market
- May 2026: SEEPEX presented smart progressive cavity pump innovations at IFAT 2026 in Munich, including sensors for real-time stator wear, temperature, and pressure monitoring along with IoT-enabled pump controls. The launch activity signals faster product-cycle emphasis on embedded diagnostics and automation-ready packages, supporting lifecycle service models that reduce downtime in municipal and industrial duties.
- January 2026: SLB won two five-year contracts from Petroleum Development Oman to supply artificial lift technologies, including progressing cavity pumps, for Block 6 operations. The awards tie PCP supply to long-duration field activity and in-country value requirements, reinforcing the role of local manufacturing and service capacity in winning multi-year lift programs.
- October 2024: BCPGroup reported results for its MAGNETA controller used with progressing cavity pumping, highlighting energy-saving performance in field use. This reinforced controller-led differentiation in artificial lift, where speed control and automation features increasingly influence equipment selection alongside traditional rotor-stator hardware.
Progressing Cavity Pump Market Report Scope and Research Methodology
Market Definition and Coverage
This market covers revenues from progressing cavity pumps sold for transferring and dosing viscous, abrasive, and shear-sensitive fluids across industrial and municipal use cases, with values captured at the manufacturer and channel selling level in current USD.
Scope exclusions: Excludes downstream installation labor, piping and valves, plant engineering services, and aftermarket spares and service contracts that are billed separately from the pump sale.
Segments Covered in This Report
- By Power Rating
- Up to 50 HP
- 51 - 150 HP
- Above 150 HP
- By Pumping Capacity
- Up to 500 GPM
- 501 - 1000 GPM
- Above 1000 GPM
- By Stage Type
- Single-stage (? 12 stages)
- Multistage (> 12 stages)
- By End-User Industry
- Water and Wastewater
- Oil and Gas
- Chemicals and Petrochemicals
- Food and Beverage
- Other End-Users
- By Geography
- North America
- United States
- Canada
- Mexico
- South America
- Brazil
- Argentina
- Rest of South America
- Europe
- Germany
- United Kingdom
- France
- Russia
- Rest of Europe
- Asia-Pacific
- China
- Japan
- South Korea
- India
- Rest of Asia-Pacific
- Middle East and Africa
- Middle East
- Saudi Arabia
- United Arab Emirates
- Turkey
- Rest of Middle East
- Africa
- South Africa
- Nigeria
- Rest of Africa
- Middle East
- North America
Data Sources, Market Sizing, and Validation
Desk Research
Desk work starts with building a clean fact base on where PCP demand comes from and how equipment spending is tracked. We refer to public sources such as US EPA water and wastewater infrastructure publications, USGS water use and mining statistics, EIA oil and gas production series, Eurostat industrial output indicators, and UN Comtrade trade flows for pumps and parts to understand direction and scale.
Alongside these, we review company annual reports, investor presentations, product catalogs, tender portals, and reputable engineering press to map typical duty points and procurement patterns. Where helpful, paid subscriptions for company financials, shipment-level trade visibility, and patent databases are used to fill gaps on supplier exposure and technology change. The desk source list is not exhaustive, and other public and paid references are used during data collection, cross-checking, and clarification.
Primary Interviews and Surveys
Primary inputs are collected through expert interviews and structured surveys with pump manufacturers, distributors, EPC teams, plant maintenance leaders, and end users in sectors like water and wastewater, oil and gas, chemicals, and food processing. These interviews are used to confirm typical pricing bands, replacement cycles, tender win rates, and regional demand differences, and then to test the desk assumptions before the model is finalized.
Distribution of primary research fieldwork respondents
| Company type | Respondent position | Region |
|---|---|---|
| Top tier: 28% | CXOs: 16% | APAC: 50% |
| Mid tier: 56% | Functional/Unit leaders: 39% | EMEA: 32% |
| Smaller Players: 16% | Managers: 45% | Americas: 18% |
Market-Sizing & Forecasting
Sizing is first constructed using a top-down approach where pump demand is rebuilt from end-use spending pools, such as municipal wastewater capex, upstream production activity, and process industry output, which are then translated into PCP-eligible applications. To keep the totals realistic, we corroborate the result with selective bottom-up checks, such as sampled ASP times unit shipments for common power ratings and capacity bands, and channel checks on large project intake.
Key model inputs include wastewater treatment capacity additions and rehab intensity, drilling and production activity indicators in oil and gas, chemical and petrochemical capacity utilization signals, the share of dosing and viscous media duties where PCP is preferred, and observed price movement by power rating and stage type. When data is sparse for smaller countries, we handle gaps through proxy ratios from similar industrial structures, followed by validation through local interviews.
For forecasting, scenario analysis is used so the baseline case can flex with changes in municipal budgets, energy and commodity cycles, and industrial output. Assumptions are tuned using what practitioners expect for replacement timing, material upgrades, and the pace at which multistage and monitoring features are adopted.
Data Validation & Update Cycle
Model outputs are checked against independent signals, including import trends for pump categories, stated order momentum in public filings, and project award activity in water and industrial construction. Outliers are investigated, and if a variance cannot be explained by a clear driver like currency timing, mix shift, or a one-time project, the inputs are revisited and selective respondents are re-contacted.
Before sign-off, a multi-step review is completed across assumptions, math, and narrative consistency so the final numbers remain traceable to the stated variables. Reports are refreshed annually, and interim updates are made when material events occur, after which an analyst performs a final pass close to delivery to keep the view current.
Mordor Intelligence's Progressing Cavity Pump Market Size Measured Against Other Published Estimates
Published market sizes for progressing cavity pumps can look far apart because teams choose different counting rules, year anchors, and price build-ups, and then apply those choices across regions that do not move in sync. We also see splits caused by whether a study treats adjacent product types as part of the same pool or keeps them separate.
The main gap comes from scope and year alignment. Mordor Intelligence counts only progressing cavity pumps in the 2026 value year and avoids folding in broader positive displacement pump categories, while other sources often anchor on 2024 and may blend in nearby rotary technologies or use a different ASP ramp logic. Differences can also come from how currency conversion is timed and whether forecast paths assume a steady municipal capex cycle versus a more aggressive oil and gas upturn.
Benchmark comparison
| Source | Market Size | Gaps in Research Methodology |
|---|---|---|
| Mordor Intelligence | USD 1.73 B (2026) | |
| Global Consultancy A | USD 2.48 B (2024) | Uses a 2024 base year and may apply broader inclusion rules around pump types and channel revenues, which can inflate the counted pool versus a PCP-only cut. |
| Industry Publisher B | USD 2.45 B (2024) | Anchors sizing on 2024 and appears to rely on higher assumed unit penetration across end uses, with limited visibility on how pricing is normalized across regions and applications. |
The spread in the table mostly traces back to what is counted, which year is treated as the current value point, and how pricing and mix are carried forward. By keeping the scope tied to clear PCP use cases and then cross-checking totals with trade signals and interview-based price and volume reality checks, our estimate stays repeatable and easier to audit.
Key Questions Answered in the Report
What is the current size of the progressing cavity pump market?
The progressing cavity pump market reached USD 1.73 billion in 2026 and is projected to hit USD 2.27 billion by 2031.
Which region leads global demand for progressing cavity pumps?
Asia-Pacific commanded 34.21% of 2025 revenue and is forecast to grow at a 8.72% CAGR through 2031 due to large water and infrastructure investments.
Which application segment is expanding the fastest?
Oil and gas artificial-lift projects are driving the quickest growth at a 7.45% CAGR as SAGD and solvent-SAGD wells multiply in Canada and South America.
Why are multistage progressing cavity pumps gaining popularity?
Multistage designs deliver higher discharge pressures and improved efficiency, enabling operators to meet enhanced-oil-recovery and high-head industrial requirements while keeping energy use in check.
How do electric-submersible PCPs improve operating economics?
Electric-submersible units reduce power consumption by up to 55% and cut maintenance visits through integrated sensors and AI-based speed control, lowering total cost of ownership.
What are the main challenges facing progressing cavity pump adoption?
High upfront costs, stator replacement expenses, and abrasive wear in sand-rich fluids remain key restraints, especially in price-sensitive markets without ready access to skilled maintenance teams.