
Programmable Robots Market Size and Share
Market Overview
| Study Period | 2020 - 2031 |
|---|---|
| Market Size (2026) | USD 5.55 Billion |
| Market Size (2031) | USD 11.12 Billion |
| Growth Rate (2026 - 2031) | 14.92 % |
| Fastest Growing Market | Asia Pacific |
| Largest Market | North America |
| Market Concentration | Medium |
Major Players *Disclaimer: Major Players sorted in no particular order Image © Mordor Intelligence. Reuse requires attribution under CC BY 4.0. | |
Programmable Robots Market Analysis by Mordor Intelligence
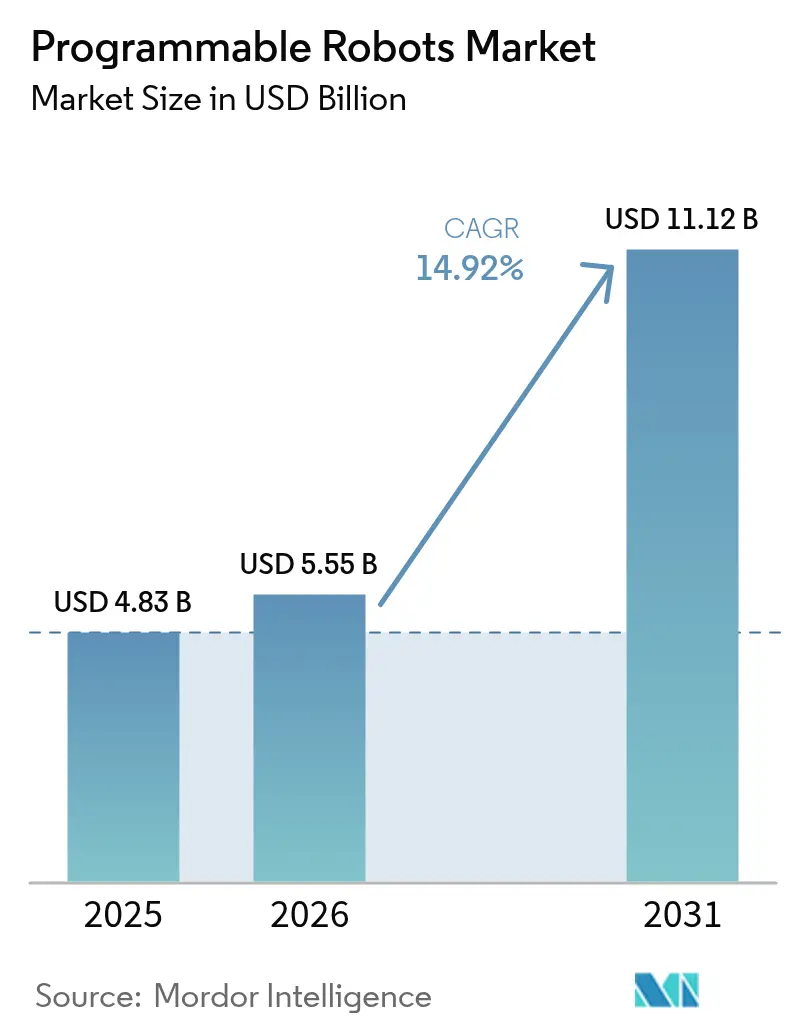
Programmable robots market size in 2026 is estimated at USD 5.55 billion, growing from 2025 value of USD 4.83 billion with 2031 projections showing USD 11.12 billion, growing at 14.92% CAGR over 2026-2031. Growth reflects mandated robotics curricula, falling component prices, and the spread of edge-AI chips that allow robots to process vision and speech locally. National robotics strategies in the United States, China, South Korea, and the United Kingdom align public funding with workforce-development objectives, turning programmable robots into strategic infrastructure. Hardware modularity, bundled software, and subscription-based support services are raising customer-lifetime value, while supply-chain localization initiatives attempt to cushion manufacturers from geopolitical shocks and raw-material constraints. [1]U.S. Department of Commerce, “South Korea Robotics Industry,” trade.gov
Key Report Takeaways
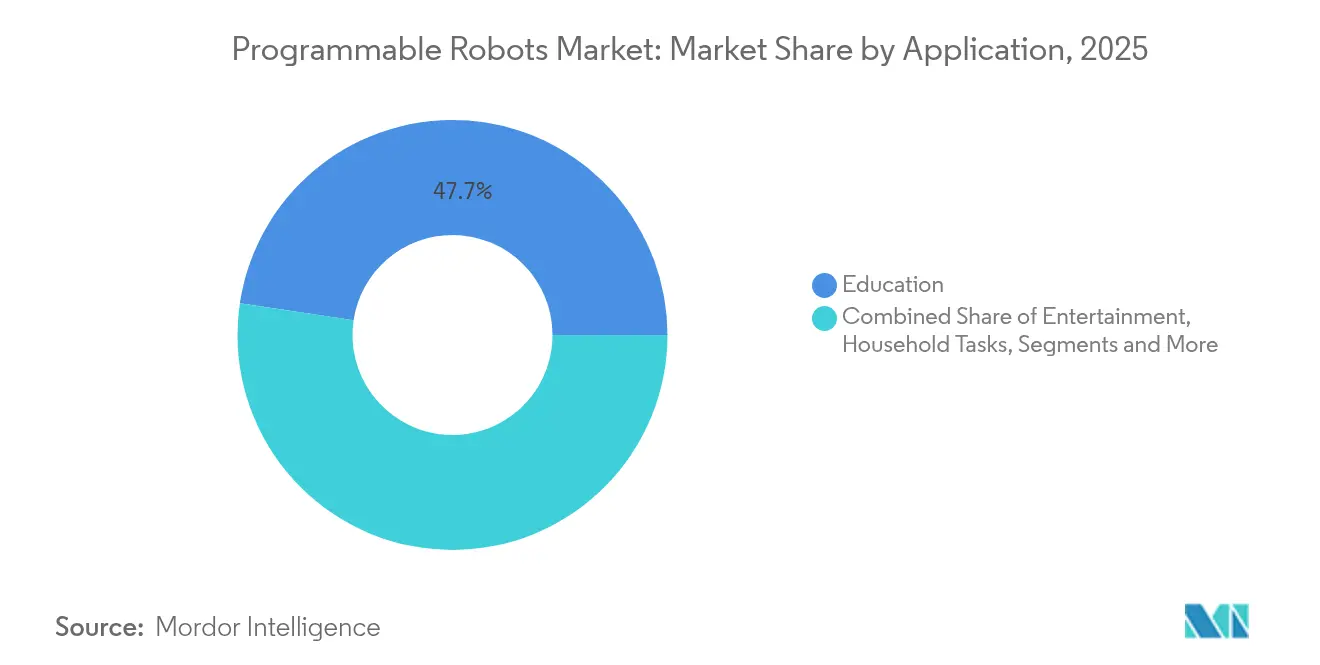
- By application, educational institutions led with 47.65% of programmable robots market share in 2025, whereas research and prototyping is set to grow at 16.72% CAGR to 2031.
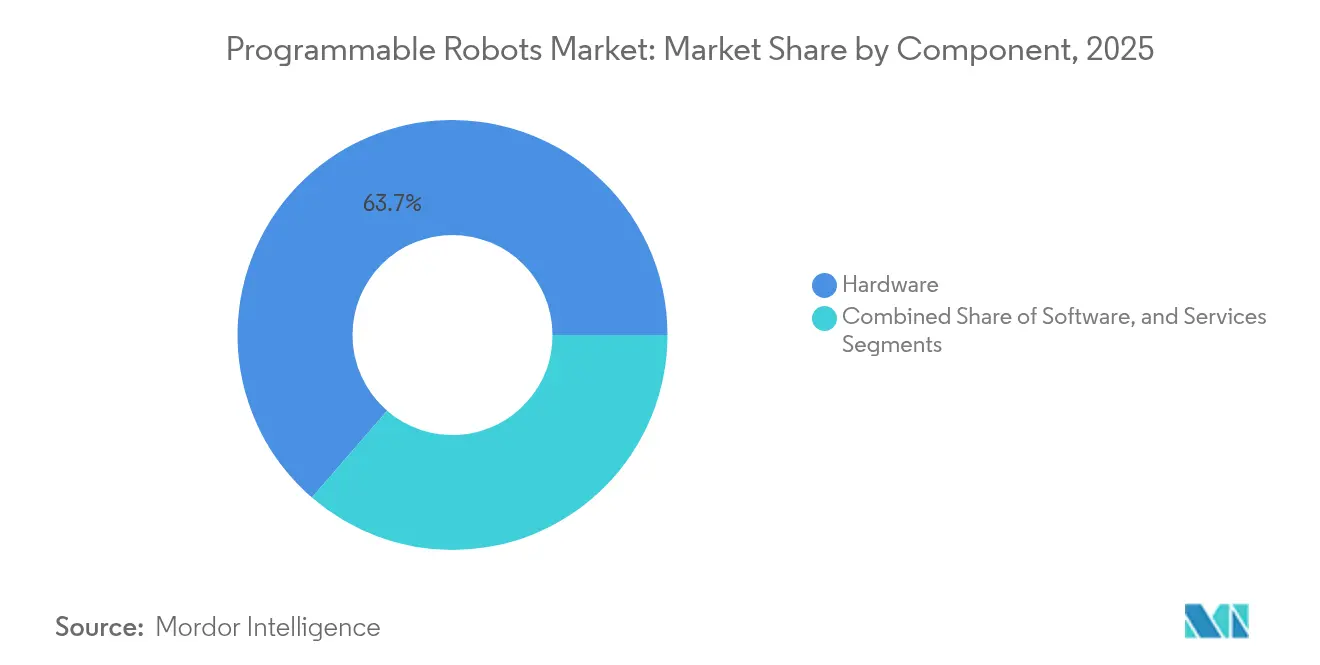
- By component, hardware captured 63.65% revenue share in 2025; services are projected to expand at 15.18% CAGR through 2031.
- By mobility type, wheeled systems held 48.85% share of the programmable robots market size in 2025, while legged and humanoid variants will accelerate at 15.74% CAGR.
- By programming environment, graphical interfaces commanded 56.55% share in 2025; ROS-based platforms will register a 16.88% CAGR to 2031.
- By end-user, K-12 schools accounted for 42.10% of the programmable robots market size in 2025; higher-education and research labs will advance at 16.02% CAGR.
- By region, North America dominated with 37.35% market share in 2025; Asia-Pacific is poised to grow at 16.42% CAGR on the back of China’s USD 138 billion robotics commitment.
Note: Market size and forecast figures in this report are generated using Mordor Intelligence’s proprietary estimation framework, updated with the latest available data and insights as of 2026.
Market Trends and Insights
Drivers Impact Analysis of Programmable Robots Market*
| Driver | (~) % Impact on CAGR Forecast | Geographic Relevance | Impact Timeline |
|---|---|---|---|
| Surge in STEM-based educational curricula adoption | +2.8% | Global, with early gains in North America & EU | Medium term (2-4 years) |
| Falling Li-ion battery prices enabling lighter untethered kits | +2.1% | Global, spill-over from EV supply chain | Short term (≤ 2 years) |
| Mainstream availability of open-source MCU boards | +1.9% | Global, with concentration in maker communities | Short term (≤ 2 years) |
| AI-on-edge chips enabling on-board vision and speech | +3.2% | APAC core, expanding to North America & EU | Medium term (2-4 years) |
| National robotics strategies | +2.4% | APAC leading, followed by EU initiatives | Long term (≥ 4 years) |
| Growing demand for tele-presence care robots in ageing societies | +1.8% | Japan, South Korea, Germany, with expansion to aging demographics globally | Long term (≥ 4 years) |
| Source: Mordor Intelligence | |||
Surge in STEM-Based Educational Curricula Adoption
Robotics has shifted from extracurricular clubs to core classroom requirements, converting discretionary spending into baseline infrastructure outlays. Carnegie Mellon University’s decision to embed VEX V5 vision-sensor modules across its 2025 K-12 programs illustrates how advanced perception is entering early education. Standardized curricula create predictable procurement cycles, letting vendors amortize tooling costs and scale production. Longitudinal studies show that hands-on robotics raises test-score performance in problem-solving domains versus traditional instruction. As school districts lock in multi-year contracts, the programmable robots market secures steady revenue visibility, encouraging entrants to invest in purpose-built education platforms.
Falling Li-Ion Battery Prices Enabling Lighter Untethered Kits
Commodity battery cells leveraged from the electric-vehicle supply chain have reduced cost per watt-hour and improved energy density. Lighter chassis designs now support full-day classroom operation without power tethers, cutting infrastructure costs associated with fixed charging docks. Portable kits also widen the addressable base to after-school programs and remote learning environments. Price elasticity data gathered from 2024 district tenders shows a direct correlation between lower battery pack costs and order quantities for entry-level robotic kits, strengthening volume-based purchasing negotiations.
Mainstream Availability of Open-Source MCU Boards
Community-backed boards such as Arduino, Raspberry Pi, and ESP32 offer low-cost prototyping cores that underpin many entry-level programmable robots. Their extensive libraries shorten development cycles and allow educators to align projects with existing computer-science syllabi. Arduino’s Alvik kit, priced at EUR 169.95 (USD 182.40), packages Wi-Fi, Bluetooth, and multi-language IDE support, demonstrating how open-source ecosystems translate into turnkey learning solutions. The commoditization of controllers narrows performance gaps between premium and budget brands, intensifying competition on software content and customer support.
AI-on-Edge Chips Enabling On-Board Vision and Speech
Neural-processing units embedded in microcontrollers eliminate latency and privacy risks linked to cloud inference. EdgeCortix forecast that 2024 would mark the tipping point for on-device AI, and subsequent silicon releases confirm the trend. NXP’s USD 307 million acquisition of Kinara secures proprietary inference engines for its embedded catalog, letting OEMs differentiate on real-time vision and voice features. Classroom robots can now recognize lab equipment, follow voice prompts, and adapt to dynamic obstacles, sharply increasing pedagogical value and justifying premium unit prices.
Restraints Impact Analysis of Programmable Robots Market*
| Restraint | (~) % Impact on CAGR Forecast | Geographic Relevance | Impact Timeline |
|---|---|---|---|
| Up-front capex vs. fast-evolving feature sets | -1.6% | Global, particularly cost-sensitive educational markets | Medium term (2-4 years) |
| Shortage of classroom-ready coding instructors | -2.1% | Global, acute in developing markets | Long term (≥ 4 years) |
| Safety certification bottlenecks for home robots | -1.3% | North America & EU regulatory markets | Medium term (2-4 years) |
| Supply-chain fragility for small-run custom actuators | -1.8% | Global, concentrated in specialized component markets | Short term (≤ 2 years) |
| Source: Mordor Intelligence | |||
Up-Front Capex Versus Fast-Evolving Feature Sets
School districts face budget cycles that lock specifications for three to five years, yet robotics platforms refresh annually. Buyers fear technological obsolescence, often delaying purchases until standardized feature baselines emerge. Subscription models that bundle hardware refresh options are starting to mitigate this risk but require new procurement policies. The mismatch between capital-approval timelines and rapid component innovation tempers immediate demand, particularly in markets with constrained education budgets.
Shortage of Classroom-Ready Coding Instructors
Rapid curriculum expansion has outpaced teacher-training pipelines. Carnegie Mellon University’s Robotics Academy reports multi-year waiting lists for certification courses, underscoring the capacity. Without skilled facilitators, schools under-utilize purchased kits, reducing repeat orders and word-of-mouth momentum. Industry consortia are investing in asynchronous micro-credential programs, yet the instructor deficit remains a long-term brake on the programmable robots market.
*Our forecasts treat driver/restraint impacts as directional, not additive. The impact forecasts reflect baseline growth, mix effects, and variable interactions.
Programmable Robots Market Segment Analysis
By Component:
Hardware Foundations Drive Revenue StreamsHardware commanded 63.65% of programmable robots market share in 2025, reflecting the capital intensity of mechanical assemblies, sensors, and drive systems. The programmable robots market size for hardware exceeded USD 3.07 billion and is set to grow alongside curriculum mandates that view robots as durable assets. Modular chassis and standardized sensor sockets lower integration friction, enabling cross-grade reusability.
Software, though smaller in revenue, yields margins exceeding 70% for vendors offering subscription upgrades. Services, posting 15.18% CAGR, monetize training hours, lesson-plan libraries, and extended warranties, providing recurring cash flows that smooth hardware seasonality. Institutions increasingly benchmark total cost of ownership, prompting suppliers to bundle hardware, cloud dashboards, and teacher professional-development credits into unified contracts. Over the forecast period, vendors able to translate one-time hardware wins into annuity-style service revenues will outperform peers.


By Mobility Type:
Wheeled Platforms Dominate Despite Humanoid InnovationWheeled robots retained 48.85% programmable robots market share in 2025 because their low part counts and classroom-safe profiles facilitate immediate deployment. The segment benefits from abundant off-the-shelf drivetrain components, keeping average selling prices within public-school grant thresholds.
Yet humanoid and other legged variants are projected to capture a rising slice of programmable robots market size, growing at 15.74% CAGR as actuator prices fall and control algorithms mature. Engineering programs in Europe increasingly adopt bipedal kits to teach gait-planning and force-feedback principles, suggesting a demand spill-over from entertainment and healthcare pilots. Vendors that field platform families spanning wheeled, tracked, and legged options can upsell advanced models as students progress, locking institutions into brand ecosystems.
By Programming Environment:
Accessibility Versus Professional SophisticationGraphical drag-and-drop interfaces held 56.55% share in 2025, and their intuitive blocks remain indispensable for first-time coders. However, ROS-based stacks are set to outpace the segment, advancing at a 16.88% CAGR as universities align syllabi with industry tooling.
The programmable robots market size attributed to ROS kits is forecast to double by 2031, bridging education and professional deployment pathways. Hybrid platforms now ship with dual-mode IDEs that allow students to toggle between block coding and Python, preserving learning continuity. Market entrants emphasizing IDE extensibility, cloud collaboration, and AI code-completion engines are poised to capture share from incumbents limited to static graphical environments.
By Application:
Education Leadership Faces Research AccelerationEducation generated 47.65% of programmable robots market revenue in 2025, cementing its role as the anchor vertical. Standardized procurement frameworks streamline district-level roll-outs, and multi-grade lesson packs encourage renewal orders.
Research and prototyping, with a 16.72% CAGR, will pull an increasing fraction of programmable robots market size as affordable manipulation arms and sensor suites reach smaller labs. Cross-pollination occurs as breakthroughs in research robots feed back into classroom kits through modular add-on packs. Entertainment and household segments remain embryonic but act as marketing funnels that familiarize consumers with brand ecosystems, later steering purchasing decisions in formal education settings.
By End-User:
K-12 Foundation Supports Higher-Education GrowthK-12 institutions captured 42.10% of programmable robots market share in 2025, fueled by federal and state STEM funding streams. Exposure at this level seeds brand loyalty, a fact vendors exploit through certification badges and student competitions.
Higher-education and research centers, expanding at 16.02% CAGR, demand open architectures and industrial-grade sensors to support thesis-level experimentation. OEMs responding with upgrade paths and academic pricing bundles stand to grow wallet share across the education continuum. Hobbyist and maker communities, though smaller in revenue, influence product roadmaps through rapid open-source innovation cycles and serve as beta-test grounds for new modules.
Geography Analysis
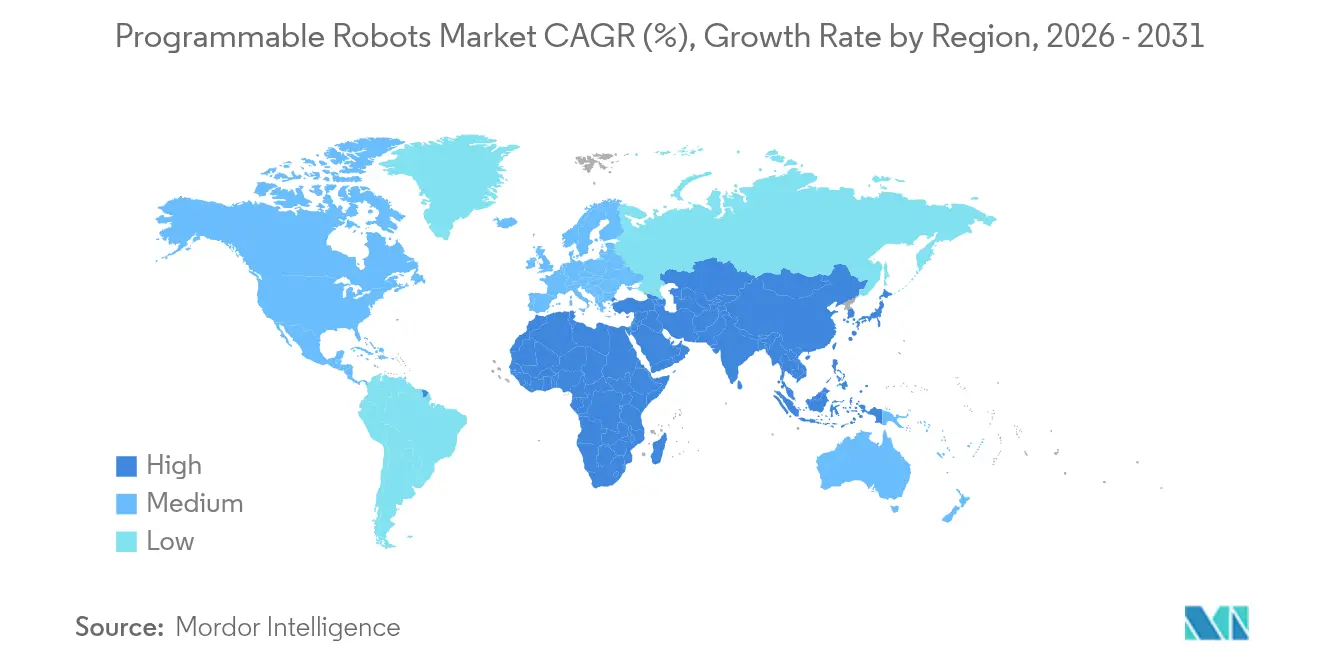
North America Programmable Robots Market
North America held 37.35% programmable robots market share in 2025, underpinned by robust district-level education funding and the National Science Foundation’s expanded robotics grants. Safety frameworks such as UL 3300 and ISO 13482 accelerate time-to-classroom by clarifying compliance pathways. Vendors leverage extensive reseller networks and in-school demonstration programs to shorten sales cycles. Canada’s industrial-policy tilt toward advanced manufacturing and Mexico’s integration into North American supply chains support regional component sourcing, mitigating tariff exposure.
APAC Programmable Robots Market
Asia-Pacific is projected to deliver a 16.42% CAGR, fastest worldwide, as China mobilizes USD 138 billion for robotics acceleration and establishes training facilities in all provincial capitals.South Korea’s KRW 200 billion infrastructure program and Japan’s New Robot Strategy funnel capital toward domestic OEMs, reinforcing local supply-base resilience. India’s National Education Policy emphasizes coding from grade six, unlocking a vast incremental learner cohort. Regional vendors exploit proximity to semiconductor fabs and battery plants, allowing competitive pricing without compromising feature sets.
Europe Programmable Robots Market
Europe records steady growth, anchored by Horizon Europe’s EUR 100 billion innovation budget and Germany’s High-Tech Strategy 2025 allocations. The United Kingdom’s Smart Machines Strategy 2035 forecasts GBP 150 billion in robotics-related GVA, offering a long runway for education-technology investments.However, stringent General Product Safety Regulation updates add compliance costs, favoring suppliers with dedicated regulatory-affairs teams. Pan-European robotics competitions foster ecosystem collaboration, indirectly driving cross-border kit standardization.

Regulatory Landscape
Programmable robots operate under overlapping safety, AI governance, cybersecurity, and liability regimes that tie software behavior to product compliance. In the European Union, the AI Act (Regulation (EU) 2024/1689) adds risk-management, documentation, and oversight duties for certain AI-enabled robotics use cases, while the Machinery Regulation (Regulation (EU) 2023/1230) governs machine safety and conformity assessment. The same product can also fall under the Cyber Resilience Act (Regulation (EU) 2024/2847) for cybersecurity-by-design obligations and the Product Liability Directive (Directive (EU) 2024/2853), increasing the need for traceability and update management across the robot lifecycle.
International standards continue to shape safety and procurement specifications across education, research, and commercial deployments. ISO 10218-1:2025 and ISO 10218-2:2025 (published February 2025) updated safety requirements for industrial robots and robot system integration, while service-robot safety is commonly aligned to ISO 13482. In May 2026, EU negotiators provisionally agreed the Digital Omnibus on AI to streamline how the AI Act interacts with sector product-safety laws such as the Machinery Regulation. Until alignment is fully implemented, manufacturers and importers face dual evidence packages covering functional safety and AI controls, which influences design choices for edge AI, data handling, and software update pathways.
Value Chain Analysis
The programmable robots value chain covers core components (MCUs/SoCs and edge AI accelerators, motor drives and power management ICs, sensors, and batteries), precision mechanicals (actuators, bearings, gearboxes), and final assembly of mobile bases, manipulators, and modular chassis. Software and content layers (graphical IDEs, Python/C++ toolchains, ROS-based stacks, curriculum content, fleet management, and digital twin tools) increasingly drive differentiation, while services (teacher training, deployment, maintenance, warranties, and subscription support) broaden recurring revenues and affect renewal cycles in education and institutional buying.
Upstream constraints shape availability and pricing, particularly for small-run custom actuators and precision gear components. Industry reporting in 2025-2026 highlights lead times extending up to 14 months for some actuator categories, alongside ongoing competition for semiconductor capacity (motor control, sensors, and power ICs). At the same time, industrial-scale robotics partnerships show how OEMs and contract manufacturers build resilience through capacity access and integration: Apptronik partnered with Jabil (February 2025) to scale Apollo humanoid robot manufacturing, and Robust.AI partnered with Foxconn (May 2025) to accelerate production of its Carter platform. Downstream distribution blends direct enterprise sales and integrators with education-focused resellers, where compliance documentation, spares availability, and serviceability have become procurement decision points alongside performance and feature sets.
Competitive Landscape
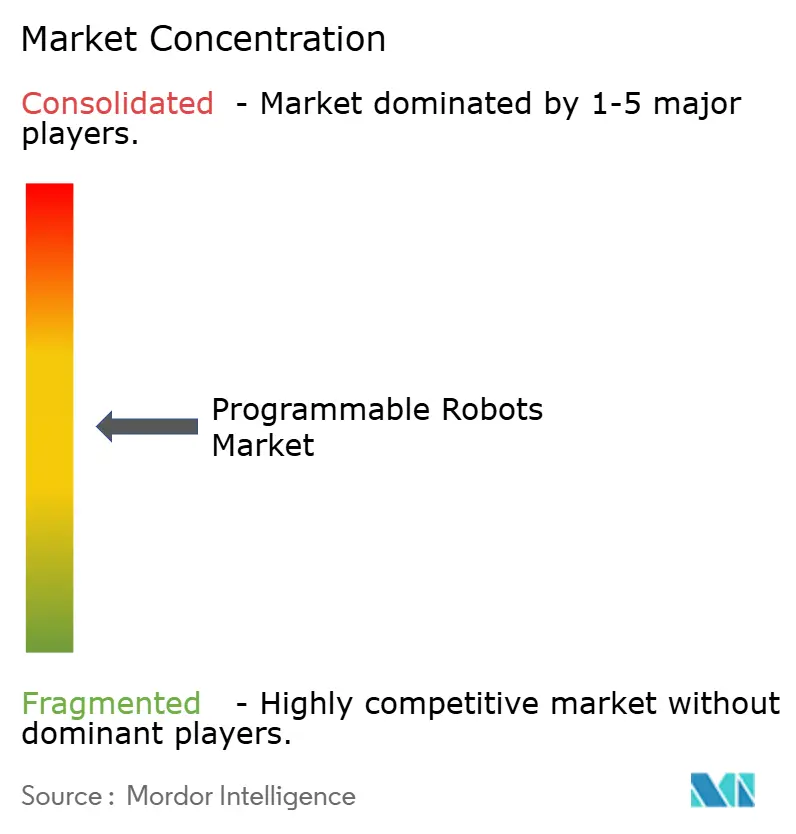
The programmable robots market remains moderately fragmented. LEGO Education and VEX Robotics leverage decades-long educator relationships, proprietary bricks, and global student tournaments to defend share. Emerging Chinese OEMs enter on cost leadership, bundling edge-AI chips sourced domestically to sidestep export-control risks. Mid-tier vendors differentiate through vertical integration; for instance, NXP’s Kinara acquisition embeds neural-inference capabilities directly into controller boards, reducing BOM counts and locking design-win customers into proprietary silicon.
Strategic partnerships shape competitive dynamics. Hardware makers ally with curriculum publishers to bundle standards-aligned lesson libraries, reducing teacher-onboarding friction. Semiconductor firms court robot OEMs with reference designs that shorten time-to-market for AI-enabled models. Regulation also influences rivalry: FDA 510(k) clearances for service-robot platforms, such as the HYDROS System, confer first-mover credibility in healthcare settings. [4]U.S. Food & Drug Administration, “510(k) Summary for HYDROS Robotic System,” fda.gov
Supply-chain resilience is an emerging battleground. Vendors invest in dual-sourcing motors and rare-earth-free permanent magnets to mitigate geopolitical exposure. Manufacturers demonstrating transparent traceability and local assembly capabilities increasingly win public-sector contracts, as education authorities prioritize procurement sovereignty.
Programmable Robots Industry Leaders
Lego Group
iRobot Corp.
SoftBank Robotics
UBTECH Robotics
VEX Robotics (Innovation First)
- *Disclaimer: Major Players sorted in no particular order
Programmable Robots Market Companies Covered in this Report
- iRobot Corporation
- Lego Group
- SoftBank Robotics
- UBTECH Robotics
- VEX Robotics (Innovation First)
- Modular Robotics Inc.
- DJI Technology Co.
- Pudu Robotics
- Xiaomi Corp. (CyberDog)
- Hanson Robotics
- Honda Motor Co. (ASIMO legacy)
- WowWee Group Ltd.
- Fischertechnik GmbH
- SuperDroid Robots Inc.
- Makeblock Co. Ltd.
- Robolink Inc.
- Robotis Co. Ltd.
- Kinova Inc.
- Nippon Electric Company (Nao joint IP)
- GJS Robot

Market Opportunities and Future Outlook
An opportunity for programmable robots lies in expanding from standalone classroom or single-site deployments into platform-led ecosystems that connect devices, workflows, and updates across fleets. Industrial automation moves show how orchestration software is being packaged with robotic hardware, including KUKA's launch of the Automation Management Platform (AMP) in March 2026 to coordinate physical automation with digital twins and AI agents, with reported production usage in a North American automotive plant by July 2026. For vendors serving education and research, this platform pattern creates whitespace around device management, curriculum-aligned content libraries, and bundled professional development that reduces instructor burden and extends customer lifetime value.
Another opportunity is the intersection of edge AI and compliance-by-design as regulators tighten expectations around AI behavior, cybersecurity, and product safety in markets such as the EU. The AI Act (Regulation (EU) 2024/1689), Cyber Resilience Act (Regulation (EU) 2024/2847), and Machinery Regulation (Regulation (EU) 2023/1230) increase the requirement for explainable robot behavior, robust update mechanisms, and traceable components, which favors suppliers that can provide complete technical files and maintain long-term software support. Policy coordination also reinforces adoption programs and standardization: the Barcelona Declaration on Robotics and Automation 2026 (June 2026) sets out policy priorities linked to labor shortages and sustainability, supporting robotics skills pathways and structured deployment frameworks that can be adapted for education, research labs, and service-robot rollouts.
Recent Industry Developments in Programmable Robots Market
- July 2026: iRobot announced the Roomba Electro Plus and expanded its latest Roomba robot lineup, broadening the portfolio beyond core robot vacuums into adjacent floor-care formats. The move supports a wider set of price points and use cases, while keeping iRobot tied to a refresh cycle where software and consumables can complement hardware sales.
- May 2026: SoftBank Robotics America extended its strategic partnership with Direct Supply to deploy autonomous floor care robots in senior living communities. The agreement strengthens a verticalized route-to-market where robots are packaged with facilities workflows, creating a repeatable deployment model in labor-constrained care environments.
- December 2024: South Korea enacted the AI Framework Act, establishing governance expectations for higher-impact AI systems used in areas such as automation and robotics. The framework raises compliance planning needs for vendors entering Korea with AI-enabled programmable robots, influencing documentation, data practices, and product positioning.


Programmable Robots Market Report Scope and Research Methodology
Market Definition and Coverage
This market covers revenue generated from programmable robots and closely tied enabling elements that let them run defined tasks, where programming can be updated as use needs change. It includes hardware, software, and services tied to deploying and operating these robots across common user settings.
Scope exclusions: We exclude general purpose factory automation that is not robot-based, along with stand-alone parts sold for non-robot equipment and unrelated IT services.
Segments Covered in This Report
- By Component
- Hardware
- Software
- Services
- By Mobility Type
- Wheeled
- Tracked
- Legged/Humanoid
- Modular/Re-configurable
- By Programming Environment
- Graphical (Scratch/Block-based)
- Script-based (Python/C/C++)
- ROS-based
- By Application
- Education
- Entertainment
- Household Tasks
- Research and Prototyping
- By End-user
- K-12 Schools
- Higher-Education and Research Labs
- Consumers (DIY/Hobbyists)
- Theme Parks and Exhibition Centres
- By Geography
- North America
- United States
- Canada
- Mexico
- South America
- Brazil
- Argentina
- Rest of South America
- Europe
- Germany
- United Kingdom
- France
- Italy
- Russia
- Rest of Europe
- Asia Pacific
- China
- Japan
- India
- South Korea
- Australia
- Rest of Asia Pacific
- Middle East and Africa
- Middle East
- Saudi Arabia
- UAE
- Turkey
- Rest of Middle East
- Africa
- South Africa
- Nigeria
- Rest of Africa
- Middle East
- North America
Data Sources, Market Sizing, and Validation
Desk Research
Desk research is used to set the factual base for the model and to keep assumptions realistic before any forecasting is done. We reviewed public sources such as International Federation of Robotics releases, US Census Bureau trade and manufacturing series, Eurostat production statistics, UN Comtrade trade flows, and patent databases for robotics-related filings, which help us understand shipment direction, adoption signals, and technology momentum.
To round out the picture, we also used company annual reports, investor presentations, product documentation, and reputed press coverage to map typical pricing layers and how robot offerings are packaged with software and support. Where required, paid subscriptions for company financials and news were used to fill missing revenue splits and track launch timelines. This list is not exhaustive, and many other public sources were referred to for data collection, validation, and research clarification.
Primary Interviews and Surveys
Primary work focused on interviews and structured surveys with robot OEM-side teams, channel partners, system integrators, and large end users that buy or deploy programmable robots. We used these conversations to confirm what is counted as programmable in real buying, sanity-check typical ASP ranges, and validate demand signals across APAC, EMEA, and the Americas before finalizing assumptions.
Distribution of primary research fieldwork respondents
| Company type | Respondent position | Region |
|---|---|---|
| Top tier: 27% | CXOs: 15% | APAC: 43% |
| Mid tier: 58% | Functional/Unit leaders: 40% | EMEA: 34% |
| Smaller Players: 15% | Managers: 45% | Americas: 23% |
Market-Sizing & Forecasting
Sizing starts with a top-down demand pool build that is reconstructed from robotics shipment signals, end-user adoption patterns, and the share of deployments that require reprogrammable control and software-driven task updates. Those totals are then pressure-tested using selective bottom-up approximations, such as sampled ASP times unit volume by robot type, supplier and channel checks on sell-in versus sell-through, and a roll-up of disclosed revenue lines where they clearly map to programmable robots.
Inputs tracked in the model include annual robot shipment trends, regional mix shifts (especially APAC adoption), typical selling price progression for mid-range programmable platforms, attach rates of software and service contracts, and cycle timing around education and training deployments that behave differently than industrial replacement. Forecasts are built using scenario analysis supported by expert consensus on how fast prices normalize and how quickly programming environments standardize. When bottom-up visibility is thin for a geography or a niche application, gaps are handled through proxy penetration rates tied to the nearest comparable end-user base, and rechecked during interviews.
Data Validation & Update Cycle
Validation is done through step-by-step triangulation, where model outputs are compared with independent indicators like shipment direction, public trade movement, and disclosed backlog or order commentary. Outliers are flagged, then assumptions are reworked and rechecked with additional callbacks when the variance is material.
Before sign-off, the work goes through multi-step analyst review so arithmetic, logic, and scope consistency are confirmed, and then a final reasonableness pass is completed right before delivery. The report is refreshed annually, and interim updates are triggered when major product cycles, regulation shifts, or macro demand breaks meaningfully change the outlook.
Mordor Intelligence's Programmable Robots Market Estimate Compared With Other Published Estimates
Published numbers for programmable robots can vary a lot even when the topic label looks the same, because the counted scope and the pricing layers differ from one publisher to the next. The biggest drivers are what gets included beyond robot hardware, how services are treated, and which year is used as the starting point.
The main gap comes from whether software and services linked to deployment are added into the total and how renewals are priced over time, and Mordor Intelligence counts these only when they are directly tied to programmable robot operation and verified through interview checks on typical attach rates and contract terms.
Benchmark comparison
| Source | Market Size | Gaps in Research Methodology |
|---|---|---|
| Mordor Intelligence | USD 5.55 B (2026) | |
| Global Consultancy A | USD 4.27 B (2024) | Uses an earlier base year and tends to emphasize hardware and core software, which can miss later service attachment and the pricing uplift seen as deployments scale. |
| Industry Publisher B | USD 4.70 B (2025) | Carries a longer forecast horizon and a broader type mix, which can pull in adjacent robot categories and apply a higher growth path without the same near-term pricing and adoption checks. |
The table shows that year choice and what gets counted around software and services can move the market total by a noticeable margin. By keeping the inputs tied to observable shipment and adoption signals, and then validating key assumptions through direct expert feedback, our estimate stays traceable to repeatable steps instead of depending on one broad growth view.


Key Questions Answered in the Report
What is the current size of the programmable robots market?
The programmable robots market stands at USD 5.55 billion in 2026 and is projected to grow to USD 11.12 billion by 2031 at a 14.92% CAGR.
Which application segment is expanding fastest?
Research and prototyping applications will expand at 16.72% CAGR through 2031, outpacing education in percentage-growth terms.
Why do wheeled robots dominate classroom use?
Wheeled platforms balance low cost, mechanical simplicity, and safety, enabling immediate deployment without specialized facilities and accounting for 48.85% market share in 2025.
How does Asia-Pacific compare with North America in growth?
Asia-Pacific is forecast to grow at 16.42% CAGR to 2031, almost double North America’s pace, driven by China’s USD 138 billion robotics investment program.
What role do edge-AI chips play in market expansion?
Integrated neural-processing units enable on-board vision and speech, boosting pedagogical value and accelerating adoption, with a +3.2% uplift on forecast CAGR.
What are the main barriers to wider adoption in schools?
High up-front capital expenditure and a shortage of trained coding instructors remain the two most significant restraints, weighing –1.6% and –2.1% on CAGR respectively.
Page last updated on:


 Your data is secure and never sold or shared.


