
Professional Headset Market Size and Share
Market Overview
| Study Period | 2020 - 2031 |
|---|---|
| Market Size (2026) | USD 2.04 Billion |
| Market Size (2031) | USD 2.69 Billion |
| Growth Rate (2026 - 2031) | 5.73 % |
| Fastest Growing Market | Middle East |
| Largest Market | Asia |
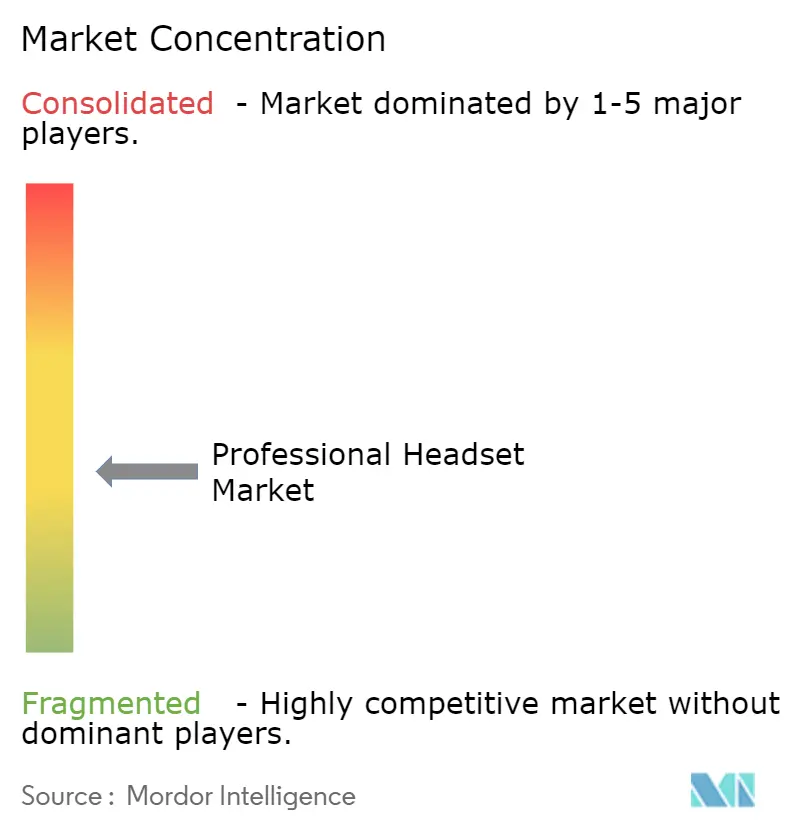
| Market Concentration | Medium |
Major Players *Disclaimer: Major Players sorted in no particular order Image © Mordor Intelligence. Reuse requires attribution under CC BY 4.0. | |
Professional Headset Market Analysis by Mordor Intelligence
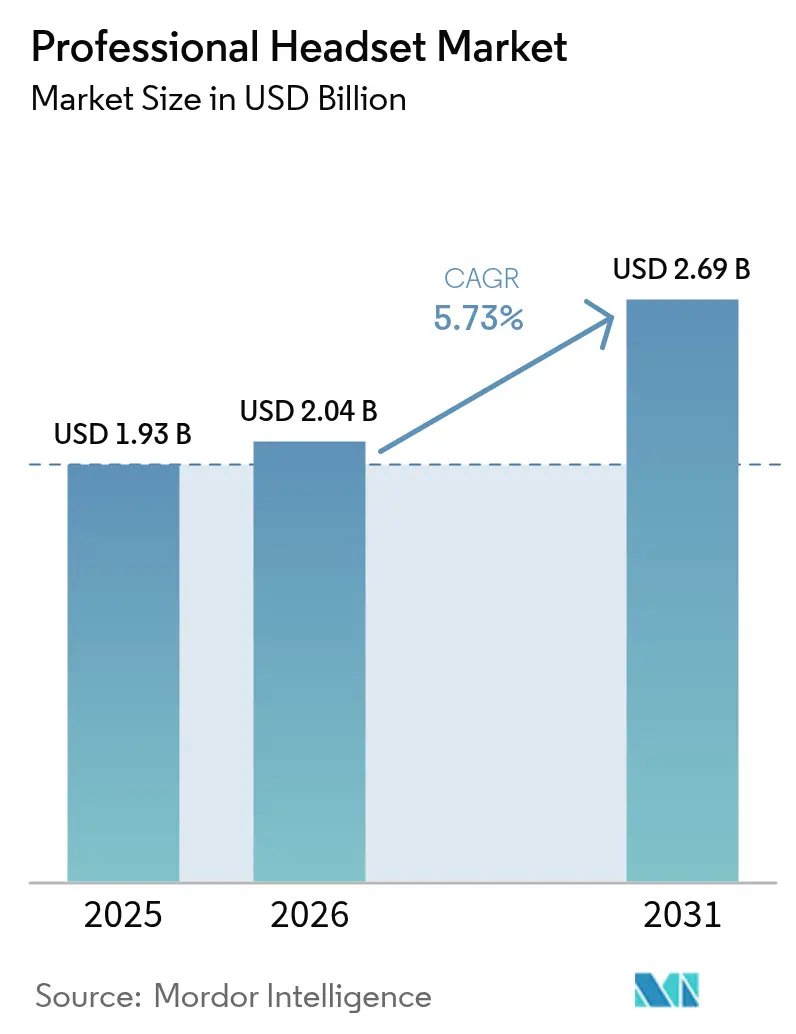
The professional headset market size is expected to grow from USD 1.93 billion in 2025 to USD 2.04 billion in 2026 and is forecast to reach USD 2.69 billion by 2031 at 5.73% CAGR over 2026-2031. Sustained hybrid work adoption, enterprise digital-transformation programs, and AI-enhanced audio processing continue to redefine enterprise communications, turning basic voice accessories into indispensable collaboration endpoints. In North America and Europe, 98% of meetings now include at least one remote participant, anchoring long-term demand for premium headsets that integrate seamlessly with UC platforms. Parallel upgrade cycles in broadcast studios, rapid uptake of active-noise-cancellation (ANC) solutions in Asia-Pacific contact centers, and USB-C laptop standardization are collectively reshaping buyer preferences across corporate, media, education, and esports domains. Finally, supply-chain stress on Bluetooth audio chipsets and expanded Bring-Your-Own-Device (BYOD) policies temper the otherwise robust outlook, nudging some enterprises toward wired or cost-optimized alternatives.
Key Report Takeaways
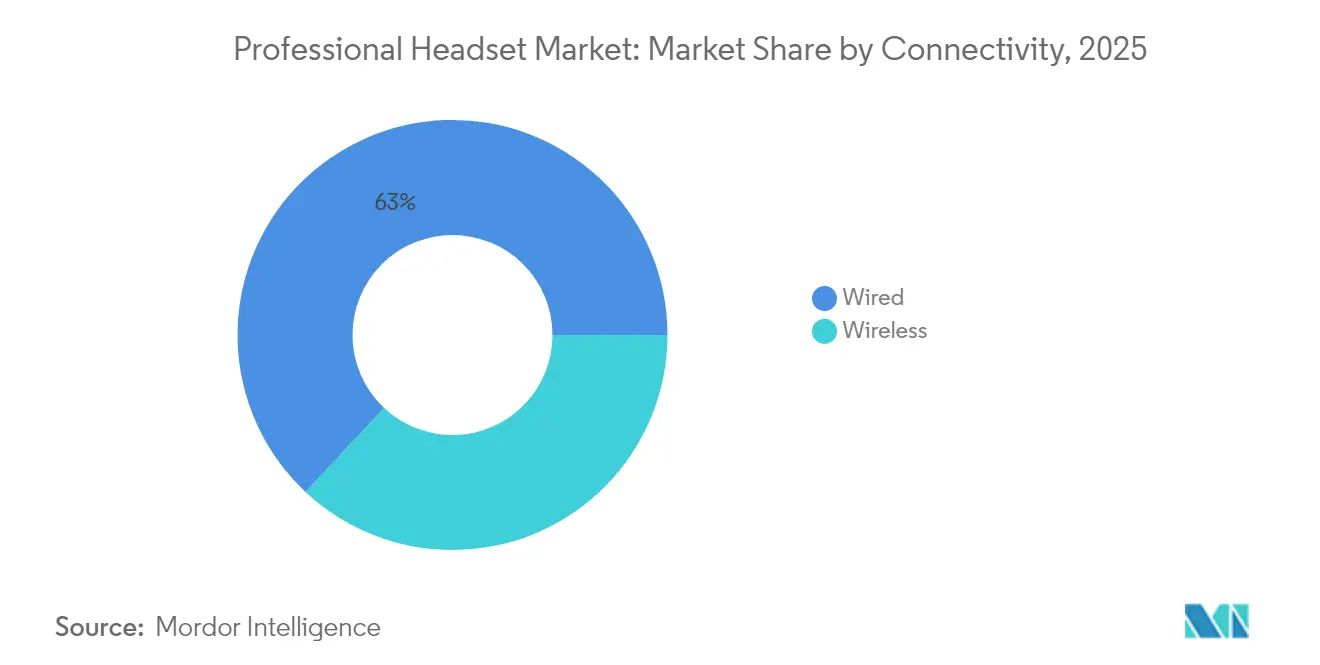
- By connectivity, wired solutions held 63.02% professional headset market share in 2025; wireless alternatives are projected to expand at a 7.7% CAGR through 2031.
- By technology, USB connections commanded 48.05% share of the professional headset market size in 2025, while Bluetooth is advancing at a 6.21% CAGR.
- By wearing style, over-ear designs led with 54.52% revenue share in 2025; in-ear models record the fastest 6.11% CAGR to 2031.
- By noise-cancellation type, passive isolation captured 67.95% of the professional headset market size in 2025; ANC solutions are accelerating at an 8.01% CAGR.
- By end-user, corporate and call centers controlled 42.15% share of the professional headset market in 2025; gaming and esports post the highest 8.6% CAGR.
- By distribution channel, online B2B platforms accounted for 51.44% share in 2025, while direct sales grow at a 5.82% CAGR.
- By geography, Asia held the leading 31.08% share in 2025; the Middle East is the fastest-growing region with a 6.01% CAGR to 2031.
Note: Market size and forecast figures in this report are generated using Mordor Intelligence’s proprietary estimation framework, updated with the latest available data and insights as of 2026.
Market Trends and Insights
Drivers Impact Analysis of Professional Headset Market*
| Driver | (~) % Impact on CAGR Forecast | Geographic Relevance | Impact Timeline |
|---|---|---|---|
| Rapid expansion of hybrid work models | +1.2% | North America & Europe; spill-over to APAC | Medium term (2-4 years) |
| Pro-AV upgrade cycle across global broadcast studios | +0.8% | Global media hubs | Short term (≤2 years) |
| Surging ANC adoption in Asia-Pacific call centers | +1.1% | APAC core; MEA expansion | Medium term (2-4 years) |
| Government-funded digital-learning programs | +0.7% | India & ASEAN | Long term (≥4 years) |
| Esports-arena construction in MENA & Nordics | +0.6% | MENA, Nordics | Medium term (2-4 years) |
| USB-C laptop refresh in enterprises | +0.9% | Global | Short term (≤2 years) |
| Source: Mordor Intelligence | |||
Rapid Expansion of Hybrid Work Models in North America and Europe
Employee confidence gaps around collaboration tools are motivating IT teams to prioritize high-fidelity audio, shifting procurement from basic USB headsets toward AI-enabled devices that optimize acoustics dynamically. Seamless Bluetooth without dongles is gaining favor as enterprises cut desk clutter and simplify device management. Continued office-space reconfiguration reinforces demand for reliable, cross-environment performance, making the professional headset market a core enabler of hybrid productivity.
Pro-AV Upgrade Cycle Across Global Broadcast Studios
IBC 2024 highlighted large-scale moves to cloud-native audio workflows, pushing studios to refresh monitoring gear compatible with software-defined infrastructures. Sennheiser’s Spectera wireless ecosystem and similar launches underscore the quest for robust encryption, multichannel capacity, and cable-free mobility. As 4K and 8K video pipelines harden, demand for headsets that maintain low latency and pristine fidelity rises, supporting stable growth in the professional headset market.
Surging ANC Adoption in Asia-Pacific Call Centers
Analysis of 1.5 million interactions shows two-thirds of far-end audio is non-speech; AI-driven suppression cuts average handle time and reduces agent fatigue, leading contact centers to treat ANC as baseline rather than premium. Health and productivity benefits converge, accelerating penetration of adaptive ANC models across India, the Philippines, and China, and reinforcing APAC’s leadership in the professional headset market.
Government-Funded Digital-Learning Programs Boosting Education Demand
India’s electronics production climbed from INR 5.54 lakh crore in FY 2021 to INR 9.52 lakh crore in FY 2024, aided by incentives that lower component costs for education devices. ASEAN policy support for ed-tech startups similarly fuels uptake of durable, child-safe headsets. Although procurement cycles are lengthy, the installed-base potential is vast, providing a multi-year cushion for the professional headset market.
Restraints Impact Analysis of Professional Headset Market*
| Restraint | (~) % Impact on CAGR Forecast | Geographic Relevance | Impact Timeline |
|---|---|---|---|
| Supply-chain chip constraints | -0.9% | Global; Asian hubs | Short term (≤2 years) |
| Growing BYOD trend | -0.7% | North America & Europe; APAC adoption | Medium term (2-4 years) |
| Price-sensitive SMEs shifting to low-cost ODM brands | -0.5% | Global SMEs | Long term (≥4 years) |
| Stricter SPL exposure rules in studios | -0.3% | Developed markets | Medium term (2-4 years) |
| Source: Mordor Intelligence | |||
Supply-Chain Chip Constraints Limiting Bluetooth Audio SoC Availability
Lead times topping 54 weeks and component cost inflation of 10-20% squeeze production schedules, delaying wireless-product launches and nudging some buyers back toward wired SKUs.[1] Freight-rate spikes aggravate pricing pressure, slowing adoption of premium Bluetooth models within the professional headset market.
Growing BYOD Trend Diluting Employer Budgets
Tighter hardware tariffs and high ticket AR/VR devices make CIOs rethink refresh cycles, while knowledge workers prefer multipurpose consumer headsets, eroding centralized purchases. [3] The resulting dual-track environment compresses manufacturer margins and complicates enterprise sales forecasting.
*Our forecasts treat driver/restraint impacts as directional, not additive. The impact forecasts reflect baseline growth, mix effects, and variable interactions.
Professional Headset Market Segment Analysis
By Connectivity:
Wired Dominance Faces Wireless DisruptionWired solutions secured 63.02% professional headset market share in 2025 on the strength of predictable performance and security. Procurement teams value freedom from batteries and radio-interference risk, anchoring demand among finance, government, and regulated verticals. Yet wireless shipments climbed at 7.7% CAGR, aided by USB-C ubiquity and direct-to-PC Bluetooth that removes dongle overhead.
Advances such as Bluetooth LE Audio and WMAS multichannel schemes shorten latency and enhance encryption, narrowing the historic reliability gap. Mobility-driven workflows in broadcast control rooms and hybrid offices tilt sentiment toward cable-free designs, suggesting wireless volumes could approach parity with wired by decade-end as the professional headset market evolves.

By Technology Type:
USB Leadership Challenged by Bluetooth InnovationUSB connections held 48.05% of total revenue in 2025, providing plug-and-play clarity that resonates with help-desk teams. Enterprises appreciate deterministic audio paths and lower support tickets, keeping USB headsets central to bulk deployments within the professional headset market size for core communication roles.
Bluetooth, however, is pacing 6.21% CAGR as operating systems embed LE Audio and as multi-device roaming proves vital for desk-sharing. DECT maintains security-critical niches, while dual-mode designs that combine USB reliability with Bluetooth mobility become common, allowing users to toggle contexts without swapping hardware.
By Wearing Style:
Over-ear Comfort Meets In-ear MobilityOver-ear designs dominated with 54.52% revenue share in 2025 thanks to superior isolation and ergonomic padding critical for long shifts. Broad ear-cup volume also accommodates larger transducers that deliver full-range monitoring for editing suites and call-quality analytics.
Miniaturized drivers and beamforming mics now allow in-ear formats to achieve comparable speech intelligibility, propelling a 6.11% CAGR as mobile executives favor pocketable options. On-ear styles remain transitional, balancing ventilation against noise attenuation, and modular rigs that swap cushions or boom arms broaden user choice in the professional headset market.
By Noise Cancellation:
Passive Solutions Face Active DisruptionPassive isolation accounted for 67.95% of 2025 sales, reflecting historical cost efficiency. Emerging wideband ANC, however, grows at 8.01% CAGR as AI algorithms suppress both low- and mid-frequency distractions in open offices.
Adaptive ANC that differentiates voices from ambience is becoming standard in contact centers, enhancing agent wellness and customer experience. As component costs fall, ANC will migrate deeper into entry-level tiers, progressively displacing purely passive SKUs within the professional headset market.
By End-User:
Corporate Dominance Faces Gaming DisruptionCorporate and call-center buyers retained 42.15% share in 2025, driven by formal hybrid-work policies and unified-communications upgrades. Enterprises increasingly bundle headsets with meeting-room hardware, cementing volume.
Esports and gaming, supported by MENA-backed arena construction, post an 8.6% CAGR. Professional players demand low-latency spatial audio and durable mic booms, introducing premium-feature expectations that spill into mainstream corporate offerings, enlarging the professional headset market.

By Distribution Channel:
Online B2B Platforms Lead Digital TransformationOnline B2B portals delivered 51.44% of 2025 shipments, streamlining technical comparisons, bulk pricing, and drop-shipping logistics. Integration with enterprise procurement suites accelerates cycle times and documentation compliance.
Direct-sales growth of 5.82% CAGR reflects complex solution needs; vendors deploy dedicated engineers for custom fitting and firmware configuration. Retail still serves freelance professionals and SME replenishment, ensuring multichannel presence stays pivotal for the professional headset market.
Geography Analysis
APAC Professional Headset Market
Asia generated 31.08% of global revenue in 2025, propelled by enormous contact-center headcount and aggressive ANC uptake in China, India, and Japan. India’s electronics-production surge and favorable PLI incentives further nurture local build-to-serve strategies, lowering landed costs and fostering regional OEM ecosystems. Government digital-education schemes add incremental volumes over the medium term.
North America and Europe Professional Headset Market
North America and Europe together represent a mature but lucrative base where headset ASPs are highest. Nearly universal hybrid meeting formats, strict hearing-protection rules, and strong Microsoft Teams and Zoom adoption keep refresh intervals tight, sustaining the professional headset market. Enterprises in these regions favor AI-driven noise management and device-fleet analytics to optimize user experience and compliance.
MEA and South America Professional Headset Market
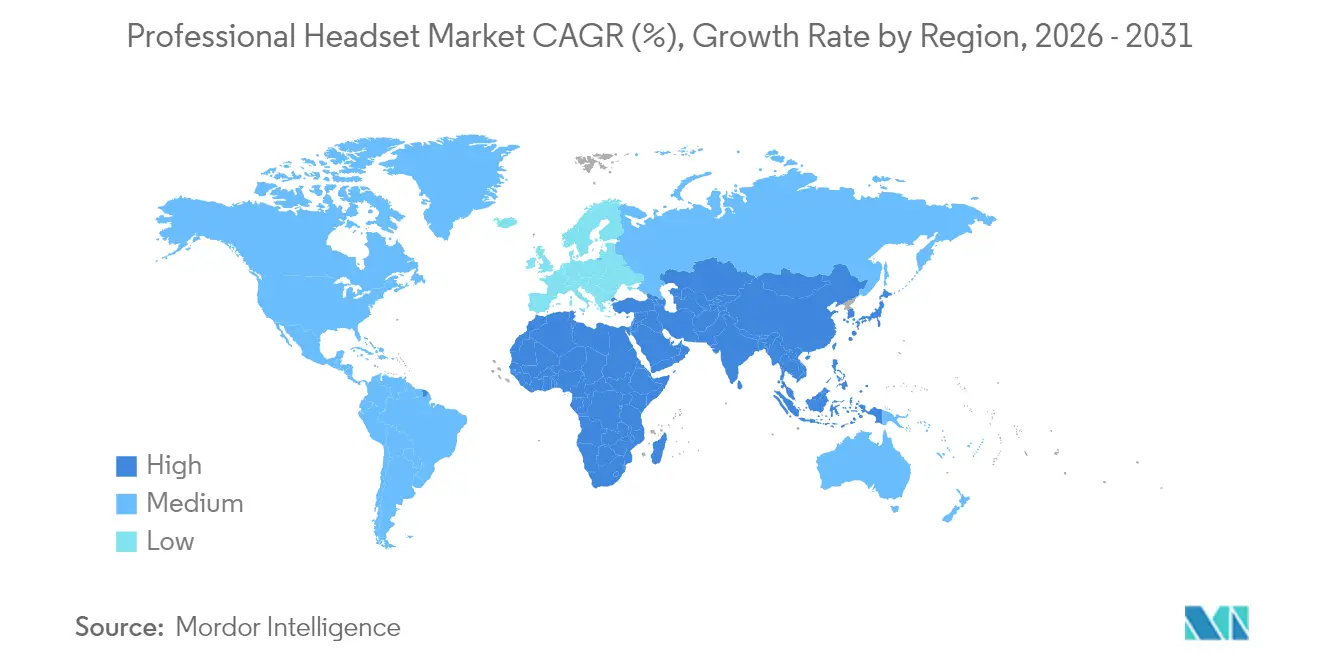
The Middle East logs the fastest 6.01% CAGR as Riyadh and Dubai fund esports complexes and media hubs. Vision 2030 initiatives position technology and entertainment at the center of economic diversification, creating demand for premium audio. South America and Africa remain early-stage, with uptake paced by macro-economic stability and broadband penetration, but represent long-run whitespace once affordability improves.
Regulatory Landscape
Professional headsets that incorporate wireless connectivity (Bluetooth, DECT, or other RF) fall under established safety, EMC, and spectrum compliance regimes. In the United States, RF-enabled headsets must complete FCC equipment authorization before they can be imported or marketed, which makes certification planning and test-lab scheduling a practical gating item for global product rollouts and for enterprise buyers that require documented compliance.
In Europe, suppliers align to the Radio Equipment Directive (RED) 2014/53/EU alongside the EMC Directive 2014/30/EU and RoHS Directive 2011/65/EU, which shape requirements for RF performance, electromagnetic compatibility, and restricted substances across wired and wireless portfolios. Trade and telecom policy actions also affect electronics supply-chain costs and deployment conditions. For example, U.S. CBP implemented Section 232 import duties of 25% ad valorem on specific semiconductors and derivative products effective January 15, 2026, increasing sensitivity to chipset sourcing and classification for headset OEMs and their EMS partners.
Value Chain Analysis
The professional headset value chain starts with component sourcing (acoustic drivers, microphones, batteries, wireless audio SoCs, and mechanical parts), then moves into industrial design, acoustics and DSP tuning, firmware, and certification workflows, including platform certifications linked to unified communications environments. Many brands use electronics manufacturing services (EMS) providers for injection molding, PCB layout, SMT assembly, final assembly, and acoustic testing, while keeping differentiation in microphone processing, noise-management algorithms, ergonomics, and device-management software.
Distribution runs through online B2B portals, direct enterprise sales, and specialist resellers, with after-sales support (spares, replaceable ear cushions, battery service, and firmware lifecycle management) shaping total cost of ownership in corporate and contact-center deployments. Supply constraints remain a structural friction point in the chain, reflected by professional audio industry feedback in 2024 where a large share of manufacturers reported high or major impacts from semiconductor availability disruptions. These shortages then affect Bluetooth headset lead times, portfolio mix decisions (wired vs. wireless), and inventory buffering strategies.
Competitive Landscape
The professional headset market is moderately concentrated. Logitech, GN/Jabra, and Sennheiser combine broad catalogs, channel reach, and firmware ecosystems to anchor enterprise contracts. Logitech’s Q1 FY25 headset revenue climbed 20%, buoyed by efficient component procurement and cross-selling of mice and webcams.[2] GN/Jabra leverages combined hearing-health and UC expertise to serve both retail and pro channels. Sennheiser focuses on broadcast and audiophile niches, using Spectera and other wireless innovations to protect high-margin segments.
Tier-two players like Poly (HP) and Shure chase UC-certified certifications and specialized verticals, while consumer-gaming brands Razer and SteelSeries use esports endorsements to enter corporate BYOD pools. ODM manufacturers in Shenzhen and Suzhou undercut incumbents on price, supplying white-label stock to SMB resellers but lacking global support networks.
Innovation centers on AI noise reduction, spatial-audio rendering, and multi-point connectivity. Vendors with diversified silicon supply, in-house DSP design, and cloud-management portals are positioned to outpace rivals in the evolving professional headset market.
Professional Headset Industry Leaders
-
Logitech International S.A.
-
HP Inc. (Poly/Plantronics)
-
GN Store Nord A/S (Jabra)
-
Sennheiser Electronic GmbH and Co. KG
-
Sony Corporation
- *Disclaimer: Major Players sorted in no particular order
Professional Headset Market Companies Covered in this Report
- Logitech International S.A.
- HP Inc. (Poly/Plantronics)
- GN Store Nord A/S (Jabra)
- Sennheiser Electronic GmbH and Co. KG
- Sony Corporation
- Shure Inc.
- beyerdynamic GmbH
- Audio-Technica Corp.
- AKG Acoustics (Harman)
- Bose Corporation
- Razer Inc.
- SteelSeries ApS
- Turtle Beach Corporation
- Kingston Technology (HyperX)
- V-Moda LLC
- Bang and Olufsen A/S
- Creative Technology Ltd.
- Koss Corporation
- Klipsch Group Inc.
- Skullcandy Inc.
Market Opportunities and Future Outlook
A clear whitespace is emerging around enterprise-grade manageability and analytics that treat headsets as governed endpoints rather than simple peripherals, particularly as BYOD and mixed device fleets increase support complexity. This is showing up in vendor platform strategies that package headset telemetry, policy control, and troubleshooting into unified management consoles. For example, HP's Poly Lens, with integrations with collaboration analytics platforms such as Vyopta Inc., gives IT teams a path to standardize user experience and reduce support load across distributed workforces.
There is also an opportunity to productize AI-assisted voice pickup and noise management into broader certified portfolios across wired and wireless, supported by recent enterprise launches. In June 2026, HP debuted the Poly Focus 6 Series Bluetooth headsets with Acoustic Fence 2.0 noise reduction, hybrid ANC, and spatial audio, positioned with certifications for Google Meet, Google Voice, Microsoft Teams, and Zoom, including direct Bluetooth certification that removes dongle dependency. This direction tracks buyer priorities shaped by USB-C standardization, open-office noise, and contact-center fatigue reduction, while still leaving room for vendors that pair acoustic performance with compliance-ready documentation and scalable fleet operations.
Recent Industry Developments in Professional Headset Market
- July 2026: Jabra expanded its Evolve3 lineup with three new models (Evolve3 65 Flex, Evolve3 65, and Evolve3 45), extending the series across additional workstyles. The product expansion broadens enterprise coverage from desk-based roles to more mobile work, supporting wider standardization within corporate procurement programs.
- February 2026: HP introduced the Poly Mission Series wired USB headsets (Mission 400, 600, and 800) at ISE 2026. The launch broadened HP Polys professional portfolio for environments that prioritize reliability and plug-and-play deployment, reinforcing the continued role of wired SKUs alongside wireless growth.
- May 2024: Logitech unveiled a major enterprise headset platform refresh, introducing the Zone Pro line and fleet-management integrations with Teams, Zoom, and Meet. IT teams gained a pathway to standardize deployment and analytics across distributed workforces, expanding cross-platform compatibility and compliance readiness.
Professional Headset Market Report Scope and Research Methodology
Market Definition and Coverage
This market covers professional headsets bought for workplace audio and voice use, including wired and wireless boom-mic models that connect to desk phones, softphones, or enterprise USB and DECT endpoints. We treat the market as revenue generated from these devices when sold for office and contact center use.
Scope exclusions: We exclude consumer-only entertainment headsets, gaming headsets, disposable earbuds, true-wireless retail earphones, and AR/VR head-mounted devices.
Segments Covered in This Report
- By Connectivity
- Wired
- Wireless
- By Technology Type
- USB
- Bluetooth
- DECT
- Unified Communication (UC)
- By Wearing Style
- Over-ear (Circumaural)
- On-ear (Supra-aural)
- In-ear (Canal)
- By Noise Cancellation
- Passive Noise Isolation
- Active Noise Cancellation (ANC)
- By End-User
- Corporate and Call Centers
- Education and Digital Learning
- Broadcast and Media Production
- Gaming and Esports Arenas
- Music Recording and Live Sound
- Others
- By Distribution Channel
- Online B2B Portals
- Direct Sales
- Retail (Specialty and Mass)
- By Geography
- North America
- United States
- Canada
- Mexico
- Europe
- Germany
- United Kingdom
- France
- Nordics
- Rest of Europe
- South America
- Brazil
- Rest of South America
- Asia-Pacific
- China
- Japan
- India
- South-East Asia
- Rest of Asia-Pacific
- Middle East and Africa
- Middle East
- Gulf Cooperation Council Countries
- Turkey
- Rest of Middle East
- Africa
- South Africa
- Rest of Africa
- Middle East
- North America
Data Sources, Market Sizing, and Validation
Desk Research
Desk research starts by fixing what counts as a professional headset and what does not, then mapping demand signals that drive buying in offices and contact centers. We mainly refer to public and official sources such as the International Telecommunication Union for connectivity trends, the World Bank and OECD for macro and services indicators, and the US Bureau of Labor Statistics for labor and workplace signals that correlate with headset deployment.
To make the inputs usable in a market model, we also review company filings, earnings call transcripts, investor presentations, and product documentation that clarify connectivity standards like USB, DECT, and Bluetooth. A paid subscription for company financials and a patent database are used selectively to sanity-check revenue direction and feature timing, especially for noise cancellation and multi-connectivity. These sources are illustrative only, and many other public and proprietary references were also used for data collection, validation, and clarification.
Primary Interviews and Surveys
Primary work focuses on confirming what enterprise buyers actually purchase for work setups, how replacement cycles are evolving, and how pricing shifts as features like active noise canceling and UC compatibility become more common. We speak with a mix of headset manufacturers, channel partners, enterprise IT and procurement teams, and contact center operations leaders across APAC, EMEA, and the Americas so gaps from desk research can be narrowed and key assumptions can be rechecked before totals are finalized.
Distribution of primary research fieldwork respondents
| Company type | Respondent position | Region |
|---|---|---|
| Top tier: 30% | CXOs: 13% | APAC: 46% |
| Mid tier: 56% | Functional/Unit leaders: 42% | EMEA: 36% |
| Smaller Players: 14% | Managers: 45% | Americas: 18% |
Market-Sizing & Forecasting
The sizing starts with a top-down build where enterprise endpoint adoption and work-use headset penetration are used to reconstruct the addressable demand pool by region, and then converted into revenue using blended pricing. Once the first cut is ready, selective bottom-up checks are run using supplier revenue cues, channel feedback, and sampled price points for wired and wireless models so totals can be adjusted where the first cut looks overstretched.
Key inputs that help the model behave realistically include contact center seat additions and churn, hybrid-work intensity by region, the mix shift from wired to cordless (DECT and Bluetooth), the attach rate of USB dongles and certified bundles, and average selling price movement as noise-canceling becomes more common. Where public data is limited in a given country, we use proxy indicators such as employment mix and enterprise connectivity readiness, then validate the implied volumes with interview feedback to avoid filling gaps with aggressive assumptions.
For forecasting, we use multivariate regression because several drivers move together, and expert inputs can be used to keep coefficients sensible. The forward view is then stress-tested through scenario analysis around pricing progression, replacement cycles, and contact center hiring patterns, and the final forecast is selected only after the scenarios remain consistent with observed demand signals.
Data Validation & Update Cycle
Before final numbers are signed off, outputs are compared with independent signals such as enterprise device spending direction, connectivity adoption, and the expected mix of wired versus cordless deployments. Outliers are flagged, assumptions are revisited, and a second analyst review is completed so math errors and scope drift do not slip through.
If interview feedback or fresh public data suggests a material change, respondents are re-contacted and the affected parts of the model are recalculated, followed by a final consistency check across regions and years. Reports are refreshed annually, and interim updates are made when major product, pricing, or macro events materially change demand, followed by a final pre-delivery pass so clients receive the latest updated view.
Mordor Intelligence's Professional Headset Market Size Measured Against Other Published Estimates
Published market sizes for professional headsets can look far apart because the market definition is easy to stretch, and some studies use different base years and different ways to treat pricing for feature-heavy models. We keep the discussion tied to signals that can be checked, and then we document what was included so the estimate stays explainable.
Replacement-cycle feedback from enterprise IT teams and channel checks on wired versus cordless mix are evidence points that keep Mordor Intelligence aligned to workplace headset demand, without adding consumer audio categories that share similar form factors. The remaining gaps typically come from whether accessories and bundled items are counted as separate revenue, how UC certification and dongles are treated, the chosen currency conversion timing, and how often assumptions are refreshed when pricing and mix shift quickly.
Benchmark comparison
| Source | Market Size | Gaps in Research Methodology |
|---|---|---|
| Mordor Intelligence | USD 1.93 B (2025) | |
| Global Consultancy A | USD 2.10 B (2025) | The estimate appears to apply a wider scope that blends in additional enterprise audio endpoints and may not separate bundled accessories from device revenue consistently, which can lift the 2025 total. |
| Industry Publisher B | USD 1.80 B (2024) | The figure is anchored to a 2024 base year and explicitly includes several accessory and component revenue lines, so year alignment and what is counted as headset-related revenue can shift the headline size. |
Across the three figures, the spread is explained more by scope and year choices than by arithmetic. When the model is kept linked to observable demand signals and the pricing and mix assumptions are rechecked in fieldwork, the final market size stays transparent and repeatable from one refresh to the next.
Key Questions Answered in the Report
What is the current professional headset market size?
The professional headset market size is USD 2.04 billion in 2026 and is projected to reach USD 2.69 billion by 2031.
Which region leads the professional headset market?
Asia leads with 31.08% revenue share, fueled by large contact-center operations and aggressive ANC adoption.
What connectivity option dominates professional deployments?
Wired headsets remain dominant, holding 63.02% professional headset market share in 2025, though wireless is gaining quickly.
How fast is the gaming and esports segment growing?
Gaming and esports headset demand is climbing at an 8.6% CAGR through 2031, the fastest among end-user categories.