
Product Information Management (PIM) Market Size and Share
Market Overview
| Study Period | 2020 - 2031 |
|---|---|
| Market Size (2026) | USD 19.95 Billion |
| Market Size (2031) | USD 37.39 Billion |
| Growth Rate (2026 - 2031) | 13.38% CAGR |
| Fastest Growing Market | Asia Pacific |
| Largest Market | North America |
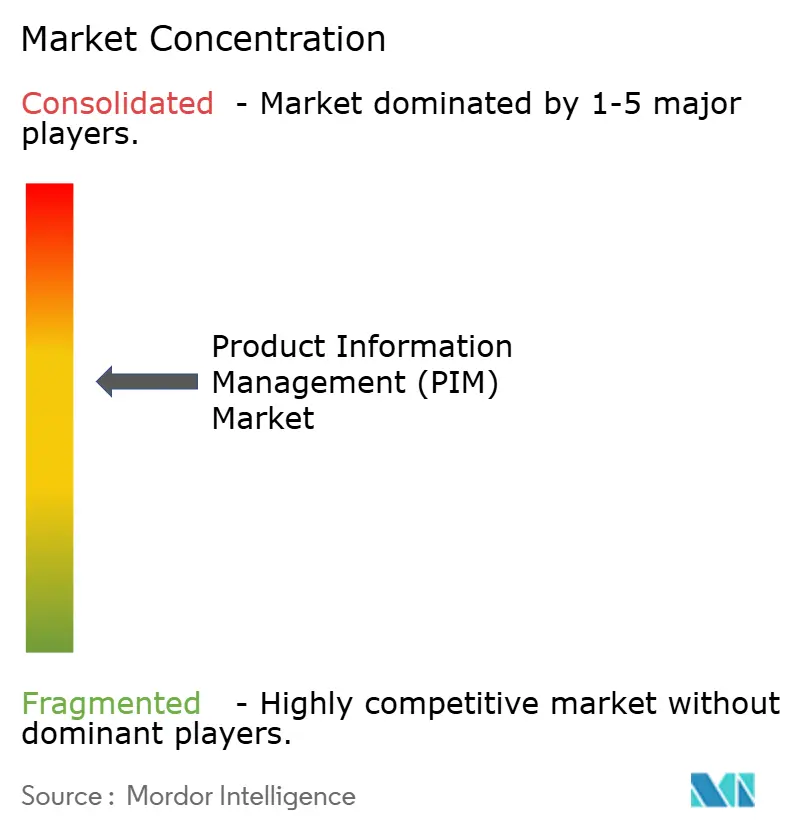
| Market Concentration | Medium |
Major Players *Disclaimer: Major Players sorted in no particular order Image © Mordor Intelligence. Reuse requires attribution under CC BY 4.0. | |
Product Information Management (PIM) Market Analysis by Mordor Intelligence
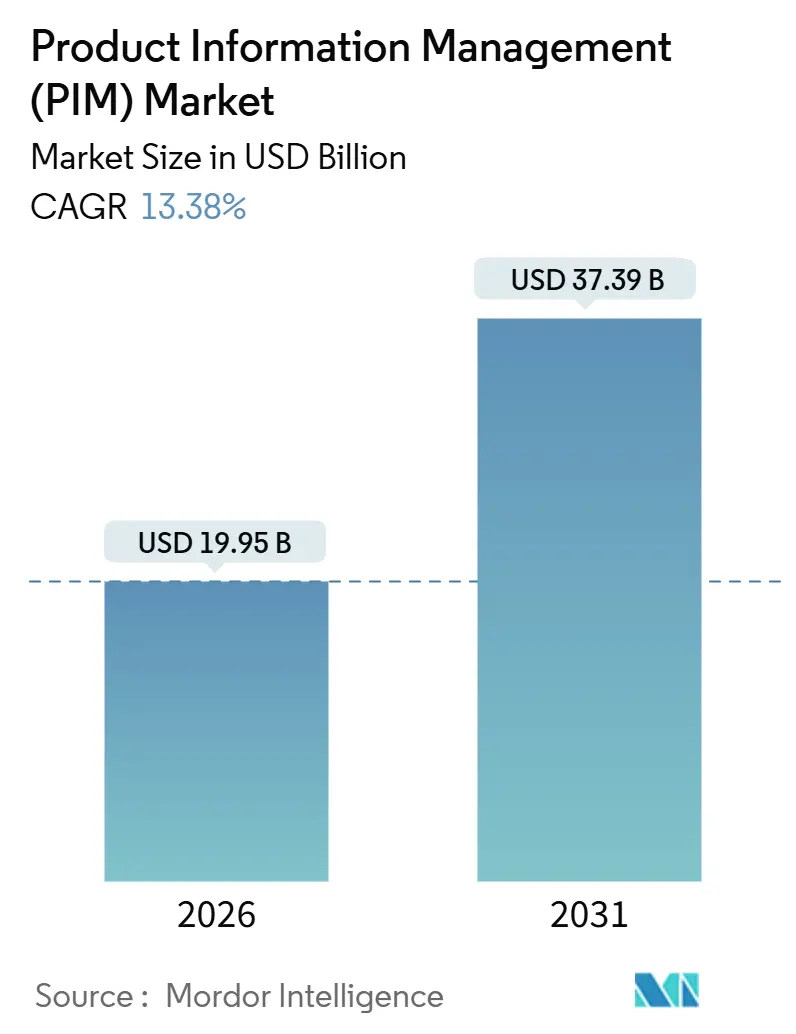
The Product Information Management market size stands at USD 19.95 billion in 2026 and is projected to reach USD 37.39 billion by 2031, registering a 13.38% CAGR through the forecast period. The growth reflects a decisive migration from fragmented spreadsheets toward unified, AI-native hubs that meet simultaneous demands for regulatory traceability and omnichannel speed. Investment is accelerating as European Digital Product Passport deadlines approach, as quick-commerce marketplaces mandate sub-hour catalog refresh cycles, and as large language models automate attribute enrichment at scale[1]European Health and Digital Executive Agency, “Digital Product Passport,” europa.eu. Competitive intensity is rising because platform vendors are bundling master data management and generative AI into single suites, raising the switching costs for incumbent on-premise users. Long-term expansion is further anchored in the proven link between accurate product data and higher conversion, lower returns, and stronger brand equity.
Key Report Takeaways
- By deployment model, cloud captured 63.50% of Product Information Management market share in 2025 and is expanding at an 18.50% CAGR through 2031.
- By offering, solutions held 63.14% revenue share in 2025 while services are advancing at a 23.40% CAGR to 2031.
- By organization size, large enterprises accounted for 68.80% share of the Product Information Management market in 2025, and small and medium enterprises are growing at an 18.43% CAGR through 2031.
- By end-user industry, retail and e-commerce led with a 33.20% share in 2025, whereas IT and telecom records the highest 19.50% CAGR over the forecast horizon.
- By geography, North America contributed 39.80% of revenue in 2025, while Asia-Pacific is set to expand at a 20.10% CAGR to 2031.
Note: Market size and forecast figures in this report are generated using Mordor Intelligence’s proprietary estimation framework, updated with the latest available data and insights as of January 2026.
Global Product Information Management (PIM) Market Trends and Insights
Drivers Impact Analysis*
| Driver | (~) % Impact on CAGR Forecast | Geographic Relevance | Impact Timeline |
|---|---|---|---|
| E-commerce Boom and SKU Proliferation | +3.2% | Global, strongest in Asia-Pacific and North America | Medium term (2-4 years) |
| Cloud Adoption Lowering TCO | +2.8% | Global, led by North America and Europe | Short term (≤ 2 years) |
| Omnichannel Customer-Experience Mandates | +2.1% | Global, notably North America, Europe, and urban Asia-Pacific | Medium term (2-4 years) |
| EU Digital Product Passport Compliance | +1.9% | Europe primary, spillover to Asia-Pacific and North America exporters | Long term (≥ 4 years) |
| Gen-AI-Ready Product-Content Pipelines | +1.7% | Global, early adopters in North America and Europe | Short term (≤ 2 years) |
| Marketplace Quick-Commerce API Requirements | +1.5% | Global, clusters in North America, Europe, select Asia-Pacific metros | Short term (≤ 2 years) |
| Source: Mordor Intelligence | |||


E-Commerce Boom And SKU Proliferation
Explosive SKU counts strain legacy spreadsheets, prompting retailers to centralize product attributes in cloud hubs that syndicate accurate data to web, mobile, and store systems. Shopify merchants handling more than 10,000 SKUs experienced a 23% revenue loss when information was incomplete, a gap closed by automated enrichment and marketplace feeds. Instacart and other quick-commerce operators require sub-hour API updates, so suppliers integrate real-time PIM webhooks to stay listed. AI engines from Akeneo extract attributes from supplier PDFs and translate descriptions, cutting manual effort 60% and shrinking onboarding cycles from weeks to days. Demand peaks in Asia-Pacific, where Lazada and Tokopedia rapidly expand assortments, and in North America, where buy-online-pick-up-in-store programs require synchronized product and inventory views.
Cloud adoption lowering TCO
Enterprises shifting to cloud platforms avoid hardware capital expense, reduce IT head-count, and match operating cost to seasonal volume. Total cost of ownership falls 30-40% within three years by eliminating manual upgrades and by automating security patches. Mid-market firms with fewer than 1,000 employees adopt cloud PIM twice as fast as large peers because subscription tiers and pre-built Shopify or Salesforce connectors compress deployment from 12-18 months on-premise to as little as 12 weeks. Industry templates such as GS1-compliant data models speed integration with suppliers. These benefits drive the 18.50% CAGR in cloud deployments yet raise data-residency and sovereignty questions that vendors mitigate through regional hosting options and ISO 27001 controls.
Omnichannel customer-experience mandates
Modern shoppers expect consistent imagery, specs, and sustainability facts across web, mobile, social, voice, and in-store screens. Retailers therefore merge siloed product, asset, and pricing data into a single PIM that applies channel-specific transformation rules. Voice assistants need concise spoken descriptions, while TikTok Shop demands shoppable video metadata. Embedded digital asset management and rules engines automatically resize images, map attributes, and publish feeds to each endpoint, raising conversion 15-25% and lowering return rates 10-20%. Adoption is widest in North America and Europe, yet Singapore and Seoul demonstrate equally high omnichannel expectations due to mobile-first shopping cultures.
EU Digital Product Passport Compliance
The Ecodesign for Sustainable Products Regulation forces manufacturers selling into Europe to attach machine-readable passports that disclose carbon footprint, material origin, and recyclability for batteries by February 2027 and textiles by 2026. PIM platforms must capture supplier sustainability data, map it to delegated acts, generate GS1 Digital Link QR codes, and retain provenance logs for audits. Exporters in China and Southeast Asia upgrade systems to maintain EU access, creating global spillover demand. Brands such as Pangaia embed NFC tags that link to cloud passports, turning compliance into a circular-economy marketing asset. The regulation therefore adds long-tail growth that extends beyond the forecast horizon.
Restraints Impact Analysis*
| Restraint | (~) % Impact on CAGR Forecast | Geographic Relevance | Impact Timeline |
|---|---|---|---|
| Cybersecurity and Data-Breach Concerns | -1.4% | Global, elevated in Europe and North America | Short term (≤ 2 years) |
| Integration Complexity With Legacy ERPs | -1.2% | Global, most acute in large enterprises | Medium term (2-4 years) |
| Rising ESG Data-Audit Costs | -0.9% | Europe, North America, multinationals | Long term (≥ 4 years) |
| Shortage of PIM-Skilled Data Stewards | -0.8% | Global, notably North America and Europe | Medium term (2-4 years) |
| Source: Mordor Intelligence | |||
Cybersecurity And Data-Breach Concerns
Centralized cloud repositories become attractive to ransomware groups because they store proprietary formulations, prices, and supplier terms. The EUR 1.2 billion GDPR penalty levied on Meta in 2023 underscores potential exposure when data crosses borders without airtight controls. Vendors answer with zero-trust architectures, granular encryption, and optional regional hosting, yet every API link to Shopify, Amazon, or Instagram multiplies the attack surface. Regulated verticals such as banking and pharma demand configurable masking and consent modules, adding deployment friction. The near-term drag is strongest in Europe and North America where disclosure laws force rapid public reporting of breaches.
Integration complexity with legacy ERPs
Most large enterprises still run SAP ECC or Oracle E-Business Suite, systems designed before REST APIs. Custom middleware is often required to synchronize item masters with modern cloud PIMs, and buried customizations can derail projects. Cleaning duplicate records and aligning taxonomy eats 30-40% of implementation budgets. Composable commerce approaches relieve pressure by piloting PIM on one brand or channel, but full real-time bidirectional sync remains challenging until ERP upgrades to S/4HANA or Oracle Cloud mature. The integration hurdle disproportionately slows highly customized manufacturers and global retailers.
*Our forecasts treat driver/restraint impacts as directional, not additive. The impact forecasts reflect baseline growth, mix effects, and variable interactions.
Segment Analysis
By Deployment Model: Cloud Platforms Cement Majority Position
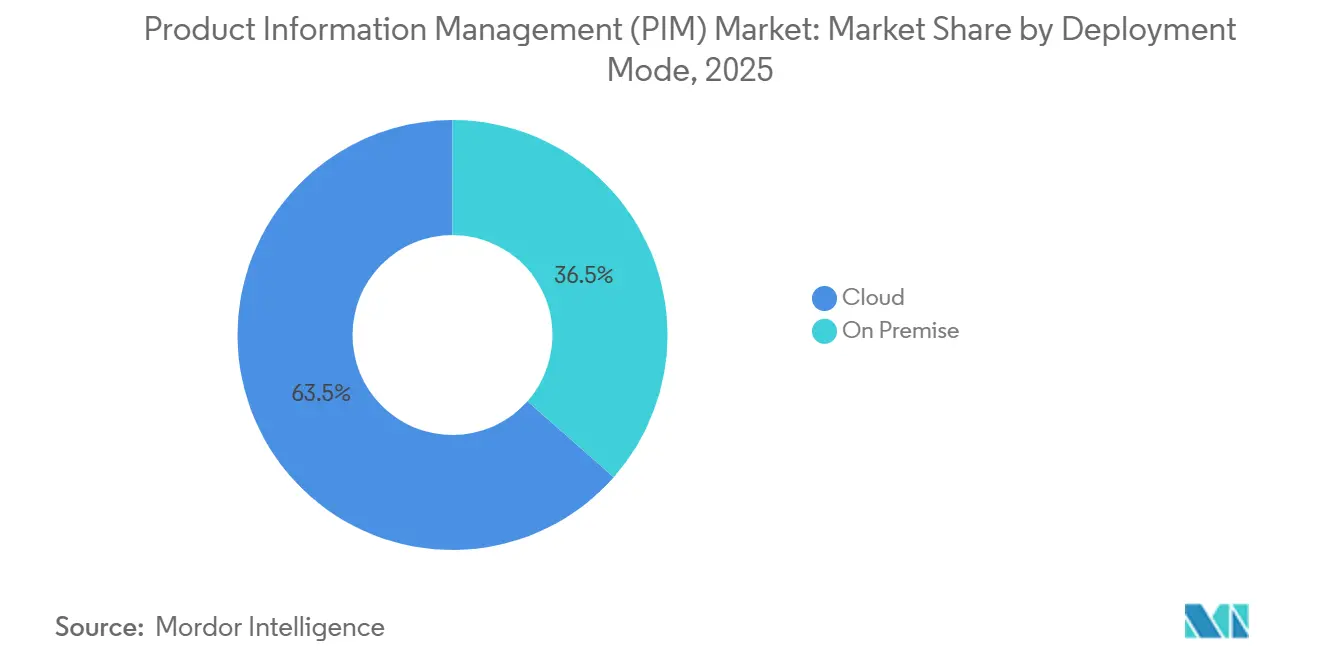
Cloud deployments generated 63.50% revenue share in 2025, outstripping on-premise alternatives through subscription economics and elastic scale that match peak demand around shopping holidays. The Product Information Management market size attributable to cloud solutions is forecast to rise at an 18.50% CAGR, making cloud both the largest and quickest-growing model. Retailers appreciate managed upgrades and 24-hour global availability that support always-on catalog syndication. On-premise share continues to fall because capital expense, extended implementation, and laborious patching no longer match board-level mandates for speed and resilience.
Hybrid configurations persist in pharmaceuticals, aerospace, and defense where data sovereignty or air-gapped networks remain non-negotiable. These firms keep sensitive BOM data on internal servers while leveraging cloud-based enrichment and distribution micro-services. Generative AI modules now bundled with Salsify, Stibo Systems, and Syndigo run more economically at cloud scale, further widening the capability gap. The market story therefore shifts from a binary cloud versus on-premise debate to a continuum in which full SaaS dominates routine use cases while edge deployments serve regulated corners.

By Offering: Services growth reflects implementation complexity
Solutions still delivered 63.14% of Product Information Management market revenue in 2025, covering software subscriptions and license maintenance. However, services - implementation, custom integration, training, and managed operations - are rising at a 23.40% CAGR through 2031, outpacing software itself. Organizations repeatedly underestimate the taxonomy design, data-quality remediation, and stakeholder alignment needed to operationalize PIM. Consulting firms step in to cleanse legacy catalogs, build MuleSoft connectors, and coach category teams on attribute governance. As a result, the Product Information Management market size for services is expanding faster than licenses.
Managed services answer the chronic shortage of PIM data stewards. Brands outsource routine content health checks, marketplace feed monitoring, and compliance audits to specialists for a monthly fee. This outsourcing trend will taper only when low-code workflow builders, AI data-quality bots, and self-service mapping reduce human intervention. Until then, services revenue remains the primary tailwind because Digital Product Passport mandates and omnichannel feeds require ongoing updates rather than one-time projects.
By Organization Size: SMEs Close The Gap
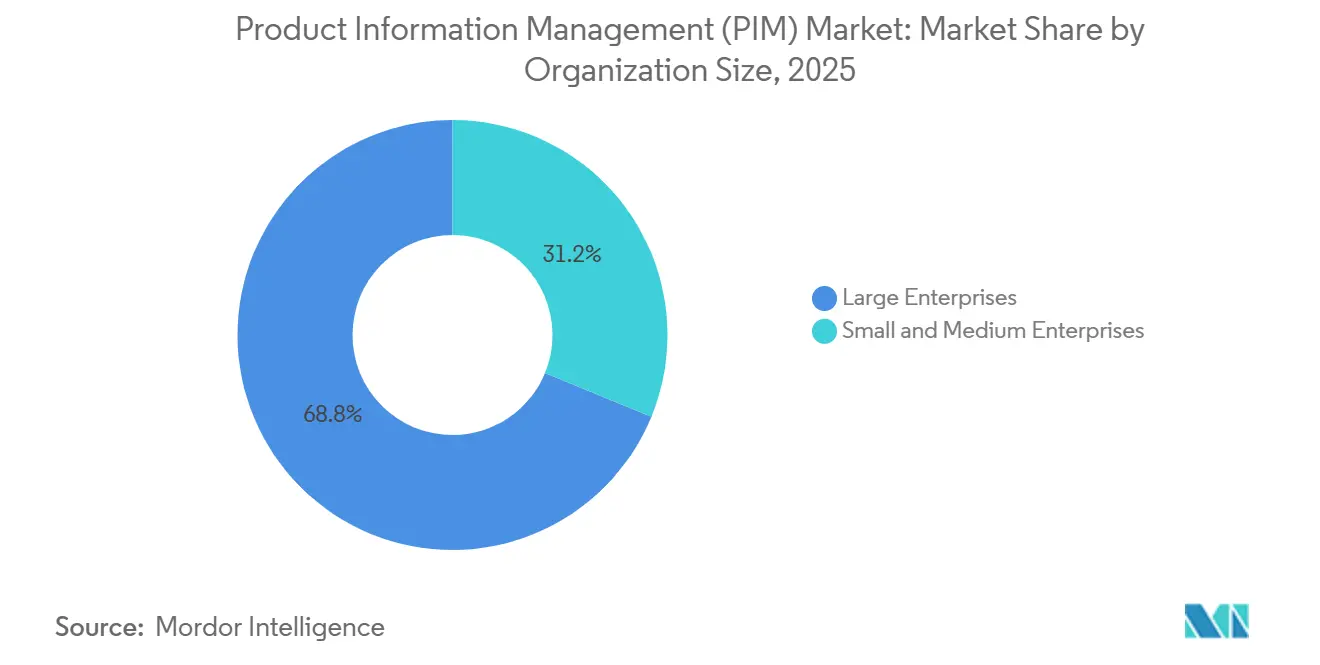
Large enterprises accounted for 68.80% of 2025 spending, reflecting complex product hierarchies that demand deep workflow orchestration and integration. Yet small and medium enterprises are posting an 18.43% CAGR because cloud subscription tiers remove entry barriers, and retailer templates eliminate expensive custom mapping. The Product Information Management market share of SMEs will edge upward as platforms such as Plytix enable non-technical staff to import CSV files, enrich attributes, and push listings to Amazon or Walmart within one browser session.
For conglomerates, generative AI and master data convergence make platform depth more critical than price. Salesforce’s Informatica acquisition demonstrates how top-tier buyers expect unified governance across product, customer, and supplier domains. SMEs, meanwhile, prize fast time-to-value over configurability, gravitating toward opinionated interfaces and guided data-quality wizards. This dichotomy sustains a bifurcated vendor landscape: enterprise suites fight on breadth, while lightweight SaaS firms fight on simplicity and cost.
By End-User Industry: Retail Dominates, Telecom Accelerates
Retail and e-commerce delivered 33.20% of 2025 revenue because conversion, return rates, and search rankings depend directly on high-quality product data. The Product Information Management market size for retail will continue to expand as social commerce and video shopping multiply content variants. IT and telecom, however, post the fastest 19.50% CAGR. Operators launch 5G bundles, IoT device plans, and edge-computing services that demand synchronized catalogs across billing, self-service portals, and API marketplaces. Accurate attribute mapping is critical for automated provisioning and real-time quote-to-cash flows.
Manufacturing adoption follows close behind as configure-price-quote solutions rely on a single source of truth for dimensions, materials, and compliance certificates. Financial services and insurance employ PIM to manage SKU-like offerings—credit cards, mutual funds, policies—under rising disclosure rules. Media companies archive video and music metadata within specialized PIM variants. Each vertical imposes distinct taxonomy and compliance constraints, prompting vendors to release industry accelerators that shrink deployment timelines.
Geography Analysis
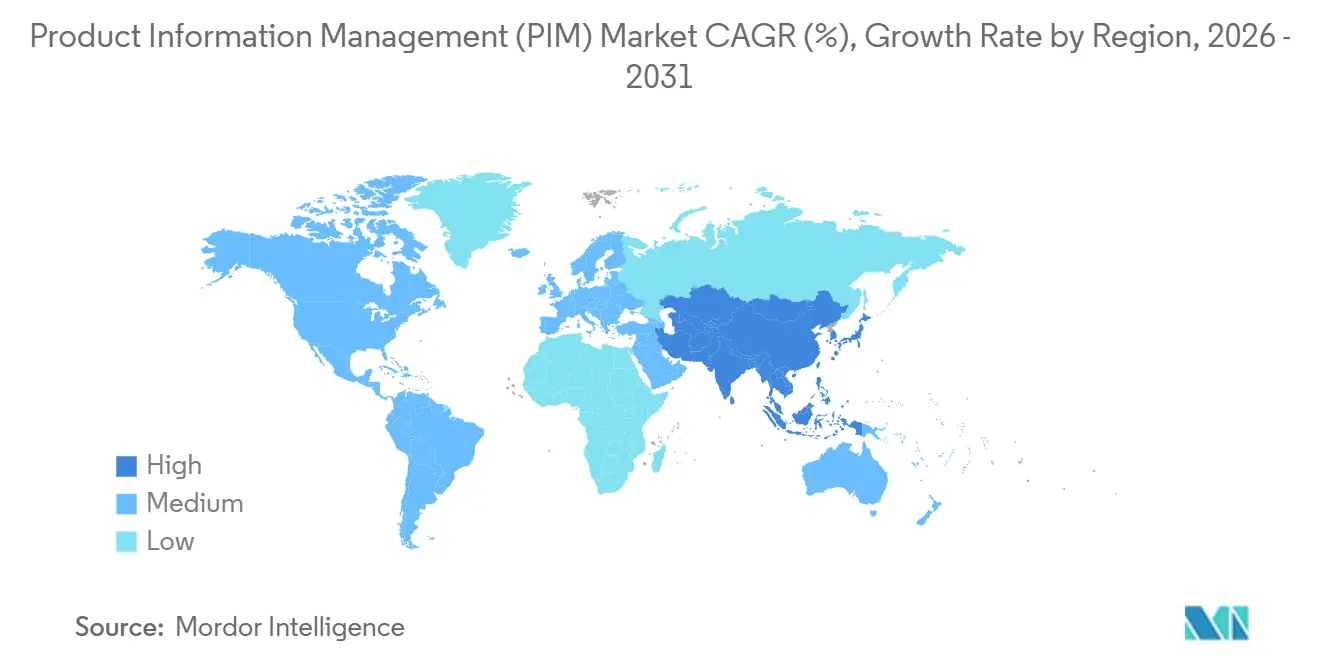
North America contributed 39.80% of global revenue in 2025, buoyed by concentrated retail chains, high digital-adoption rates, and early uptake of master data governance. Many large enterprises completed first-generation PIM rollouts and now upgrade to AI-native versions that generate copy, translate descriptions, and score data quality automatically. Vendor competition intensifies in mid-market tiers, where Shopify-based brands and Amazon third-party sellers demand low-friction onboarding and affordable licenses. U.S. privacy proposals, such as the California Consumer Privacy Act, also increase demand for lineage tracking and consent auditing within PIM workflows.
Asia-Pacific is the growth engine, posting a 20.10% CAGR as China, India, and Southeast Asia digitize trade and payments. GS1 standards integrated into Baidu search improve discoverability while filtering counterfeits, driving manufacturers to structure product data rigorously[2]GS1 China, “Standardized Data in Baidu,” gs1cn.org. India’s Open Network for Digital Commerce sets open catalog formats that small merchants must adopt to participate. Japan and South Korea embed QR codes with recycling instructions to support sustainability goals for an aging population. Language diversity, proprietary schemas on Lazada or Coupang, and varied data-hosting laws compel vendors to deliver multi-tenant, rules-driven transformation logic.
Europe remains compliance-centric. The Corporate Sustainability Reporting Directive and Digital Product Passport scheme force PIM upgrades that add carbon footprint, repairability, and circularity fields. Export-oriented manufacturers in Turkey, Morocco, and Vietnam also modernize to maintain EU access, creating secondary demand pockets. South America’s adoption concentrates in Brazil and Argentina where Mercado Libre and Falabella enforce structured listing rules. The Middle East shows momentum in UAE and Saudi Arabia, catalyzed by state-sponsored e-commerce strategies and fast-growing regional marketplaces. Africa remains nascent but rising smartphone penetration in Nigeria and South Africa signals early green shoots for PIM vendors targeting mobile-first catalogs.

Regulatory Landscape
Regulation affecting product data transparency and sustainability disclosure is a key compliance driver for PIM investments, particularly for companies selling into the European Union. The EU Ecodesign for Sustainable Products Regulation (ESPR) (EU) 2024/1781 entered into force on 18 July 2024 and anchors Digital Product Passport requirements for regulated categories, pushing PIM toward persistent identifiers, machine-readable data, and audit-ready provenance. Directive (EU) 2024/825 sets a member state transposition deadline of 27 March 2026, with rules applying from 27 September 2026, which increases pressure on enterprises to maintain consistent and supportable product claims and consumer-facing product information across channels.
Standards bodies also shape interoperability expectations that flow into PIM data models and integrations. ISO updates in 2024 to the ISO 10303 series (including ISO/TS 10303-1231:2024, ISO/TS 10303-1292:2024, and ISO 10303-239:2024) reinforce structured approaches to product data representation, versioning, and lifecycle information, supporting regulated use cases where traceability and controlled change management matter. As these requirements converge, PIM platforms increasingly need governance features (version control, lineage logs, role-based access, and data exchange in open formats) rather than functioning only as a merchandising content repository.
Value Chain Analysis
The PIM value chain begins with upstream data creation and capture, where manufacturers and brand owners gather inputs from internal systems (ERP, PLM, pricing, DAM) and from external parties such as raw material suppliers, contract manufacturers, and distributors. This intake stage concentrates the most friction, including inconsistent taxonomies, missing attributes, and variable data quality across supplier feeds, spreadsheets, and PDFs. PIM platforms standardize formats, validate completeness, enrich content, and manage workflows across product teams, while implementation partners and system integrators build connectors and governance processes to synchronize PIM with legacy ERPs and commerce stacks.
Downstream, PIM distributes approved product data to sales and engagement endpoints, including retailer networks, marketplaces, D2C storefronts, social commerce, catalogs, and customer service and field service tools that depend on accurate specifications. Digital Product Passport requirements extend the downstream chain beyond marketing syndication into compliance disclosure, linking PIM to sustainability data capture and supplier attestations across manufacturers, wholesalers, and retailers. As a result, more value shifts to vendors and service providers that support multi-endpoint syndication, rules-driven transformations, and auditable data lineage, with SaaS delivery models increasingly favored for rapid onboarding, frequent updates, and centralized policy enforcement across geographies.
Competitive Landscape
The top five vendors command roughly 35-40% combined revenue, reflecting moderate concentration. Syndigo’s September 2025 purchase of 1WorldSync for an enterprise value above USD 3.5 billion and Salesforce’s USD 8 billion takeover of Informatica underscore an accelerating pivot toward composable data fabrics that encompass PIM, master data management, and AI-powered content optimization. These deals heighten entry barriers for pure-play PIM start-ups because buyers now expect governance, lineage, and omnichannel feeds in a single invoice.
Strategic alliances supplement M&A. Syndigo partnered with Productsup in February 2025 to link syndication networks with global feed management, expanding retailer reach beyond 3,500 endpoints[3]Syndigo, “Acquisition of 1WorldSync,” syndigo.com. Adobe positions Experience Manager Assets as a PIM-adjacent platform that layers AI metadata tagging over digital asset repositories, targeting brand marketers who already use Adobe Creative Cloud. Open-source alternatives like Akeneo and Pimcore win projects where enterprises want code-level customization and to avoid subscription escalation.
White-space opportunities surface in vertical-specific niches. Pharmaceutical vendors need structured dosage and interaction data, while automotive aftermarket catalogs require compatibility matrices covering millions of part-vehicle combinations. Foodservice distributors track allergens and nutrition for regulatory menus. Agentic AI inside PIM is a frontier technology: autonomous bots detect missing attributes, recommend improvements based on marketplace analytics, and execute fixes. Vendors that master agent workflows may leapfrog rivals in both efficiency and differentiation.
Product Information Management (PIM) Industry Leaders
SAP SE
IBM Corp.
Oracle Corp.
Informatica LLC
Akeneo SAS
- *Disclaimer: Major Players sorted in no particular order

Market Opportunities and Future Outlook
Suite consolidation and tighter coupling between PIM and digital experience stacks are creating a clear whitespace for enterprises weighing independent PIM roadmaps versus bundled platform strategies. Adobe signed a definitive agreement in June 2026 to acquire Akeneo for USD 340 million, highlighting how large experience vendors are moving to close product-data gaps inside broader commerce and content ecosystems and raising the premium on interoperability and migration services for customers running mixed stacks. In parallel, buyers are tightening vendor selection around platform completeness and execution, evidenced by ISG publishing its 2026 PIM Platforms Buyers Guide and naming Overall Leaders such as Salesforce, Stibo Systems, and Akeneo, which increases competitive pressure on mid-tier and niche providers to differentiate through vertical accelerators, faster integrations, and deeper governance.
A second opportunity area is operationalizing agentic and AI-assisted product content workflows with higher transparency and control, particularly where catalogs change rapidly and where compliance fields must be maintained continuously. Akeneo introducing an agentic product experience platform in July 2026, alongside releases from vendors emphasizing AI-led onboarding, enrichment, and workflow orchestration, indicates active productization of autonomous enrichment and orchestration beyond pilot deployments. Enterprises seeking to reduce manual content operations can extend PIM into repeatable, governed pipelines by combining confidence scoring, source tracking, and approval workflows with connectors into ERP and marketplace endpoints, while regulated exporters can use the same governance spine to support Digital Product Passport-style disclosures and audit readiness across suppliers and regions.
Recent Industry Developments
- July 2026: Akeneo announced its Summer Release, introducing Agentic Ziggy as an agentic UI layer within the Akeneo Product Cloud to orchestrate autonomous enrichment and product data operations. The release reinforces the market shift from PIM as a system of record toward AI-driven execution layers, raising competitive intensity around governance, transparency, and control of automated changes.
- November 2025: Salesforce completed its acquisition of Informatica for about USD 8 billion, bringing cloud data management and governance deeper into Salesforce platforms. The move tightened the linkage between customer-facing workflows and enterprise-grade data foundations, influencing PIM buying criteria toward integrated data governance and master data capabilities.
- September 2024: ISO refreshed multiple ISO 10303 standards in 2024 (including ISO/TS 10303-1231:2024, ISO/TS 10303-1292:2024, and ISO 10303-239:2024) that support structured product data representation, versioning, and lifecycle management. These updates support PIM implementations that can manage controlled changes, interoperability, and audit-ready product data across complex value chains.


Research Methodology Framework and Report Scope
Market Definition and Coverage
For this study, the market includes revenues earned from product information management platforms and related services used to create, enrich, govern, and publish product content consistently across sales and marketing channels, including digital commerce and partner catalogs.
Scope exclusions: Excludes broad enterprise data-management suites where product data is only one of many records managed and the PIM workflow is not the primary sold use case.
Segmentation Overview
- By Deployment Model
- Cloud
- On-Premise
- By Offering
- Solutions
- Services
- By Organization Size
- Large Enterprises
- Small and Medium Enterprises (SMEs)
- By End-User Industry
- Retail and E-commerce
- BFSI
- Manufacturing
- Media and Entertainment
- IT and Telecom
- Other End-User Industries
- By Geography
- North America
- United States
- Canada
- Mexico
- Europe
- Germany
- United Kingdom
- France
- Italy
- Spain
- Russia
- Rest of Europe
- Asia-Pacific
- China
- Japan
- India
- South Korea
- Australia
- Rest of Asia-Pacific
- Middle East
- Saudi Arabia
- United Arab Emirates
- Turkey
- Rest of Middle East
- Africa
- South Africa
- Nigeria
- Rest of Africa
- South America
- Brazil
- Argentina
- Rest of South America
- North America
Data Sources, Market Sizing, and Validation
Desk Research
Desk research was used to frame the demand environment and to anchor a few measurable indicators that matter for PIM adoption, before assumptions were tested in fieldwork. We referenced public sources such as the US Census Bureau retail and e-commerce statistics, Eurostat digital economy indicators, OECD ICT and business statistics, and UN Comtrade trade flows for related IT goods, which help explain where digital catalog complexity is rising.
We also reviewed company annual reports and investor presentations for product-led software vendors and systems integrators to understand revenue mix language, pricing posture, and regional exposure patterns. Industry association publications and reputable technology press were used to track policy changes around data governance and product labeling, which can shift budget allocation decisions. Where needed, analyst access to paid subscriptions for company financials and intelligence, news and financials, and patent databases helped cross-check timelines and product positioning. These desk sources are illustrative, and many other public references were also used for validation and clarification during the work.
Primary Interviews and Surveys
Primary work relied on structured expert interviews and light surveys with PIM platform teams, implementation partners, and enterprise users who run product catalogs across retail, manufacturing, and distribution. We used these discussions to confirm typical subscription and services splits, cloud versus on-premises migration pace, and the practical triggers behind new deployments in APAC, EMEA, and the Americas.
Distribution of primary research fieldwork respondents
| Company type | Respondent position | Region |
|---|---|---|
| Top tier: 28% | CXOs: 12% | APAC: 42% |
| Mid tier: 58% | Functional/Unit leaders: 38% | EMEA: 32% |
| Smaller Players: 14% | Managers: 50% | Americas: 26% |
Market-Sizing & Forecasting
Sizing starts from a top-down reconstruction of the addressable spend pool for PIM, where regional enterprise software spend and digital commerce expansion are used to narrow into the share that typically flows to product content centralization and syndication needs. Those totals are then corroborated with selective bottom-up approximations, like sampled vendor revenue disclosures, channel checks with integrators, and an ASP times volume view for subscriptions and services, so the final number stays realistic when single inputs look stretched.
Inputs used in the model include cloud versus on-premises mix shifts, the share of services attached to new deployments, average contract term patterns, and the pace of product catalog expansion across industries with high SKU churn. We also track adoption pull from retail and e-commerce, and cross-border catalog publishing needs that show up in marketplace and partner channel growth. Forecasting is done using scenario analysis supported by a light multivariate regression, where key drivers like cloud migration pace, digital commerce growth, and services attach rates are stress-tested with what interviewees expect over the next few years. When bottom-up data is missing for smaller suppliers, gaps are handled through conservative peer benchmarking by region and by typical customer size, and then checked again in validation calls.
Data Validation & Update Cycle
Results are validated by comparing model outputs against independent signals, such as regional enterprise software spending direction, hiring and project activity for PIM-related roles, and stated growth rates from public financial disclosures. If a region or end-user view diverges sharply from these signals, the drivers are revisited and we re-contact sources to confirm whether the shift is real or just a timing effect.
A multi-step review is followed before sign-off, including logic checks on mix assumptions and year-over-year variance checks on the main inputs. The report is refreshed annually, and interim updates are made when material events occur, such as major regulation changes, large platform launches, or visible pricing shifts. Before delivery, a final analyst pass is completed so clients receive a current view rather than an older snapshot.
Mordor Intelligence's Product Information Management Market Size Versus Other Published Estimates
Published PIM market figures can look far apart because each publisher defines what counts as PIM, sets a different base year, and applies different assumptions for cloud migration and services growth. Currency timing and whether values are reported as vendor revenue or broader spending can add another layer of spread.
Full enterprise master data platforms, when sold mainly for customer, supplier, and finance records, sit outside Mordor Intelligence's scope even if they include a product data module, which can reduce the total versus estimates that bundle adjacent data-management categories. Other gaps usually come from how services are counted, since some sources include large consulting and ongoing managed services more broadly, and from how fast ASPs are assumed to rise for cloud subscriptions over the forecast window.
Benchmark comparison
| Source | Market Size | Gaps in Research Methodology |
|---|---|---|
| Mordor Intelligence | USD 19.95 B (2026) | |
| Industry Research Publisher A | USD 14.21 B (2024) | Uses an earlier base year and a component view that can understate later-year cloud acceleration and services attach rates, which tends to keep the near-term total smaller versus a 2026 base. |
| Industry Research Publisher B | USD 13.38 B (2024) | Applies a longer forecast window with a lower stated CAGR and includes a broad application and deployment taxonomy that can dilute the core PIM revenue focus, leading to lower midpoint-year values when normalized. |
Across the three figures, the main driver is not the math, it is the definition and the year used for the starting point. By keeping the model tied to a clear PIM spend pool and checking it with subscription mix and services signals, we end up with a number that is easier to trace back to repeatable inputs.


Key Questions Answered in the Report
What is the 2026 value of the Product Information Management market?
The market is valued at USD 19.95 billion in 2026.
How fast will the market grow between 2026 and 2031?
It is forecast to expand at a 13.38% CAGR, reaching USD 37.39 billion by 2031.
Which deployment model holds the largest share?
Cloud platforms led with 63.50% share in 2025 and are projected to remain dominant.
Which end-user segment is expanding the fastest?
IT and telecom posts the highest 19.50% CAGR as operators digitize 5G and edge-computing catalogs.
Page last updated on:






