
Procurement Analytics Market Size and Share
Market Overview
| Study Period | 2020 - 2031 |
|---|---|
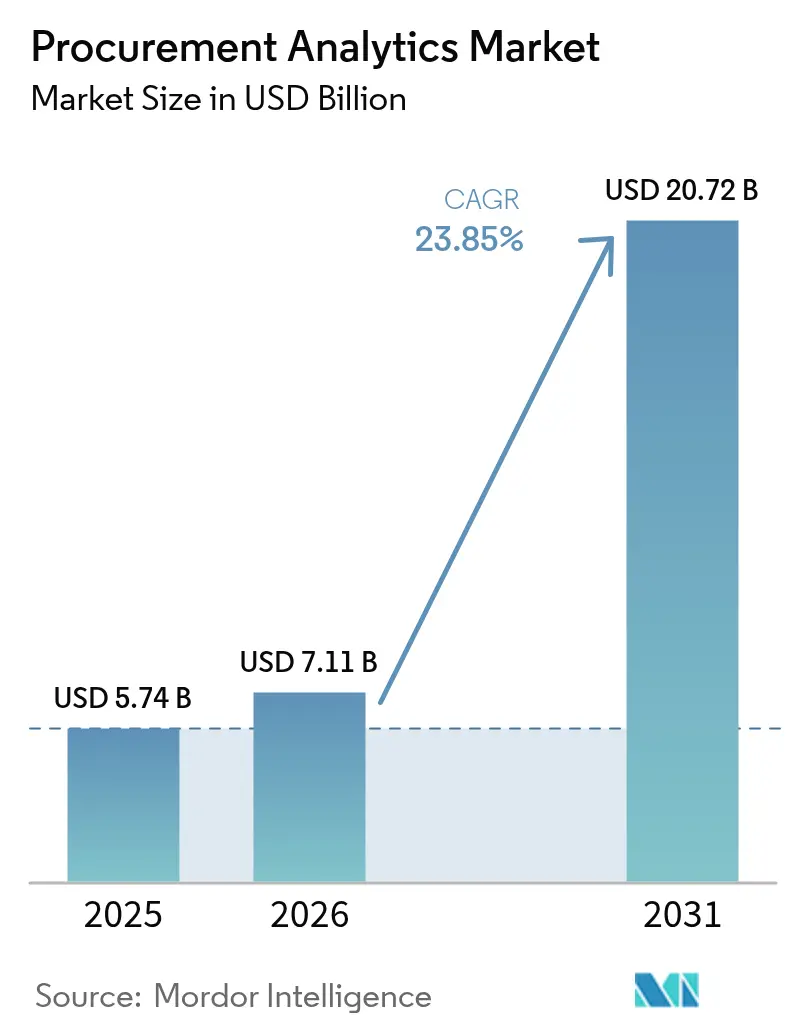
| Market Size (2026) | USD 7.11 Billion |
| Market Size (2031) | USD 20.72 Billion |
| Growth Rate (2026 - 2031) | 23.85 % |
| Fastest Growing Market | Asia Pacific |
| Largest Market | North America |
| Market Concentration | Medium |
Major Players *Disclaimer: Major Players sorted in no particular order Image © Mordor Intelligence. Reuse requires attribution under CC BY 4.0. | |
Procurement Analytics Market Analysis by Mordor Intelligence
Procurement Analytics market size in 2026 is estimated at USD 7.11 billion, growing from 2025 value of USD 5.74 billion with 2031 projections showing USD 20.72 billion, growing at 23.85% CAGR over 2026-2031. Rapid cloud migration, the infusion of generative AI into source-to-pay workflows, and heightened attention to supply-chain resilience underpin the expansion of the procurement analytics market. Enterprises continue to replace disconnected legacy tools with unified analytics suites that elevate spend visibility, improve supplier performance, and automate tactical buying. Software remains the principal revenue generator, yet the steepest growth is shifting to services as organizations seek specialized expertise to integrate multi-tenant platforms with complex ERP landscapes. Adoption is accelerating among small and medium enterprises, whose cloud-native deployments bypass capital-intensive infrastructure while delivering enterprise-grade capabilities. Intensifying regulations—especially around ESG compliance and data sovereignty—are reshaping deployment decisions and prompting vendors to expand local hosting footprints.
Key Report Takeaways
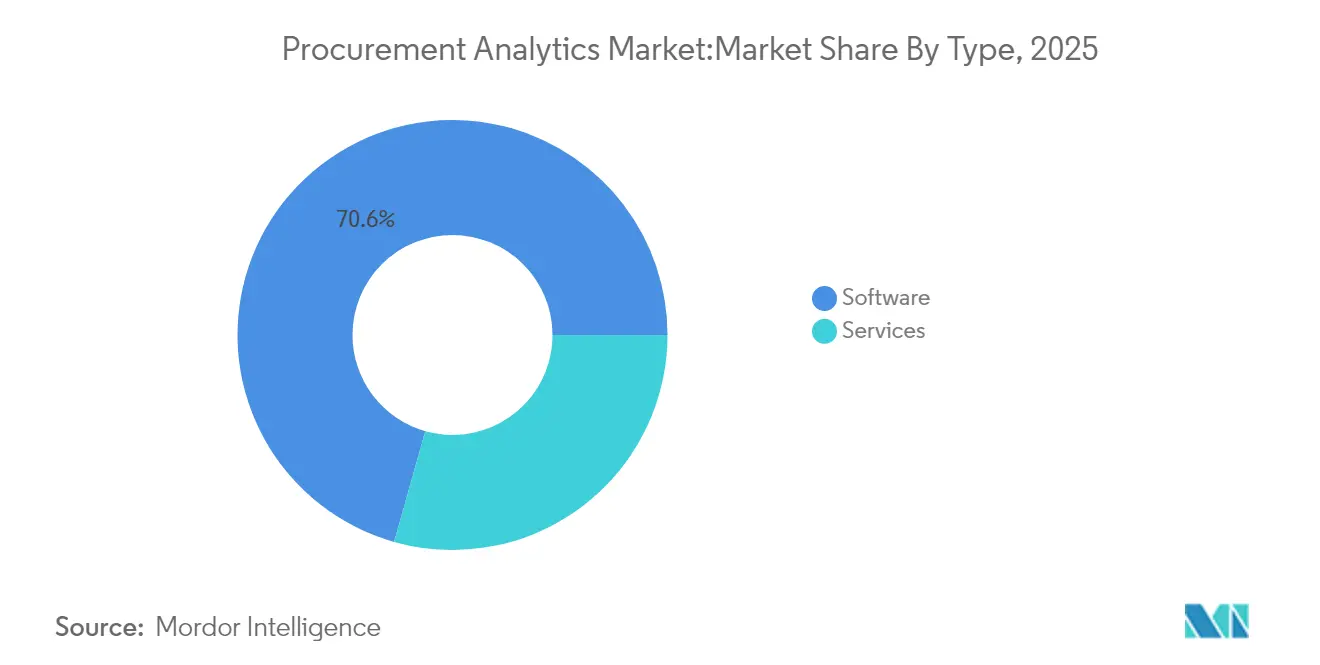
- By type, software held 70.62% of the procurement analytics market share in 2025, whereas services are projected to accelerate at 26.45% CAGR through 2031.
- By deployment, cloud models accounted for 64.35% of the procurement analytics market size in 2025 and will expand at a 25.15% CAGR to 2031.
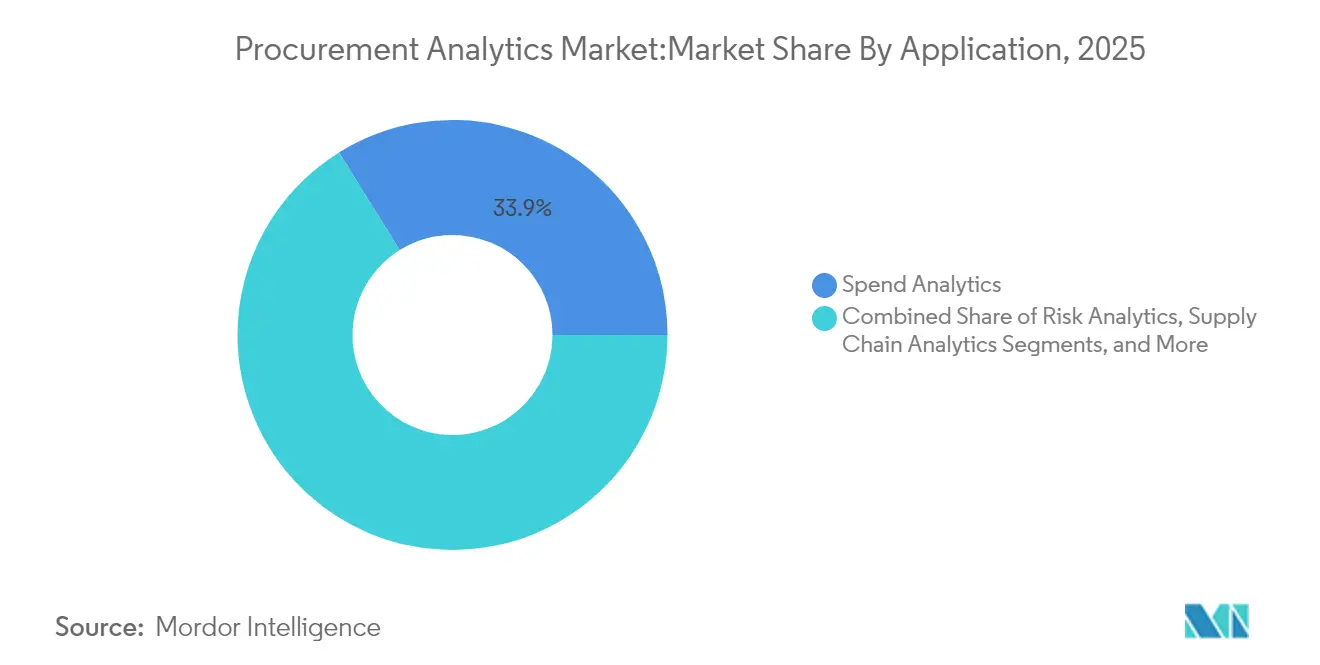
- By application, spend analytics led with 33.85% revenue share in 2025, while risk analytics is poised for the fastest 25.95% CAGR through 2031.
- By end-user industry, manufacturing commanded 26.74% of 2025 revenue; healthcare and life sciences is forecast to rise at a 25.80% CAGR to 2031.
- By organization size, large enterprises contributed 63.72% of 2025 revenue, though SME adoption is climbing at 26.70% CAGR.
- By geography, North America captured 36.95% of 2025 revenue; Asia-Pacific is the fastest-growing region at 26.10% CAGR.
Note: Market size and forecast figures in this report are generated using Mordor Intelligence’s proprietary estimation framework, updated with the latest available data and insights as of 2026.
Market Trends and Insights
Drivers Impact Analysis of Procurement Analytics Market*
| Driver | (~) % Impact on CAGR Forecast | Geographic Relevance | Impact Timeline |
|---|---|---|---|
| SaaS-first procurement-suite road-maps | +4.2% | Global; early uptake in North America and EU | Medium term (2-4 years) |
| Generative-AI copilots embedded in source-to-pay | +5.8% | North America and EU core; expanding to APAC | Short term (≤ 2 years) |
| Cloud-native TCO economics for mid-market buyers | +3.1% | Global; strong in APAC | Medium term (2-4 years) |
| ESG-linked supplier scoring mandates | +2.9% | EU and North America; expanding globally | Long term (≥ 4 years) |
| Predictive risk analytics for near-shoring strategies | +4.5% | Global; manufacturing hubs | Medium term (2-4 years) |
| Autonomous purchasing bots for tail-spend | +3.7% | North America and EU early adopters | Short term (≤ 2 years) |
| Source: Mordor Intelligence | |||
SaaS-first procurement-suite road-maps
Companies are retiring fragmented on-premise tools in favor of unified, cloud-native suites that scale on demand, enable organization-wide spend visibility, and accelerate analytics roll-out schedules. Adoption momentum is most evident among mid-market firms that lacked the capital for enterprise-grade infrastructure, yet now benefit from subscription pricing and automated updates. Once operational, these platforms consolidate disparate data sources, laying the groundwork for machine-learning models that optimize sourcing events and monitor compliance in real time. Vendors that bundle prebuilt connectors and low-code interfaces are gaining an edge because they shorten time-to-value and minimize reliance on scarce integration talent.
Generative-AI copilots embedded in source-to-pay
Generative AI modules embedded inside requisition, contract, and supplier-performance workflows are transforming procurement from reactive to insight-led operations. Fortune-500 adopters report double-digit cuts in processing time after letting AI draft sourcing documents, classify open-text spend, and surface negotiation levers. [1] Nevertheless, only a minority of enterprises allow unrestricted model access because sensitive commercial data requires rigorous governance. Vendors are responding by shipping policy-based access controls, localized language models, and in-platform redaction features that satisfy data-protection officers without stalling innovation.
Cloud-native TCO economics for mid-market buyers
Multi-tenant architectures erase capital outlays for hardware, routine maintenance, and disaster-recovery tooling. Mid-sized manufacturers using cloud suites report double-digit productivity gains and smoother upgrade cycles that free IT staff for value-added analytics projects. Enhanced elasticity also permits organizations to spin up sandboxed environments for AI model training without disrupting business-critical workloads, further lowering experimentation barriers.
ESG-linked supplier scoring mandates
Europe’s Supply Chain Due Diligence Directive and similar statutes in the United States are forcing buyers to embed environmental and social metrics into supplier evaluations. Platforms that integrate real-time emissions dashboards and diversity benchmarks are seeing uptake as procurement teams tie contract award criteria to carbon-footprint thresholds. [2] Early adopters report tangible payoffs, including reduced risk of regulatory penalties and greater brand preference among sustainability-minded customers.
Restraints Impact Analysis of Procurement Analytics Market*
| Restraint | (~) % Impact on CAGR Forecast | Geographic Relevance | Impact Timeline |
|---|---|---|---|
| Shortage of procurement-data engineers | −2.8% | Global; acute in North America and EU | Short term (≤ 2 years) |
| “Shadow IT” spend outside ERP integration | −1.9% | Global; higher in decentralized firms | Medium term (2-4 years) |
| Data-sovereignty regulations limiting cross-border hosting | −1.4% | EU and APAC; spreading globally | Long term (≥ 4 years) |
| Multi-tenant cost models pressured by Gen-AI GPU pricing | −1.1% | Global cloud deployments | Short term (≤ 2 years) |
| Source: Mordor Intelligence | |||
Shortage of procurement-data engineers
Fifty-eight percent of enterprises struggle to recruit analytics talent who grasp both data-engineering principles and category-management nuances. The scarcity inflates wage bills and prolongs deployment cycles as over-extended teams juggle cleansing, normalization, and model-maintenance tasks. Some firms offset the gap by adopting low-code data-pipelines or outsourcing model-build projects to vendors, yet knowledge transfer remains a persistent bottleneck.
“Shadow IT” spend outside ERP integration
On average, enterprises run more than 1,000 cloud services, only a tenth of which are visible to central IT. Unregistered tools fracture spend data, hampering the end-to-end view that procurement analytics market solutions need to detect savings opportunities or policy violations. Education campaigns, sanctioned app-stores, and modern API hubs are emerging as preferred countermeasures, but governance programs still trail adoption velocity.
*Our forecasts treat driver/restraint impacts as directional, not additive. The impact forecasts reflect baseline growth, mix effects, and variable interactions.
Procurement Analytics Market Segment Analysis
By Type:
Services capture accelerating demandServices held a comparatively small revenue base but are rising at 26.45% CAGR, outpacing platform growth as enterprises acknowledge that skilled implementation drives sustained outcomes. Advisory teams perform data-model tuning, supplier onboarding, and change-management workshops that customers cannot replicate internally. Johnson Controls’ global roll-out, which linked 800 suppliers across 14 plants, underscored the scale of integration work required. The procurement analytics market size for services is therefore projected to expand rapidly, even though software retains a 70.62% share. As enterprises mature, they migrate from standalone modules to integrated suites that share master data and analytics, reinforcing network effects within the procurement software market. Cross-training initiatives, best-practice libraries, and outcome-based pricing models are further boosting service uptake by aligning fees with realized savings. Platform providers continue reinforcing self-service configuration wizards, yet growing data-quality expectations keep professional services in demand. Vendors with embedded advisory arms can monetize both license and services streams, while pure-play consultancies specialize in complex ERP co-existence or multi-lingual supplier-enablement campaigns. As platform functionality standardizes, differentiation tilts toward implementation accelerators and domain-specific playbooks that cut time-to-value.

By Deployment:
Cloud leadership intensifiesCloud accounts for 64.35% of 2025 revenue, confirming its status as the dominant delivery model for the procurement analytics market. The economics improve when factoring in avoided hardware refreshes, automated patching, and usage-based scaling. Weinor’s adoption of a cloud suite trimmed requisition cycle times by up to 41%, equating to a full-time employee’s productivity gain. On-premise persists in regulated verticals that mandate local data residency, but even these buyers favor hybrid models that host sensitive records in private clouds while consuming AI engines from public clouds.Edge-ready architecture is emerging as a differentiator, enabling near-real-time analytics at factory sites with intermittent connectivity. Vendors that pre-certify with hyperscalers and colocation providers accelerate customer deployments while satisfying sovereignty constraints. Consequently, the procurement analytics market share of cloud deployments is set to widen further as smaller firms leapfrog on-premise generations altogether.
By Application:
Risk analytics outpaces foundational spend analyticsSpend analytics remains the cornerstone, but the procurement analytics market size attributable to risk analytics is climbing fastest at 25.95% CAGR. The spike follows an uptick in disruptions ranging from raw-material shortages to geopolitical trade shifts, which exposed the limitations of rear-view dashboards. Platforms now ingest shipment trackers, macro-economic indicators, and supplier-financial scores to flag potential bottlenecks before they affect production. Semiconductor, medical-device, and food manufacturers increasingly rely on predictive alerts to justify buffer-stock or near-shoring strategies.Contract-lifecycle, supplier-performance, and demand-forecasting modules continue to expand in tandem, as organizations prefer suites that share a common data model. Vendors emphasize configurable risk-scoring engines so customers can weigh factors such as ESG performance or cyber-resilience alongside traditional lead-time metrics.
By End-user Industry:
Healthcare accelerates, manufacturing dominatesManufacturing held a 26.74% revenue share in 2025, leveraging analytics to orchestrate multi-tier supply chains and navigate volatile commodity pricing. Healthcare and life-sciences, however, is the standout growth engine at 25.80% CAGR, driven by stringent compliance reporting and pressure to lower procedure costs. Banner Health trimmed USD 3.2 million from surgical supplies by standardizing preference cards on an analytics platform. Similar momentum is unfolding in pharmaceuticals, where analytics track validated suppliers and monitor cold-chain integrity.Energy, transportation, and retail segments also intensify investment to counter inflation and boost ESG transparency. Multiple industries converge on one theme: analytics now influence not just unit price negotiations but broader resilience strategies, including dual-sourcing and capacity-buffer orchestration.
By Organization Size:
SMEs embrace cloud-native simplicityLarge enterprises supplied 63.72% of 2025 revenue, yet SME subscriptions are growing at 26.70% CAGR as vendors roll out pay-as-you-grow tiers. Cloud deployment lowers the skill threshold, allowing lean teams to obtain AI-driven insights previously restricted to corporations with dedicated data-science groups. Provisur Technologies’ 20% spend reduction illustrates the magnitude of gains achievable when mid-market firms implement guided-sourcing analytics. To sustain traction, suppliers bundle pre-mapped commodity taxonomy, mobile approval workflows, and user-experience designs tuned for generalists.
Geography Analysis
North America, APAC and Europe Procurement Analytics Market
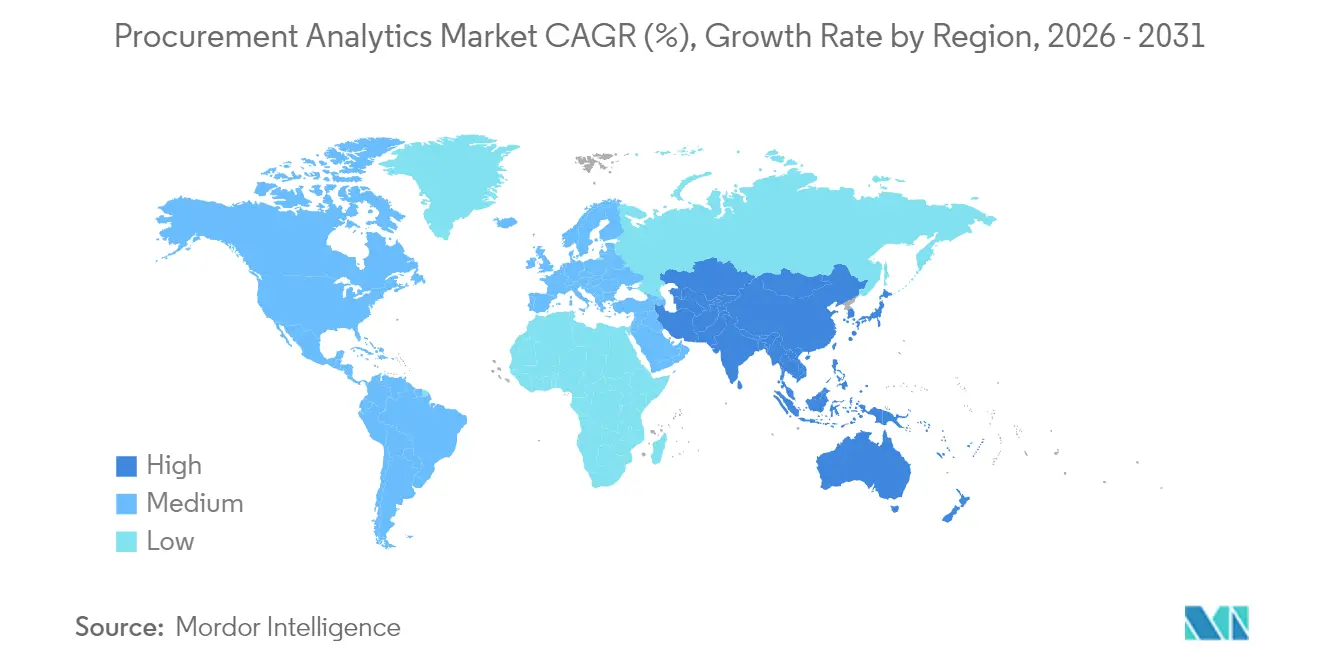
North America led the procurement analytics market with 36.95% revenue in 2025. Mature cloud infrastructure, a dense ecosystem of specialized service providers, and continued tariff uncertainty encourage enterprises to invest in real-time cost-modeling engines. Universities and utilities confirm that more than 60% of their suppliers express tariff-related concerns, pushing buyers to deploy scenario-planning dashboards. Federal incentives for reshoring critical materials add another dimension, requiring analytics that integrate subsidy tracking and local-content thresholds.Asia-Pacific delivers 26.10% CAGR due to manufacturing-led digitization and supportive e-governance programs. Asia-Pacific posts the fastest growth. Government-led manufacturing 4.0 grants in China and South-East Asia subsidize automation that pairs machine-data streams with procurement KPIs. Multinational OEMs locate sourcing centers in Singapore to tap its cloud-first regulations, then extend shared services across ASEAN plants. Japanese conglomerates, historically cautious about public-cloud workloads, are adopting sovereign-cloud zones that satisfy domestic privacy statutes while enabling AI model training on multi-year purchasing archives.Europe ranks close behind North America in absolute spend. ESG compliance drives analytics to the boardroom, where supply-chain transparency becomes as strategic as price savings. France’s digital-sovereignty charter propels demand for regionally hosted suites, while the United Kingdom’s post-Brexit customs landscape amplifies the need for harmonized tariff-classification tools. Eastern European manufacturers, aiming to capture near-shoring contracts, invest in risk-analytics modules that quantify geopolitical exposure and logistics lead-time variability.
Regulatory Landscape
Regulation is increasingly shaping how procurement analytics platforms address AI governance, data protection, and supplier-risk controls for both public and private buyers. In the EU, the EU AI Act (effective August 2025) has pushed transparency and risk-management requirements into tender specifications for AI-enabled analytics, reinforced by updated EU model contractual clauses for AI used in procurement. Cybersecurity-focused regimes such as NIS2 (from October 2024) also lift baseline supplier security expectations, which increases demand for auditable controls, monitoring, and evidence trails inside source-to-pay workflows.
In the United States and the United Kingdom, government procurement rules are tightening expectations around data safeguarding and critical supplier oversight. In June 2026, the US General Services Administration proposed a GSAR clause (552.239-7001) focused on safeguarding government data within Large Language Model systems used in federal procurement, affecting how analytics vendors design and govern GenAI features for public buyers. In the UK, the Telecommunications Security Act framework is supported by the 2026 Telecommunications Security Code of Practice, which raises procurement and third-party supplier assurance for critical networks and influences analytics needs around vendor risk scoring, evidence management, and compliance reporting.
Value Chain Analysis
The procurement analytics value chain begins with data generation and ingestion from ERP and source-to-pay systems (requisitions, POs, invoices, contracts), supplier master data, and external risk signals (trade and regulatory updates, supplier financials, logistics indicators). Vendors then provide data engineering (cleansing, normalization, taxonomy mapping), analytics and AI layers (classification, anomaly detection, risk scoring, forecasting), and workflow applications that embed insights into sourcing, contracting, and supplier performance management. Systems integrators and consultancies handle implementation, change management, and ongoing model tuning, which is a key monetization path as enterprises connect multi-tenant suites to complex ERP landscapes.
Downstream, cloud marketplaces and enterprise platform ecosystems accelerate distribution and deployment, while managed procurement offerings are emerging as another route to market. For example, Vodafone launched expanded Managed Procurement Services to external businesses in May 2026, commercializing its procurement ecosystem and supplier network, which increases demand for analytics that can operate across multi-client environments with strong governance. Supplier-risk intelligence providers also form an important layer, illustrated by Exiger being selected in May 2026 by Vodafone Telenor Procurement Company to support AI-driven supplier risk intelligence, showing how specialized risk data and third-party risk management capabilities plug into procurement analytics stacks.
Competitive Landscape
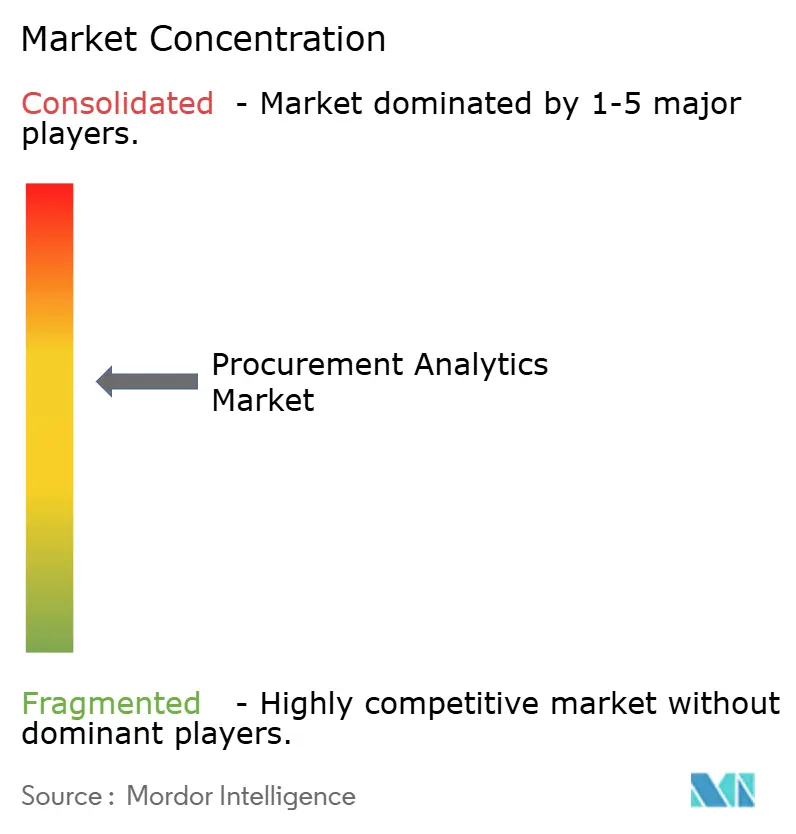
The procurement analytics market remains moderately fragmented. ERP giants SAP, Oracle, and IBM leverage cross-selling access to large installed bases, bundling analytics into enterprise subscriptions that promise single-vendor simplicity. Best-of-breed vendors such as Coupa, Zycus, Jaggaer, and Sievo compete on rapid innovation cycles and vertical feature depth. Sievo’s in-platform AI assistant, for instance, auto-categorizes long-tail spend and recommends consolidation options.
Funding momentum signals continued disruption: LightSource secured USD 33 million to expand a supply-chain software suite designed to model tariff scenarios for US importers. Partnerships also matter. Johnson Controls and LeanDNA jointly built a digital thread spanning 800 suppliers, evidencing how integration specialists augment platform capabilities.
While consolidation activity intensifies as incumbents acquire AI startups to fast-track roadmap gaps, pure-play challengers differentiate through intuitive UX, preconfigured metrics, and industry-specific content packs. Data-sovereignty pressures compel all vendors to extend regional hosting and bring-your-own-key encryption, adding infrastructure complexity that favors scale players but allows niche providers to win in regulated pockets.
Procurement Analytics Industry Leaders
-
SAP SE
-
Oracle Corporation
-
IBM Corporation
-
SAS Institute Inc.
-
Coupa Software Inc.
- *Disclaimer: Major Players sorted in no particular order
Procurement Analytics Market Companies Covered in this Report
- SAP SE
- Oracle Corporation
- IBM Corporation
- SAS Institute Inc.
- Coupa Software Inc.
- Zycus Inc.
- Jaggaer LLC
- GEP Worldwide LLC
- Ivalua Inc.
- Basware Oyj
- Sievo Oy
- SpendHQ LLC
- Proactis Holdings PLC
- Rosslyn Data Technologies PLC
- Simfoni Analytics Ltd.
- Spendscape by McKinsey
- Bridgei2i Analytics Solutions
- Genpact Ltd.
- Accenture PLC
- Deloitte Touche Tohmatsu Ltd.
- Infosys Ltd.
- Capgemini SE
- WNS Global Services
- Xoomworks Procurement
- Infor Inc.
Market Opportunities and Future Outlook
The clearest near-term opportunity is in embedded AI procurement experiences that reduce the skill barrier for users while strengthening governance. SAPs 2026 disclosures around Joule-enabled procurement analytics with SAP Analytics Cloud support natural-language procurement queries and in-workflow insights, signaling a shift from dashboard-centric usage to conversational, task-level analytics inside source-to-pay. This opens room for vendors and service partners to operationalize access controls, redaction, and audit trails around GenAI outputs, especially for regulated buyers facing requirements tied to frameworks such as the EU AI Act (effective August 2025) and emerging US federal safeguards for LLM use in procurement (GSA proposed GSAR 552.239-7001 in June 2026).
A second opportunity centers on supplier risk and trade-policy intelligence built into procurement decisions rather than handled as a separate reporting layer. Market activity supports this direction, including LightSource raising USD 33 million in March 2025 to expand tariff-scenario modeling for US importers and Exigers May 2026 selection by Vodafone Telenor Procurement Company for AI-driven supplier risk intelligence. As procurement teams are increasingly expected to demonstrate resilience and compliance (including ESG-linked supplier scoring, due diligence, and cybersecurity requirements), vendors that support multi-tier supplier mapping, continuously updated risk signals, and evidence-ready reporting can differentiate, while service providers benefit from the integration work needed to connect these signals to ERPs and contract workflows.
Recent Industry Developments in Procurement Analytics Market
- June 2026: Coupa released the 2026 edition of its Business Spend Index in collaboration with MIT Data Science Lab, built on a reported USD 10 trillion dataset. The update elevated benchmarking from descriptive reporting toward more data-intensive predictive insight, helping procurement teams compare spend patterns against broader enterprise signals. The partnership also reinforces Coupa’s positioning around analytics-driven decision support as a core component of business spend management.
- March 2026: SAP announced general availability of next-generation SAP Ariba built on SAP Business Technology Platform (BTP), including integrated AI capabilities via Joule and SAP Ariba Intake Management. By placing AI and intake workflows on a unified platform layer, SAP strengthened the linkage between transactional procurement and embedded analytics inside source-to-pay. This release supports faster deployment of standardized data models and accelerators that reduce reliance on fragmented extraction-based reporting.
- July 2024: Flex paired with aPriori to introduce cost analytics aimed at improving RFQ win rates. The move highlighted how procurement analytics capabilities are being operationalized closer to quoting and sourcing decisions rather than remaining in post-event spend analysis. It also underscored the value of integrating cost and manufacturability intelligence into procurement workflows to improve bid competitiveness.
Procurement Analytics Market Report Scope and Research Methodology
Market Definition and Coverage
This market covers analytics tools and related services used by buying teams to turn sourcing, spend, supplier, and contract data into insights that guide procurement decisions. We size revenues that come from procurement-focused analytics capabilities delivered as software and associated services across major regions.
Scope exclusions: We exclude general-purpose BI platforms, procurement BPO fees, and internal staff labor used to run analytics.
Segments Covered in This Report
- By Type
- Software
- Services
- By Deployment
- On-Premise
- Cloud
- By Application
- Spend Analytics
- Risk Analytics
- Supply Chain Analytics
- Contract Management
- Demand Forecasting
- Supplier Performance Management
- By End-user Industry
- Manufacturing
- Transportation and Logistics
- Retail and E-commerce
- BFSI
- IT and Telecommunication
- Healthcare and Life Sciences
- Energy and Utilities
- Other End-user Industries
- By Organization Size
- Large Enterprises
- Small and Medium Enterprises (SMEs)
- By Geography
- North America
- United States
- Canada
- Mexico
- South America
- Brazil
- Argentina
- Chile
- Rest of South America
- Europe
- Germany
- United Kingdom
- France
- Italy
- Spain
- Russia
- Rest of Europe
- Asia-Pacific
- China
- Japan
- India
- South Korea
- Singapore
- Malaysia
- Australia
- Rest of Asia-Pacific
- Middle East and Africa
- Middle East
- Saudi Arabia
- United Arab Emirates
- Turkey
- Rest of Middle East
- Africa
- South Africa
- Nigeria
- Egypt
- Rest of Africa
- Middle East
- North America
Data Sources, Market Sizing, and Validation
Desk Research
Desk research helped us set the boundaries of what counts as procurement analytics revenue and what does not, and it shaped the initial assumptions for adoption and pricing. We relied on public and official sources that explain enterprise software spend and procurement priorities, including US SEC filings and annual reports, US Bureau of Labor Statistics series tied to purchasing roles, Eurostat business digitalization indicators, World Bank macro series, and OECD industry statistics.
To make the model measurable, we also reviewed vendor product documentation, public case studies, reputable press coverage, and association material such as ISM and CIPS publications that discuss procurement process maturity. We used paid subscriptions for company financials and news screening, plus a patent database to see where analytics and automation investments were concentrated. The sources listed here are illustrative only, and many other public documents were reviewed to collect, validate, and clarify inputs.
Primary Interviews and Surveys
Primary work was used to confirm what buyers actually pay for, how procurement analytics is packaged inside larger suites, and how services attach rates change by region and industry. We spoke with a balanced mix of solution providers, implementation partners, and end users, and these conversations helped tighten assumptions on deployment mix, renewal behavior, and typical deal sizes across Americas, EMEA, and APAC.
Distribution of primary research fieldwork respondents
| Company type | Respondent position | Region |
|---|---|---|
| Top tier: 34% | CXOs: 14% | APAC: 42% |
| Mid tier: 46% | Functional/Unit leaders: 39% | EMEA: 31% |
| Smaller Players: 20% | Managers: 47% | Americas: 27% |
Market-Sizing & Forecasting
Sizing starts with a top-down build where enterprise software and analytics spending pools are reconstructed by region, and then filtered using procurement digitization and analytics adoption rates to arrive at a realistic demand base. To keep the totals grounded, we corroborated outputs with selective bottom-up checks, such as rolling up a sample of vendor procurement-analytics revenues, using channel and partner feedback on average contract values, and testing implied users per customer against common procurement team sizes.
A few practical inputs were used because they can be tracked and rechecked over time, including cloud versus on-premise mix for procurement data platforms, attach rates for implementation and managed services, typical subscription price bands by organization size, renewal and expansion patterns, and the pace at which spend, supplier, and contract analytics are being adopted as standard modules. When product bundles made it hard to isolate procurement analytics, we handled gaps by allocating revenue shares using documented module coverage, customer use cases, and interview-led splits. For forecasting, scenario analysis was applied around macro demand signals and enterprise cost-control cycles, and then the scenario weights were refined through primary feedback on budgets, pipeline health, and implementation timelines.
Data Validation & Update Cycle
We run triangulation checks by comparing the model outputs with independent signals such as enterprise software budget commentary, regional IT spending direction, and the observed mix shift toward cloud subscriptions. Outliers are flagged when implied pricing, adoption, or services shares drift away from what interviews and public disclosures suggest, and then assumptions are revisited before sign-off.
Quality control is done in steps, where one analyst reviews the model logic and another reviews the inputs and calculations to catch variance and unit errors. If a large mismatch appears, we re-contact a subset of respondents to confirm whether the change is real or caused by a definition gap. Reports are refreshed annually, with interim updates when a material event changes pricing, packaging, or buyer demand, and a final pre-delivery pass is completed so clients receive the latest view.
Mordor Intelligence's Procurement Analytics Market Size Compared With Other Published Estimates
Published market sizes for procurement analytics can look far apart, even when they sound like they are measuring the same thing. The differences usually come from what is counted as procurement analytics, whether services are included, which year is treated as the starting point, and how currency timing is handled.
By tracking packaging changes, checking procurement-suite revenue allocations, and refreshing interview-based price bands, Mordor Intelligence keeps the estimate tied to procurement-specific analytics revenue instead of wider source-to-pay or generic analytics spending. In contrast, some estimates lean more on broad enterprise analytics assumptions, or they count adjacent categories like procurement platforms, BPO, or general BI tools, which can push totals up. Another common driver is the growth curve, where aggressive scenarios assume faster module penetration and higher services attach rates without reconciling them to renewal behavior and implementation capacity.
Benchmark comparison
| Source | Market Size | Gaps in Research Methodology |
|---|---|---|
| Mordor Intelligence | USD 7.11 B (2026) | |
| Industry Research Blog A | USD 6.29 B (2025) | Uses a different base year and appears to treat the category more broadly across procurement workflows, which can shift what is counted as analytics versus platform spend. |
| Syndicated Publisher B | USD 7.61 B (2025) | Likely includes a wider definition of procurement analytics systems and applies a higher bundled-software allocation, which can inflate the 2025 level versus procurement-analytics-only revenue. |
Looking across the three values, the spread mainly reflects boundary choices (analytics-only versus broader procurement systems) and how bundled suite revenue gets allocated. Our approach stays repeatable because the totals are built from clear demand signals, validated deal assumptions, and consistent year and currency handling, which makes updates easier to track from one refresh to the next.
Key Questions Answered in the Report
What is the current size of the procurement analytics market?
The procurement analytics market is valued at USD 7.11 billion in 2026 and is projected to reach USD 20.72 billion by 2031.
Which application segment is expanding fastest?
Risk analytics is the quickest-growing application, posting a 25.95% CAGR as firms prioritize supply-chain resilience.
Why are services growing faster than software?
Organizations increasingly need specialized expertise for data integration, AI model tuning, and change management, fueling a 26.45% services CAGR.
How are SMEs adopting procurement analytics solutions?
Cloud-native, pay-as-you-grow models eliminate heavy infrastructure costs, enabling SMEs to embrace analytics at a 26.70% CAGR.
Which region shows the strongest market growth?
Asia-Pacific leads in growth with a 26.10% CAGR, helped by manufacturing digitization programs and supportive government policies.
What role does ESG regulation play in procurement analytics adoption?
EU and North American due-diligence laws drive demand for platforms that embed supplier sustainability scoring, positioning analytics as a compliance essential.