
Processor Market Size and Share
Market Overview
| Study Period | 2020 - 2031 |
|---|---|
| Market Size (2026) | USD 139.61 Billion |
| Market Size (2031) | USD 179.8 Billion |
| Growth Rate (2026 - 2031) | 5.19% CAGR |
| Fastest Growing Market | Asia Pacific |
| Largest Market | North America |
| Market Concentration | Medium |
Major Players *Disclaimer: Major Players sorted in no particular order Image © Mordor Intelligence. Reuse requires attribution under CC BY 4.0. | |
Processor Market Analysis by Mordor Intelligence
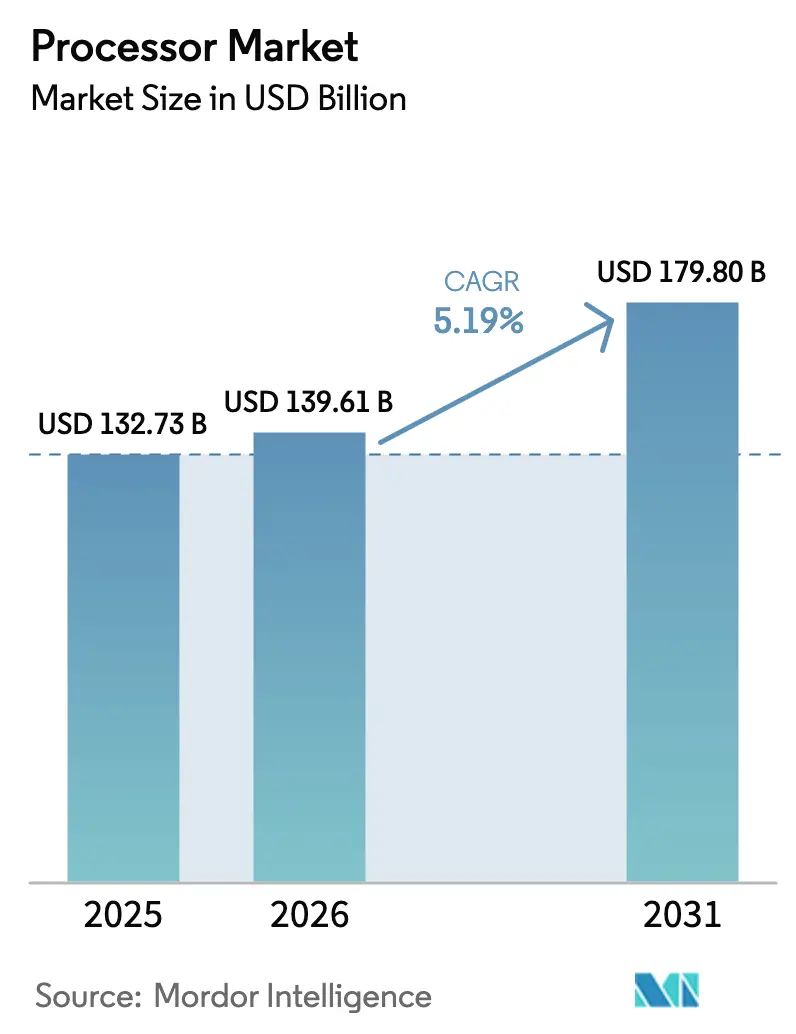
The processor market size was valued at USD 132.73 billion in 2025 and estimated to grow from USD 139.61 billion in 2026 to reach USD 179.8 billion by 2031, at a CAGR of 5.19% during the forecast period (2026-2031). Growth rests on a transition from general-purpose designs to AI-optimized architectures, an upswing in custom silicon from hyperscalers, and government incentives that expand domestic fabrication capacity. North America anchors demand on the back of data-center investments and CHIPS Act incentives, while Asia-Pacific leads in pace as India, China, and Japan scale fabrication capacity. Architectural competition intensifies as x86’s long-held lead confronts ARM and RISC-V designs that deliver higher performance per watt. M&A activity worth more than USD 50 billion in 2025 highlights an industry pivot toward vertical integration, advanced packaging, and chiplet strategies that lower cost and raise performance per area.
Key Report Takeaways
- By product type, CPUs held 63.70% of the processor market share in 2025; APUs are projected to expand at a 6.32% CAGR to 2031.
- By micro-architecture, x86 captured 54.10% of the processor market size in 2025, while RISC-V recorded the fastest 6.47% CAGR through 2031.
- By fabrication node, processes at 4 nm and below account for the highest 7.88% CAGR between 2026 and 2031, although nodes >10 nm still command 45.60% of 2025 revenue.
- By end-use application, consumer electronics led with a 37.90% share of the processor market size in 2025; automotive and ADAS is the fastest-growing segment at 7.49% CAGR to 2031.
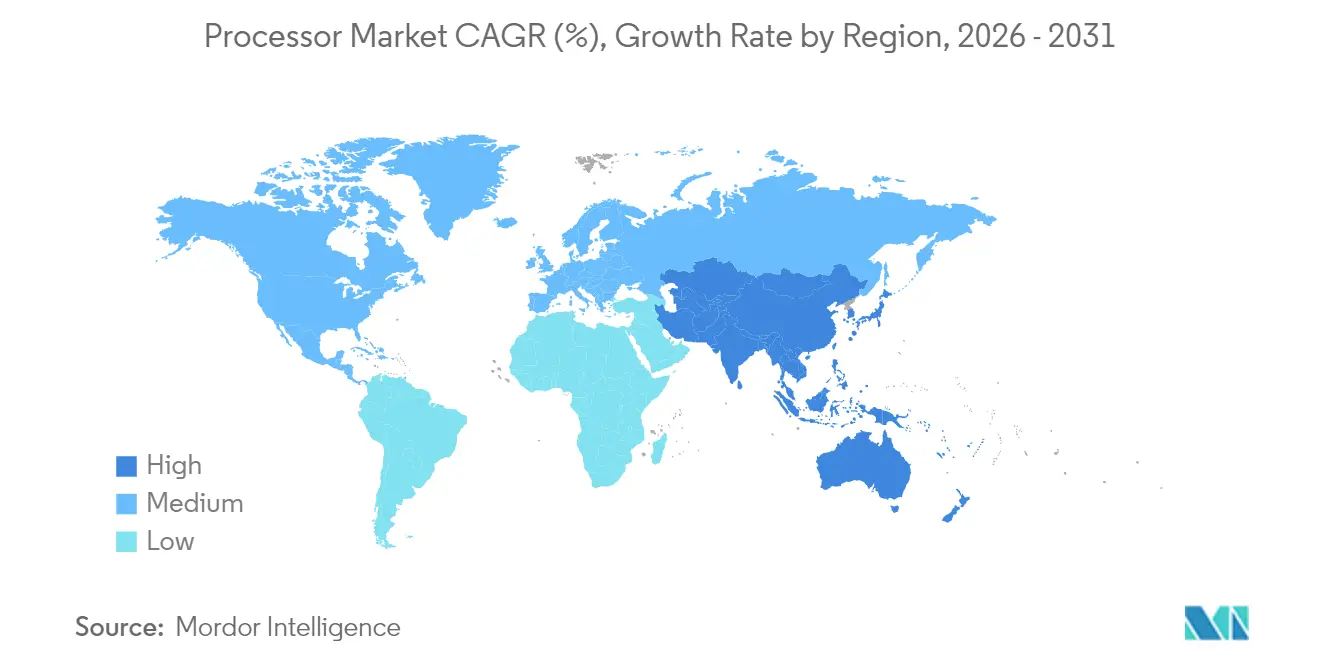
- North America commanded 41.75% of the processor market share in 2025, whereas Asia-Pacific displays the highest 8.25% CAGR during the forecast period.
Note: Market size and forecast figures in this report are generated using Mordor Intelligence’s proprietary estimation framework, updated with the latest available data and insights as of 2026.
Global Processor Market Trends and Insights
Drivers Impact Analysis*
| Driver | (~) % Impact on CAGR Forecast | Geographic Relevance | Impact Timeline |
|---|---|---|---|
| Rising penetration of smartphones | +1.20% | Global, with strongest impact in Asia-Pacific and emerging markets | Medium term (2-4 years) |
| Growing adoption of cloud, AI and big-data workloads | +1.80% | Global, concentrated in North America and Europe data centers | Short term (≤ 2 years) |
| Expanding edge-computing deployments | +0.90% | Global, with early adoption in industrial and automotive sectors | Medium term (2-4 years) |
| Government incentives for semiconductor capacity | +0.70% | North America, Europe, Asia-Pacific core regions | Long term (≥ 4 years) |
| AI-optimized instruction-set extensions | +0.60% | Global, spill-over from data centers to consumer electronics | Short term (≤ 2 years) |
| Chiplet-based heterogeneous integration cost savings | +0.40% | Global, with concentration in advanced manufacturing regions | Long term (≥ 4 years) |
| Source: Mordor Intelligence | |||
Growing adoption of cloud, AI and big-data workloads
Hyperscalers now design and deploy custom chips that lift performance-per-dollar versus merchant silicon. AWS Trainium2 improves AI training cost efficiency by 30-40% compared with GPU instances, while Google’s Ironwood TPU hits 4,614 TFLOPS per chip and scales to 42.5 exaflops per pod.[1]Wylie Wong, “AWS Launches Trainium2 Custom AI Chip,” datacenterknowledge.com The resulting USD 45 billion custom-chip opportunity is eroding margins for traditional CPU vendors as cloud operators internalize silicon design. Data-sovereignty mandates in Europe and parts of Asia are reinforcing regional processor preferences, further segmenting demand patterns.
Rising penetration of smartphones
Application processors now ship with dedicated NPUs as handset makers push on-device AI. Apple’s A18 Pro integrates matrix coprocessors, and Qualcomm’s Snapdragon 8 Gen 4 targets a 40% performance uplift through NPU advancements.[2]Tyson Mark, “Google Has Developed Its Own Data Center Server Chips,” tomshardware.com The monolithic integration of 5G modems has cut the bill-of-materials cost by 15-20% and lifted battery efficiency. Slower replacement cycles shift emphasis to sustained efficiency, pushing leading-edge nodes below 5 nm into volume for premium tiers.
Expanding edge-computing deployments
Industrial and automotive edge workloads outstrip legacy MCU capabilities, prompting adoption of server-class cores. Ampere’s 512-core processor targets compact data-center-in-a-box deployments, while Tesla’s Dojo die clocks 362 BF16 TFLOPS for autonomous inference at the vehicle edge.[3]Prickett Morgan Timothy, “Ampere Arm Server CPUs to Get 512 Cores,” nextplatform.com Edge designs now co-support deterministic control and AI inference, raising demand for heterogeneous compute fabrics that blend CPUs, GPU tiles, and packet-processing engines.
Government incentives for semiconductor capacity
The CHIPS and Science Act unlocked USD 52.7 billion to spur domestic fabs, triggering TSMC’s USD 165 billion Arizona complex and Intel’s USD 100 billion multi-site expansion.[4]TSMC, “Arizona Plant Expansion,” tsmc.com Similar schemes in the EU (EUR 43 billion) and India (USD 10 billion) encourage localized supply chains. Long approval cycles and construction timelines mean benefits accrue over a four-year horizon, but the policy momentum already influences site selection and long-term capacity planning.
Restraints Impact Analysis*
| Restraint | (~) % Impact on CAGR Forecast | Geographic Relevance | Impact Timeline |
|---|---|---|---|
| Talent shortage in advanced node design | -1.10% | Global, most acute in North America and Europe | Medium term (2-4 years) |
| Geopolitical export controls on EDA/IP | -0.80% | Global, with concentration in US-China technology corridors | Short term (≤ 2 years) |
| Thermal design limits in sub-3 nm nodes | -0.60% | Global, affecting advanced manufacturing regions | Long term (≥ 4 years) |
| Supply-chain emissions compliance costs | -0.30% | Global, with stricter enforcement in Europe and California | Medium term (2-4 years) |
| Source: Mordor Intelligence | |||
Talent shortage in advanced node design
Chipmakers face difficulty hiring engineers qualified for 3 nm and below. Intel reported 3,000 open roles despite USD 200,000 starting packages, and TSMC moved 1,000 Taiwanese staff to Arizona to train local hires. Academia’s slower curriculum cycles add a 5-7 year skills lag, especially in verification, critical as chiplet counts soar. Visa caps in the U.S. further tighten supply, prompting companies to relocate design centers to India and Southeast Asia.
Geopolitical export controls on EDA/IP
U.S. rules restricting advanced EDA tools and IP to China split design roadmaps. Alibaba’s T-Head must maintain separate EDA flows, adding 15-25% to cost and schedule, while ARM license uncertainties complicate x86 cross-licensing deals. RISC-V’s open model gains traction for export-control resilience, though high-performance toolchains remain immature. Companies, therefore, shoulder duplicated verification and restricted foundry access, dampening near-term growth.
*Our forecasts treat driver/restraint impacts as directional, not additive. The impact forecasts reflect baseline growth, mix effects, and variable interactions.
Segment Analysis
By Product Type: Integration Redefines Value
CPUs retained 63.70% of the processor market share in 2025, yet APUs’ 6.32% CAGR underscores demand for unified CPU-GPU fabrics that handle AI inference locally. The processor market size for APUs is projected to increase in tandem with rising creator workloads that need on-chip graphics acceleration. Smartphone SoCs branch into automotive and IoT, extending their lifetime value, while smart-TV processors ride 8 K content and AI upscaling tailwinds. Commodity pressure on tablets persists as phone-class silicon narrows the performance delta.
Apple’s M-series exemplifies a shift toward shared-memory architectures that erase PCIe bottlenecks, while Intel’s Core Ultra integrates a 48 TOPS NPU to preserve x86 relevance in AI PCs. Specialty categories, smartwatch, AR/VR, and automotive, gain share from regulatory pushes on safety and assisted driving. Certification paths such as ISO 26262 lengthen development by up to 24 months but allow premium pricing and higher margin retention.


By Micro-architecture: Open Standards Gain Ground
x86 still dominates the processor market, holding 54.10% in 2025, but ARM and RISC-V architectures thrive on efficiency and licensing flexibility. Processor market size for ARM cores benefits from hyperscaler adoption: AWS Graviton4 and Google Axion yield up to 60% better energy efficiency over equivalent x86 instances. Intel’s AMX extensions aim to offset the gap but hinge on a two-year software-enablement curve.
RISC-V’s 6.47% CAGR rests on openness; SiFive and GlobalFoundries bring automotive-grade designs that challenge Power architecture’s niche in high-reliability systems. However, tooling gaps delay mainstream workloads by three to five years. Regulatory shifts that favor export-control-free IP accelerate pilot deployments, hinting at deeper market penetration after 2028.
By Fabrication Node: Premium Nodes Capture Growth
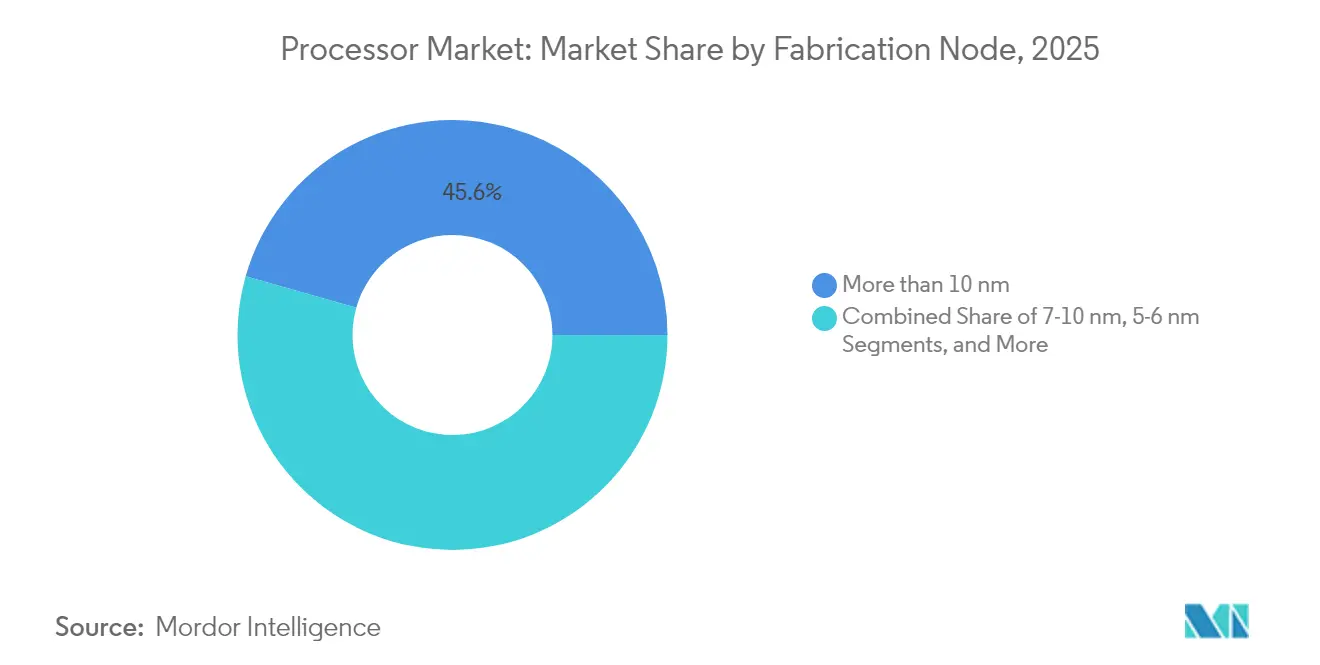
Mature nodes (>10 nm) still control 45.60% of 2025 revenue, serving cost-sensitive automotive and RF devices, but nodes at 4 nm and below post the fastest 7.88% CAGR as AI density demands escalate. Processor market size for advanced nodes rises with every generation because transistor gains outweigh growing mask costs. Sub-4 nm chips push thermal limits beyond 200 W/cm², forcing liquid cooling and advanced packaging that add USD 50–100 per package. Samsung and TSMC’s roadmaps to 2 nm by late 2025 center on backside power delivery to ease current density.
Mid-range nodes (5–6 nm) become mainstream for premium mobile and PC devices, balancing cost and efficiency, while 7-10 nm offers a bridge for designers migrating from 12 nm without incurring reticle-cost spikes. Environmental rules in California and the EU raise compliance costs 3–5% annually, nudging some volume to regions with looser emission ceilings.
By End-use Application: Automotive Momentum Builds
Consumer electronics retained 37.90% of 2025 revenue, but the processor market size in automotive and ADAS grows at a 7.49% CAGR on the path to Level 3 autonomy. Tesla’s USD 16.5 billion Samsung deal secures capacity for self-driving compute from 2026. Hyperscale data centers remain the second-largest outlet as AI training nodes expand, yet edge deployments in factories and telecom sites close the gap by distributing inference workloads.
Industrial IoT shifts to application processors that crunch data locally, cutting backhaul latency. Aerospace and defense demand processors that meet ITAR and DO-178C, adding 12-18 months to design cycles but commanding higher ASPs. Gaming consoles and cloud-gaming back-ends prolong the life of monolithic APUs that fuse ray tracing cores with scalar engines.
Geography Analysis
North America controlled 41.75% of the processor market share in 2025, thanks to the CHIPS Act funding and hyperscaler concentration. Volume ramped at TSMC Arizona’s 4 nm line in early 2025, supplying Apple and NVIDIA, while Intel pledged USD 100 billion through 2029 for foundry expansion. Talent gaps and visa limits remain structural impediments, forcing companies to import expertise from Asia.
Asia-Pacific posts the fastest 8.25% CAGR as China’s indigenous designs and India’s USD 10 billion incentives build regional self-reliance. Japan’s TSMC-JASM fab and South Korea’s System Semiconductor Vision 2030 further tilt global output eastward. Export controls restrict high-end EDA flows to Chinese firms, spurring RISC-V adoption in domestic designs.
Europe sustains growth via the EUR 43 billion Chips Act that backs GlobalFoundries’ Dresden expansion and Intel’s prospective Magdeburg fab. Automotive processors form the continent’s core demand, aligning with a robust Tier-1 supply chain. Environmental and GDPR rules steer OEMs toward regionally located fabs despite higher labor costs.
The Middle East and Africa enter assembly-and-test segments using sovereign investment funds, but advanced fabrication remains nascent.

Regulatory Landscape
Processor supply and design decisions are increasingly shaped by industrial policy and export-control regimes. In the United States, the CHIPS and Science Act (USD 52.7 billion) continues to steer fab siting and funding decisions, and in July 2026 the U.S. National Institute of Standards and Technology (NIST) highlighted an expanded semiconductor investment commitment tied to domestic capacity buildout, reinforcing a multi-year reshoring push that affects leading-edge logic availability and advanced packaging planning.
Trade and security controls are tightening cross-border technology flows that underpin processor roadmaps. In April 2026, the proposed U.S. MATCH Act advanced in Congress, seeking aligned semiconductor export controls among key allies within a defined timeline, while U.S. Department of Commerce licensing changes shifted certain shipments of chipmaking equipment to case-by-case reviews for China-linked plants operated by Samsung and SK hynix. Taiwan initiated formal consultations (June 2026) on restricting AI accelerator and advanced GPU component shipments to mainland China, adding compliance complexity for firms building global processor portfolios across x86, Arm, and RISC-V ecosystems.
Value Chain Analysis
The processor value chain spans IP and architecture licensing, chip design and EDA, wafer fabrication, advanced packaging and test, and OEM and hyperscaler system integration. At the leading edge, design leaders such as Apple, NVIDIA, AMD, and Broadcom depend heavily on foundry access, with TSMC holding a dominant position in advanced-node manufacturing and associated packaging capacity. This concentration increases the strategic weight of equipment and process ecosystems (for example, EUV lithography and deposition/etch tool chains) and makes access to advanced packaging a competitive lever as chiplet-based integration expands.
Downstream, hyperscalers and large OEMs increasingly influence processor specifications and procurement through custom silicon, rackscale platforms, and long-term capacity reservations. Assembly-and-test and substrate suppliers also become critical for yield, thermals, and time-to-market at high power densities. Capacity localization initiatives also reshape the chain: Intel disclosed a EUR 5 billion manufacturing expansion at its Leixlip, Ireland, campus on Intel 3, reflecting the push to pair regional manufacturing footprints with local demand centers. Export-control compliance and sustainability requirements add incremental cost and lead-time to design, tool qualification, and manufacturing handoffs, particularly for advanced-node and AI-focused processors.
Competitive Landscape
Competition in the processor market centers on three vectors: architectural innovation, vertical integration, and packaging leadership. Intel’s delays open the share for AMD and ARM-based vendors, while NVIDIA’s Grace Hopper unites CPU and GPU into a single module for AI training supremacy. Hyperscalers, having deployed over 50 million in-house chips, now influence instruction-set roadmaps and foundry capacity reservations.
Qualcomm’s USD 2.4 billion Alphawave Semi acquisition broadens high-speed interconnect IP, underscoring a shift toward chiplet-era integration. GlobalFoundries’ plan to buy MIPS adds RISC-V IP for edge and autonomous workloads. Strategy converges on owning silicon, packaging, and software stacks that lock in ecosystem value. FTC scrutiny of large deals creates regulatory overhead, but vendors perceive consolidation as essential to finance multi-billion-dollar node migrations.
White-space opportunities persist in edge-AI ASICs, automotive-grade HPC, and post-quantum cryptography accelerators. Vendors with deep software ecosystems and packaging know-how gain leverage as transistor scaling alone plateaus.
Processor Industry Leaders
Advanced Micro Devices Inc. (AMD)
Intel Corporation
Qualcomm Technologies Inc.
Apple Inc.
NVIDIA Corporation
- *Disclaimer: Major Players sorted in no particular order


Market Opportunities and Future Outlook
Opportunities are widening where AI compute intensity intersects with supply chain localization and packaging constraints. Advanced packaging capacity and co-optimization services (chiplet integration, high-bandwidth memory connectivity, and power delivery) are standing out, supported by major ecosystem investments such as SK hynix committing KRW 100 trillion to build M17 NAND and a P&T7 advanced packaging facility in Cheongju. The direction points to memory, interconnect, and packaging acting as system-level differentiators for processors used in AI training and inference, not only compute cores.
Regional manufacturing programs also open lanes for new processor platforms and localized supply agreements. In July 2026, Apple expanded a multi-year agreement exceeding USD 30 billion with Broadcom to produce billions more U.S.-made chips, and NIST communications in July 2026 underscored continued momentum behind U.S. semiconductor capacity expansion. Alongside these, Tower Semiconductor outlined a USD 3 billion Japan expansion plan spanning silicon photonics, SiGe, and advanced packaging with government support, pointing to incremental opportunities in specialized processor-adjacent silicon (high-speed I/O, optical interconnect, and RF-front-end integration) that complements CPU/GPU/NPU roadmaps for data centers, edge systems, and automotive compute.
Recent Industry Developments
- July 2026: Apple Inc. to increase spend with Broadcom to produce billions more US chips. The commitment expands custom silicon production and wireless connectivity in the United States.
- July 2026: Taiwan Semiconductor Manufacturing Company (TSMC) pledged an additional $100 billion investment to expand U.S. manufacturing capacity. The expansion broadens domestic fabrication and packaging capacity for AI and compute workloads.
- June 2026: IBM unveils world's first sub-1 nanometer chip technology (0.7 nm) with nanostack transistor architecture. The breakthrough advances processing density and performance per watt.


Research Methodology Framework and Report Scope
Market Definition and Coverage
For this study, the processor market is defined as the revenues generated from processor units used across computing and embedded devices, counted at the point of processor shipment into end-use applications and measured in USD.
Scope exclusions: We exclude foundry services, wafer sales, memory, discrete power components, and stand-alone software or cloud services not sold as part of a processor device.
Segmentation Overview
- By Product Type
- CPU
- Client (Desktop and Laptop)
- Server
- APU
- Smartphone
- Tablet
- Smart Television
- Smart Speakers
- Other (Smartwatch, Notebook, AR/VR, Automotive)
- By Micro-Architecture
- x86
- Arm
- RISC-V
- Power
- By Fabrication Node
- More than 10 nm
- 7-10 nm
- 5-6 nm
- Equal to and less than 4 nm
- By End-Use Application
- Consumer Electronics
- Data Center and Cloud
- Industrial and IoT Edge
- Automotive and ADAS
- Aerospace and Defense
- By Geography
- North America
- United States
- Canada
- Mexico
- South America
- Brazil
- Argentina
- Rest of South America
- Europe
- Germany
- United Kingdom
- France
- Italy
- Spain
- Russia
- Rest of Europe
- Asia-Pacific
- China
- Japan
- India
- South Korea
- South-East Asia
- Rest of Asia-Pacific
- Middle East and Africa
- Middle East
- Saudi Arabia
- United Arab Emirates
- Turkey
- Rest of Middle East
- Africa
- South Africa
- Nigeria
- Rest of Africa
- Middle East
- North America
Data Sources, Market Sizing, and Validation
Desk Research
Desk research started with building the demand boundaries and the main terminology used in processors, and then mapping the value chain from design through to system shipment pull. We leaned on public, non-paywalled references such as World Semiconductor Trade Statistics releases, Semiconductor Industry Association publications, OECD and World Bank macro series, and US International Trade Commission trade and tariff resources, since these help explain broad electronics output and cross-border flows.
To convert those broad signals into processor-relevant inputs, we also reviewed company filings and investor presentations, product briefs, and reputable press coverage around node transitions and packaging capacity. In a few places, paid subscriptions for company financials and intelligence, patent databases, and shipment-level import and export records were used to validate timelines and reduce guesswork on mix changes. The desk sources listed here are illustrative, and many other public references were checked to collect, cross-verify, and clarify data points.
Primary Interviews and Surveys
Primary work was used to confirm what the desk signals could not fully show, especially mix shifts across client, server, and embedded demand, plus how average selling prices moved with node, architecture, and supply constraints. We spoke with and surveyed stakeholders such as component distributors, OEM and ODM supply chain roles, data center and industrial buyers, and independent domain experts. Their inputs were then used to stress-test assumptions across major geographies before finalizing the model.
Distribution of primary research fieldwork respondents
| Company type | Respondent position | Region |
|---|---|---|
| Top tier: 30% | CXOs: 13% | APAC: 47% |
| Mid tier: 55% | Functional/Unit leaders: 41% | EMEA: 30% |
| Smaller Players: 15% | Managers: 46% | Americas: 23% |
Market-Sizing & Forecasting
Sizing was built using a top-down approach where semiconductor and electronics demand indicators were reconstructed into a processor value pool by end-use, followed by architecture and node mix checks. To keep the totals realistic, we then corroborated them with selective bottom-up approximations, such as sampled ASP times unit volumes for key device groups, distributor channel checks, and a limited roll-up of supplier revenue exposure where disclosure allowed.
Key model inputs included unit shipments for PCs and tablets, server and data center build-out indicators, smartphone production trends, CPU versus GPU versus APU mix by application, and the pace of node migration (for example, movement from more than 10 nm toward advanced nodes). Pricing was handled through a simple ASP curve updated for product mix and supply tightness. Where data gaps existed, we used bounded ranges agreed during interviews, then narrowed them through consistency checks. Forecasting relied on scenario analysis supported by a small set of drivers, including device replacement cycles, data center capex expectations, and expected normalization of supply constraints, so the forecast can be explained and repeated without relying on hidden data.
Data Validation & Update Cycle
Outputs were checked in multiple steps so the final number does not depend on one dataset or one assumption. Analysts compared totals against independent signals such as overall semiconductor sales direction, public device shipment trends, and reported mix shifts by major buyer groups, and then investigated any large variances before sign-off.
If an assumption moved outside an expected range, we re-contacted respondents and revisited the input, followed by an internal review pass that checks math, logic, and narrative consistency. Reports are refreshed annually, and interim updates are made when material events occur, such as major export controls, sharp demand swings, or step changes in node capacity. Before delivery, a final fresh pass is completed so clients receive the latest updated view.
Mordor Intelligence's Processor Market Estimate Compared With Other Published Estimates
Published numbers for the processor market often differ because the underlying boundaries are not always aligned, and because the same demand can be counted at different points in the value chain. Differences also come from how analysts treat architecture categories, how they move ASPs over time, and how frequently models are refreshed when major mix shifts happen.
Device shipment trends (PCs, smartphones, and servers) and semiconductor sales direction checks are the evidence points that keep Mordor Intelligence's estimate tied to processor-specific demand rather than being widened into broader chip revenue. When those checks are used, the main gap drivers usually become visible, including whether accelerators and embedded processors are fully included, whether pricing assumes a steady ASP rise even when mix cools, and whether currency conversion uses a consistent timing for the base year.
Benchmark comparison
| Source | Market Size | Gaps in Research Methodology |
|---|---|---|
| Mordor Intelligence | USD 139.61 B (2026) | |
| Global Consultancy A | USD 140.90 B (2025) | Uses a microprocessor-style definition and a different base year, which can shift totals when accelerators, embedded compute, and edge processors are treated inconsistently across end uses. |
| Trade Body B | USD 700.87 B (2025) | Represents total semiconductor sales across product categories, so the figure captures memory, analog, and other ICs beyond processors, which inflates the number versus a processor-only demand pool. |
The comparison shows that year choice and scope boundaries explain most of the spread, more than math differences. When the market is kept at the processor device level and then cross-checked against visible shipment and investment signals, the outcome stays easier to audit and repeat, which helps decision-makers plan with fewer hidden assumptions.


Key Questions Answered in the Report
How large is the processor market in 2026?
The processor market size stood at USD 139.61 billion in 2026.
What CAGR is forecast for processors through 2031?
The market is projected to grow at a 5.19% CAGR between 2026 and 2031.
Which region grows fastest for processor demand?
Asia-Pacific is expected to post an 8.25% CAGR, the highest among regions.
What segment is expanding quickest in end-use applications?
Automotive and ADAS processors are forecast to rise at 7.49% CAGR to 2031.
Which micro-architecture shows the strongest growth?
RISC-V leads with a 6.47% CAGR, reflecting interest in open, customizable IP.
Why are hyperscalers designing their own chips?
Custom silicon improves performance-per-dollar and aligns with data-sovereignty mandates, creating a USD 45 billion internal market.
Page last updated on:


