
Processed Peanut Market Size and Share
Market Overview
| Study Period | 2021 - 2031 |
|---|---|
| Market Size (2026) | USD 120.57 Billion |
| Market Size (2031) | USD 149.61 Billion |
| Growth Rate (2026 - 2031) | 4.42 % |
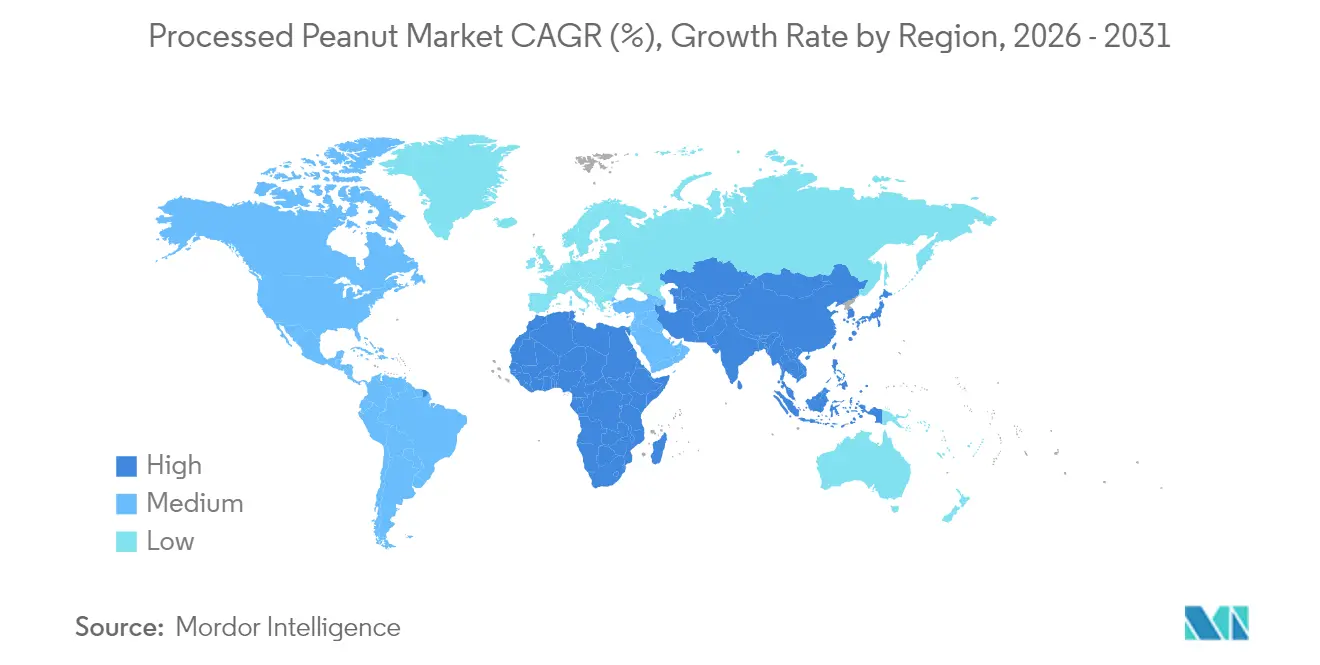
| Fastest Growing Market | North America |
| Largest Market | Asia-Pacific |
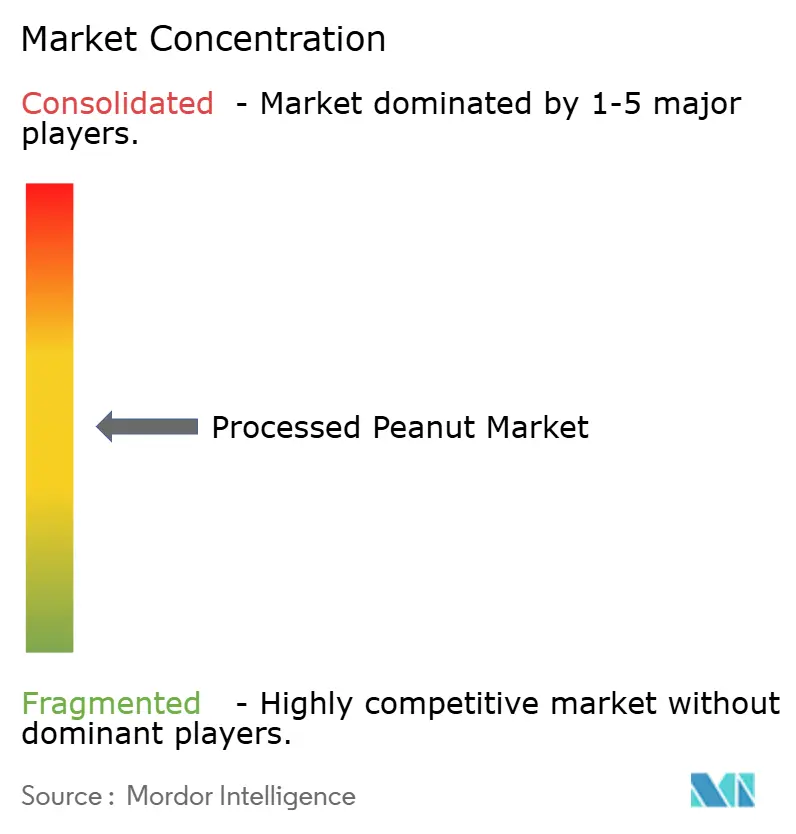
| Market Concentration | Medium |
Major Players *Disclaimer: Major Players sorted in no particular order Image © Mordor Intelligence. Reuse requires attribution under CC BY 4.0. | |
Processed Peanut Market Analysis by Mordor Intelligence
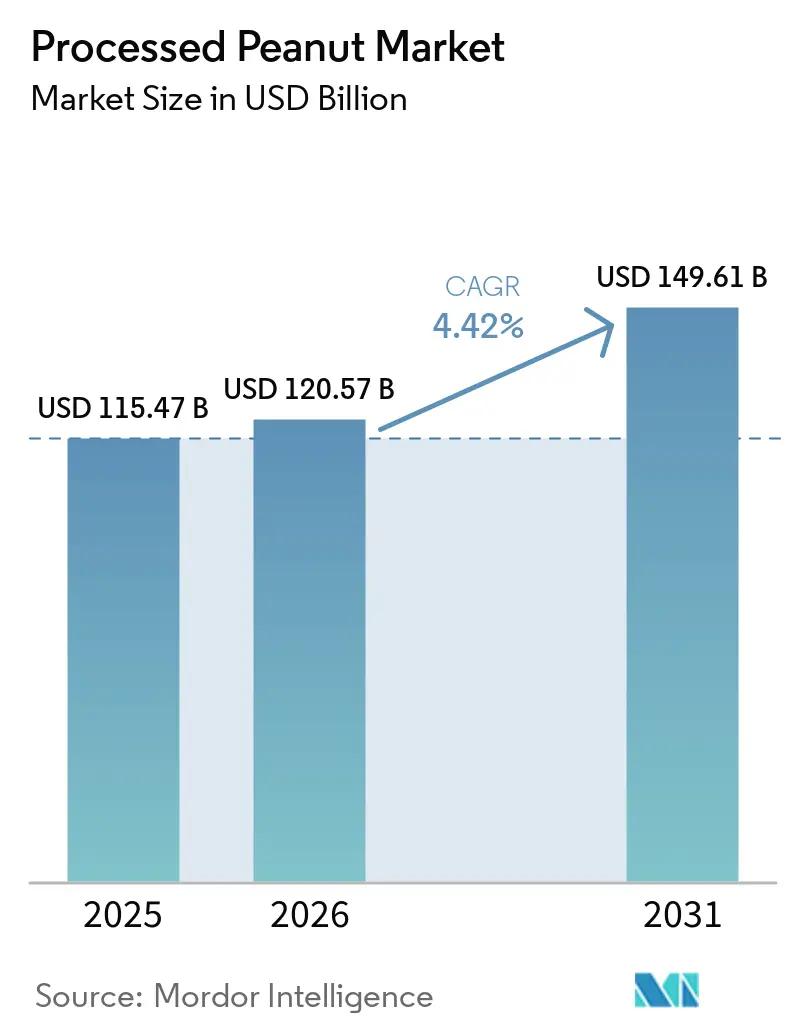
The processed peanut market size was valued at USD 115.47 billion in 2025 and estimated to grow from USD 120.57 billion in 2026 to reach USD 149.61 billion by 2031, at a CAGR of 4.42% during the forecast period (2026-2031). This growth is driven by increasing demand for affordable, plant-based protein in the Asia-Pacific region and the rising popularity of premium snack products in North America and Europe. Innovations in peanut flavors, collaborations with regenerative farming initiatives, and advancements in roasting technologies are helping suppliers manage challenges such as fluctuating raw material prices and increasing labor costs. The use of peanuts in diverse applications, including skincare products, animal feed, and ready-to-eat meals, is expanding revenue streams. This diversification not only reduces the impact of economic downturns but also broadens the market's potential applications. The processed peanut market remains fragmented, with global snack companies competing alongside strong regional processors, creating a balanced competitive landscape.
Key Report Takeaways
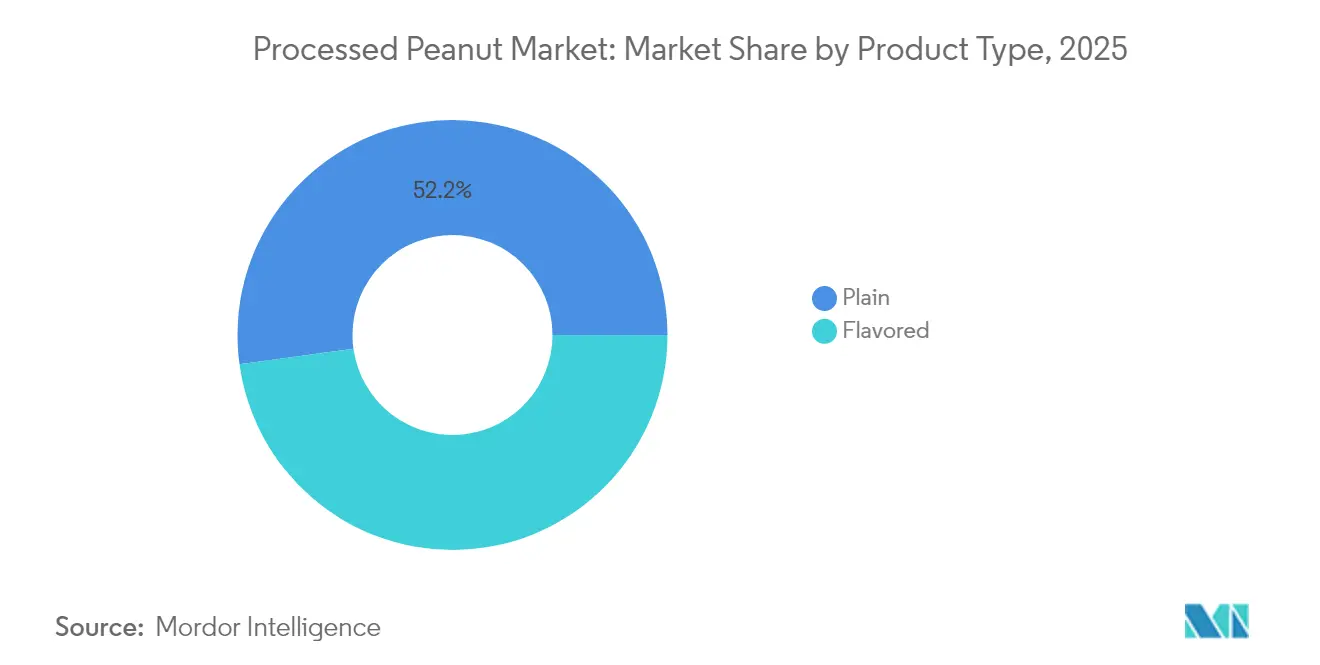
- By product type, plain peanuts accounted for 52.18% of the processed peanut market share in 2025, while flavored variants are forecast to expand at a 5.41% CAGR to 2031.
- By form, whole formats held 60.78% of the processed peanut market size in 2025; however, roasted peanuts are expected to advance at a 6.12% CAGR through 2031.
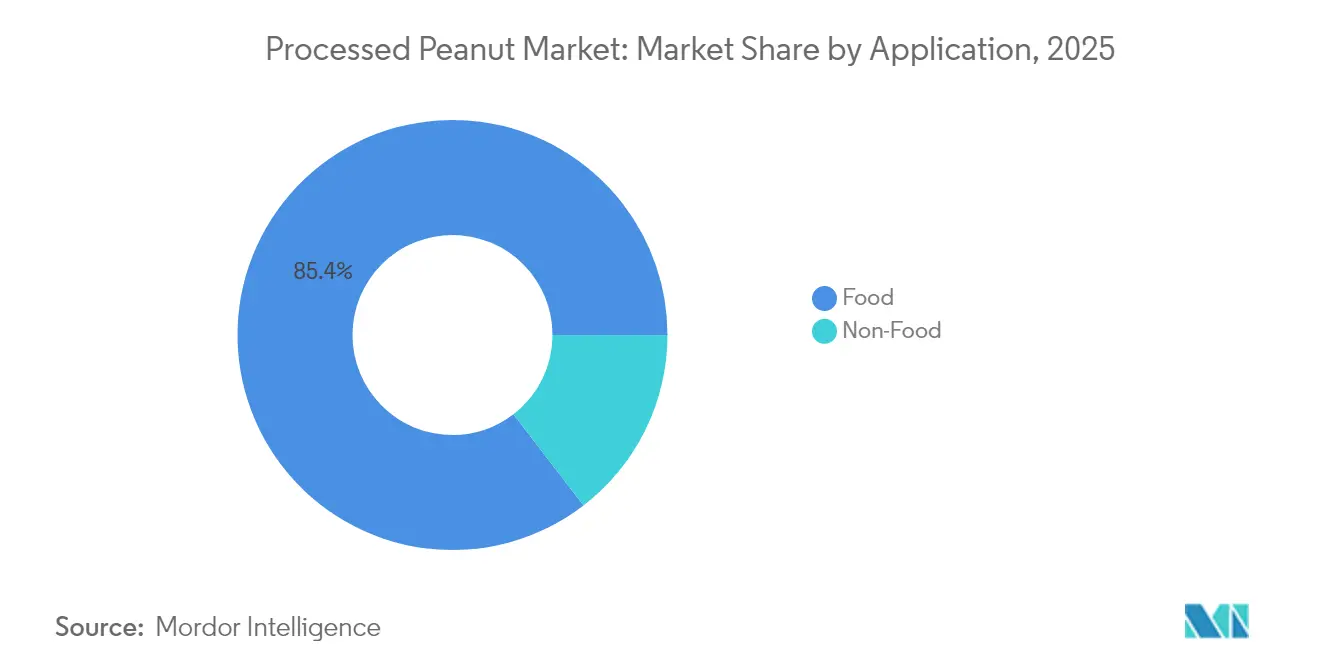
- By application, food processing, horeca, and retail together accounted for 85.43% of demand in 2025; non-food uses are the fastest-growing segment at a 6.39% CAGR during 2026-2031.
- By geography, the Asia-Pacific region led with a 36.85% value share in 2025, whereas North America is positioned for the fastest regional expansion at a 5.39% CAGR through 2031.
Note: Market size and forecast figures in this report are generated using Mordor Intelligence’s proprietary estimation framework, updated with the latest available data and insights as of 2026.
Global Processed Peanut Market Trends and Insights
Drivers Impact Analysis*
| Driver | (~) % Impact on CAGR Forecast | Geographic Relevance | Impact Timeline |
|---|---|---|---|
| Rising consumer preference for protein-rich and plant-based foods | +0.8% | Global, with concentration in North America, Europe, and urban Asia-Pacific | Medium term (2-4 years) |
| Growing popularity of convenient and nutrient-dense snacks | +0.9% | Global, led by North America and Europe, expanding in Asia-Pacific urban centers | Short term (≤ 2 years) |
| Increasing use of processed peanuts in natural skincare formulations | +0.3% | North America, Europe, and premium segments in Asia-Pacific | Long term (≥ 4 years) |
| Incorporation of peanuts in ready meals and sauces | +0.4% | Global, with early adoption in North America and Europe, spillover to Asia-Pacific | Medium term (2-4 years) |
| Growing adoption of advanced roasting and coating technologies | +0.5% | North America, Europe, and large-scale processors in Asia-Pacific | Medium term (2-4 years) |
| Increasing investment in flavor innovation | +0.6% | Global, with premium positioning in North America and Europe, mass-market expansion in Asia-Pacific | Short term (≤ 2 years) |
| Source: Mordor Intelligence | |||
Rising consumer preference for protein-rich and plant-based foods
The growing demand for affordable, protein-rich foods is driving the global consumption of processed peanuts. Consumers are increasingly turning to peanuts as a cost-effective alternative to more expensive protein sources, such as animal and soy proteins. Peanuts provide approximately 25 to 28 grams of protein per 100 grams, which aligns with the rising focus on protein intake, with 71% of Americans aiming to increase their protein consumption, as reported in the 2024 International Food Information Council's Food and Health Survey[1]. Flexitarian diets, which combine plant-based and occasional animal-based foods, now account for nearly 20% of adults in North America and Europe. As a result, peanut protein isolates are increasingly being used in a variety of products, including protein bars, shakes, and plant-based meat substitutes, catering to the evolving dietary preferences of consumers.
Growing popularity of convenient and nutrient-dense snacks
The growing preference for convenient and nutritious snacks is driving the expansion of processed peanut-based products. Consumers are increasingly looking for snacks that not only satisfy hunger but also provide nutritional benefits. According to the 2024 International Food Information Council Food and Health Survey, nearly 75% of Americans snack at least once daily[2]. Furthermore, the 2024 International Food Information Council Snacking Report highlights that 51% of snackers actively set calorie goals and choose snacks that align with their health objectives[3]. In response to this trend, snack manufacturers are innovating to meet the evolving demands of consumers. For instance, in July 2025, PepsiCo introduced a new product line called "That’s Nuts," featuring flavored coated peanuts inspired by popular crisp flavors. This product is designed to appeal to impulse buyers and snack enthusiasts who seek a combination of great taste and convenience.
Incorporation of peanuts in ready meals and sauces
The use of peanuts in ready meals, sauces, and meal kits is increasing as manufacturers recognize their versatility and cost-effectiveness. Peanut butter, for example, is often used as a natural emulsifier to stabilize dressings and marinades. Products like Don Emilio’s salsa macha, which includes roasted peanuts for added flavor and texture, highlight how peanuts can enhance both the taste and nutritional value of traditional recipes. Compared to tree nuts, peanuts are more affordable, making them a popular choice for both private-label and branded products. Business-to-business (B2B) supply agreements help processors secure consistent volumes, ensuring a steady supply chain. This trend is particularly pronounced in regions such as North America and Europe, where ready meals are widely consumed. In the Asia-Pacific region, the demand is growing rapidly as urbanization and busier lifestyles lead to less time spent on home cooking, driving the need for convenient meal solutions.
Increasing investment in flavor innovation
Investments in flavor innovation are driving the growing demand for processed peanuts, as brands introduce unique and modern flavor profiles to stand out in competitive snacking markets. For example, in November 2025, KP Snacks expanded its Whole Earth product line by introducing a new 100% Nuts roasted peanut product. This move reflects the increasing consumer preference for simple, clean-label peanut options that still offer rich and appealing flavors. New product launches featuring flavors like cocoa dusting, chili and lime, sriracha, wasabi, truffle, masala, and teriyaki are gaining popularity. These adventurous and premium flavors are particularly appealing to consumers in Western and Asia-Pacific markets, where there is a growing interest in trying bold and exotic tastes. Manufacturers are also accelerating their research and development processes, enabling them to introduce these innovative flavors to the market more quickly.
Restraints Impact Analysis*
| Restraint | (~) % Impact on CAGR Forecast | Geographic Relevance | Impact Timeline |
|---|---|---|---|
| High capital requirements for modern processing equipment | -0.5% | Global, with acute impact on small and mid-sized processors in emerging markets | Medium term (2-4 years) |
| Fluctuating raw peanut prices due to weather variability and inconsistent crop yields | -0.7% | Global, with severe impact in United States, India, Mexico, and Argentina | Short term (≤ 2 years) |
| Increasing consumer preference for allergen-free foods | -0.4% | North America, Europe, and urban Asia-Pacific | Medium term (2-4 years) |
| Prevalence of peanut allergies in certain countries | -0.5% | North America, Europe, and Australia, with emerging awareness in Asia-Pacific | Long term (≥ 4 years) |
| Source: Mordor Intelligence | |||
Prevalence of peanut allergies in certain countries
Peanut allergies are becoming an increasing concern for the processed peanut market, both globally and regionally. The prevalence of peanut allergies has been rising worldwide, affecting approximately 1.5 to 3% of children globally, which has turned it into a significant public health issue as of 2024 data of Frontiers Org[4]. This growing issue has led many foodservice operators and restaurant chains in allergy-sensitive regions to remove peanut-based items from their menus, reducing opportunities for on-premise consumption. Furthermore, the lack of uniform allergen-labeling regulations across different countries adds another layer of complexity for manufacturers. They are required to manage a higher number of product variations (SKUs) to comply with these regulations, which increases operational challenges and reduces cost efficiencies.
Increasing consumer preference for allergen-free foods
Consumer demand for allergen-free foods is increasingly impacting the processed peanut market. Many individuals and institutions, such as schools, airlines, and food-service operators, are opting to avoid peanut-based products to minimize the risk of allergic reactions. This trend has led to a reduction in the use of peanuts in everyday settings. To address this shift, manufacturers are exploring alternatives like sunflower seed or pea protein spreads, which help them comply with allergen-free requirements and reduce the risk of cross-contamination. While some brands are transitioning to allergen-free production facilities to cater to this demand, they face challenges such as higher production costs and logistical complexities. Despite these efforts, peanut-based products are becoming less favorable in markets where allergen-free options are prioritized, creating a need for innovation and adaptation within the industry.
*Our forecasts treat driver/restraint impacts as directional, not additive. The impact forecasts reflect baseline growth, mix effects, and variable interactions.
Segment Analysis
By Product Type: Flavored Variants Outpace Plain Formats
Plain peanuts made up 52.18% of processed peanut sales in 2025, primarily due to their affordability and frequent use in daily cooking, especially in the Asia-Pacific region. Their mild and neutral flavor makes them highly versatile, allowing manufacturers to use them in various applications such as roasting, confectionery, and food-service products. This adaptability ensures consistent demand across both retail and business-to-business (B2B) markets. Plain peanuts are widely used as peanut ingredients in snacks, bakery products, and ready meals, making them a stable and essential component of the processed peanut market
Flavored processed peanuts are expected to grow at a faster pace, with a projected CAGR of 5.41% through 2031, compared to the 4.05 percent growth forecasted for plain peanuts. This growth is largely driven by increasing consumer interest in bold and innovative flavors, such as spicy, sweet, smoky, and fusion-inspired options. Companies are adopting advanced technologies like gas chromatography flavor mapping to develop new and trend-aligned products more efficiently. By frequently introducing new flavors and positioning these products as premium offerings, flavored peanuts are becoming a key driver of market growth, attracting consumers who seek variety and enhanced taste experiences.

By Form: Roasted Formats Gain on Convenience Demand
Whole peanuts accounted for 60.78% of the processed peanut market in 2025, driven by their popularity as a snack and their extensive use in food processing. Their minimal processing requirements and widespread availability make them a cost-effective choice for both consumers and businesses. Whole peanuts are commonly used in traditional recipes, trail mixes, and confectionery products, making them a versatile ingredient. This adaptability ensures their steady demand across various regions and market segments, maintaining their position as the leading category in the processed peanut market.
The roasted peanut segment is expected to grow at a 6.12% CAGR through 2031, supported by advancements in roasting technologies. Innovations like radiofrequency roasting systems have improved energy efficiency and ensured consistent quality, enhancing the flavor and texture of roasted peanuts. These improvements allow manufacturers to offer premium products that appeal to consumers seeking high-quality snacks. As these technologies become more widely adopted, the roasted peanut segment is likely to experience sustained growth, driven by increasing consumer preference for flavorful and convenient snack options.
By Application: Non-Food Segments Accelerate
In 2025, food applications accounted for 85.43% of the processed peanut market, driven by their widespread use in various sectors, including processing, HoReCa (hotels, restaurants, and catering), and retail. Peanuts are commonly used in products such as ready meals, sauces, bakery items, and premium snack packs, ensuring steady demand throughout the year. Their versatility enables manufacturers to enhance the texture, flavor, and stability of food products, making peanuts a vital ingredient in various categories. This consistent demand has solidified food applications as the largest and most dependable segment of the market.
Non-food applications are expected to grow rapidly, with a projected CAGR of 6.39% from 2026 to 2031, as demand rises in high-value industries. Peanut-based oils and extracts are increasingly used in cosmetics and personal care products due to their natural and multifunctional properties. Innovations in extraction techniques and sustainable practices, such as upcycling, are making these ingredients more appealing to companies looking for eco-friendly, plant-based alternatives. As these applications expand into sectors such as beauty, wellness, and industrial uses, non-food applications are expected to play a larger role in driving the market’s growth.
Geography Analysis
Asia-Pacific contributed 36.85% of the processed peanut market value in 2025, driven by its strong peanut production and significant export activities. Countries like India and China play a key role, with India exporting large volumes of peanuts to nations such as Indonesia and Vietnam. The region's growing urban population is fueling demand for flavored and value-added peanut products, while plain peanuts remain popular among budget-conscious consumers. This mix of affordability and evolving consumer preferences ensures that the Asia-Pacific region remains a dominant player in the global market.
North America is expected to grow at the fastest rate, with a CAGR of 5.39% through 2031, supported by a well-established snacking culture and increasing demand from the food-service industry. Companies in the region are focusing on sustainability by adopting regenerative farming practices to ensure a stable supply chain. Investments in production capacity and innovations in roasted and value-added peanut products are boosting market growth. Despite challenges like weather-related production disruptions, North America continues to strengthen its position as a key growth driver in the processed peanut market.
Europe shows steady demand for processed peanuts, supported by their use in snacks, bakery products, and food-service applications. However, the region's strict safety and quality regulations require suppliers to adhere to high standards, increasing production costs. At the same time, emerging markets in the Middle East and premium segments in Asia-Pacific, such as Japan and Singapore, are creating new opportunities. These markets are willing to pay a premium for organic and allergen-controlled peanut products, allowing suppliers to balance between affordable offerings and high-value niches to drive global growth.
Regulatory Landscape
Regulation for processed peanuts focuses on food safety controls for low-moisture foods, allergen communication, and product-specific standards that shape formulations and labeling. In the United States, FDA standards of identity for peanut butter (21 CFR 164.150) set compositional boundaries that influence recipe design for mainstream retail spreads. The peanut sector also operates under quality and handling requirements tied to aflatoxin risk management (USDA, 7 CFR Part 996), including testing and positive lot identification practices that affect domestic movement as well as imports.
Across exporting regions, compliance is reinforced through recognized preventive programs and export procedures. In India, APEDA export procedures require peanut processing units to implement Good Hygienic Practices and HACCP aligned with CAC/RCP 55-2004 for the prevention and reduction of aflatoxin contamination, which feeds directly into processor audit readiness and documentation. Separately, the FDA Human Foods Program listed 2026 priority deliverables that include work toward a federal definition for ultra-processed foods following a 2025 request for information, a development that keeps labeling and product-positioning choices for flavored and coated peanut snacks under close attention.
Value Chain Analysis
The processed peanut value chain begins with farm production and aggregation (often through origin markets and buying points), followed by cleaning, shelling, blanching/splitting, and grading before value-added processing such as roasting, seasoning/coating, grinding into pastes and butters, and oil extraction. Quality control runs across each stage, with aflatoxin management and low-moisture food safety practices driving investments in sorting and verification (for example, optical or hyperspectral sorting), alongside controlled storage to protect product quality before distribution. Integrated ingredient and food networks, including those operated by Archer Daniels Midland (ADM), support consistent supply into food manufacturers, private label, and foodservice.
Downstream, processed peanuts are supplied through multiple channels, including retail snack packs and spreads, plus B2B offtake into food processing and HoReCa. Logistics sensitivity to port and freight conditions makes major trade nodes, including Rotterdam, Hamburg, Savannah, and Houston, relevant to global movement. Short-term disruptions in producing regions can translate quickly into availability and price volatility; in the United States, drought-driven pressure and 2026 harvest delays were cited as affecting yields and freight dynamics, tightening the timing window for processors running high-throughput roasting and packing lines. Institutional purchasing also supports baseline demand, illustrated by May 2026 government purchases that brought the 10-month total for the 2025-2026 cycle to 21.58 million pounds of peanut butter and 388,800 pounds of roasted peanuts, linking upstream processors to public procurement volumes.
Competitive Landscape
The processed peanut market is moderately fragmented. This indicates a balance between large global snack companies and smaller regional processors that have strong local distribution networks. Competition is intense in areas such as roasting, seasoning, and creating value-added products. Larger companies are gaining an edge by investing in automation, acquisitions, and improving their supply chains. However, regional processors still hold a significant share due to their ability to source locally and cater to specific market needs.
Major players in the market are strengthening their position through strategic investments, expanding production capacity, and focusing on innovation. For example, Hormel’s acquisition of Hampton Farms highlights how larger companies are consolidating roasting operations to enhance efficiency and reduce costs. Advanced technologies, such as AI-driven optical sorters and modern roasting equipment, are helping these companies achieve better product consistency and lower energy consumption. Flavor innovation remains a key focus, with premium products targeting younger consumers. Multinational companies are also leveraging their diverse product portfolios to introduce more peanut-based snacks across various channels.
New opportunities are emerging in areas like allergen-controlled production facilities, upcycled peanut byproducts, and faster flavor development. Companies that can provide allergen-safe, traceable, and clean-label products are better positioned to meet stricter food safety regulations. At the same time, the use of peanut skins and other byproducts to create antioxidant-rich extracts is opening up high-margin, non-food applications. However, rising costs related to technology, compliance, and allergen management are driving further consolidation in the market. This trend is likely to widen the gap between innovation-driven market leaders and smaller processors that rely on outdated systems.
Processed Peanut Industry Leaders
-
Hormel Foods
-
PepsiCo Inc.
-
John B. Sanfilippo & Son
-
The Kraft Heinz Company
-
Archer Daniels Midland Company
- *Disclaimer: Major Players sorted in no particular order
Market Opportunities and Future Outlook
Opportunities are widening where processors can combine compliance-grade food safety with differentiated product design and channel-specific specifications. Branded snack innovation continues to support premiumization and flavor-led SKUs, while institutional buyers, including K-12 and healthcare, use multi-year supply agreements with defined origin and roasting profiles, creating room for processors that can provide traceability, consistent sensory targets, and reliable volumes. On the supply side, modernization and resilience investments by major players signal capacity and capability upgrades, including Hormel Foods disclosing plans to invest USD 50 million in peanut processing technology, tied to improvements in technology and climate-resilient supply chains.
A second opportunity is moving beyond mainstream snack and spread formats into higher-margin non-food uses that value functional oils and extracts, aligning with the report scope where non-food applications are the fastest-growing segment within processed peanuts. Meanwhile, shifting consumption indicators support faster SKU turnover in retail and convenience channels; Peanut Buying Point Association market monitoring cited a 41.7% increase in peanut snack usage in May 2026 versus May 2025, reinforcing near-term relevance for seasoned and value-added formats. As processors adapt, whitespace remains for allergen-controlled and audit-ready production setups that reduce cross-contact risk and simplify customer onboarding across regulated, high-scrutiny channels.
Recent Industry Developments
- June 2026: Hormel Foods launched PLANTERS Ranch Seasoned Peanuts and PLANTERS Sweet Cayenne BBQ Seasoned Peanuts exclusively at Walmart. The launch expands the peanut snack portfolio and strengthens vertical integration with a major retailer, boosting the premium and seasoned peanut segment footprint.
- May 2026: Premium Peanut announced grand opening of a new peanut shelling facility in Santee, South Carolina. The expansion increases processing capacity in a key US peanut region and expands the regional supply chain and processing capability to support growing demand for shelling and value added products.
- April 2026: Ferrero commenced production of Nutella Peanut at its Franklin Park, Illinois facility following a 75 million investment, creating 50 new jobs. The move brings peanut based spread production to a US facility and reduces logistics costs while strengthening Nutella Peanut branding in North America.
Research Methodology Framework and Report Scope
Market Definition and Coverage
For this study, the processed peanut market covers peanuts that are value-added through steps like cleaning, sorting, roasting, flavoring, and size reduction, and then sold for food and selected non-food uses in packaged or bulk formats.
Scope exclusions: We exclude farm-gate raw peanut cultivation value and focus on post-harvest processed products traded and consumed through commercial channels.
Segmentation Overview
- By Product Type
- Plain
- Flavored
- Salted
- Sweet
- Spicy
- Others
- By Form
- Whole
- Diced
- Roasted
- Others
- By Application
- Food
- Food Processing
- HoReCa
- Retail
- Non-Food
- Cosmetics and Personal Use
- Animal Feed
- Others
- Food
- By Geography
- North America
- United States
- Canada
- Mexico
- Rest of North America
- South America
- Brazil
- Colombia
- Chile
- Peru
- Argentina
- Rest of South America
- Europe
- United Kingdom
- Germany
- France
- Italy
- Spain
- Poland
- Belgium
- Sweden
- Rest of Europe
- Asia-Pacific
- China
- Japan
- India
- Australia
- Indonesia
- South Korea
- Thailand
- Singapore
- Rest of Asia-Pacific
- Middle East and Africa
- South Africa
- Saudi Arabia
- United Arab Emirates
- Nigeria
- Egypt
- Morocco
- Turkey
- Rest of Middle East and Africa
- North America
Data Sources, Market Sizing, and Validation
Desk Research
Desk research starts with building the supply and demand setting for processed peanuts in each major geography, then sanity checking growth against measurable public indicators. Common references include USDA for production and usage, FAOSTAT for crop and yield trends, UN Comtrade for trade flows, and Codex Alimentarius and FDA materials for food safety and labeling context (including allergen rules and quality expectations).
To connect these signals to market value, we also review company filings and investor materials for product mix cues, along with trade association updates and credible press on pricing cycles and capacity additions. In a few places, paid subscriptions are used to speed up company financial intelligence, patent searches related to processing and flavoring, and shipment-level import or export checks when public tables are too aggregated. The sources listed here are illustrative only, and we also reviewed other public datasets and documents for collection, cross-checking, and clarification.
Primary Interviews and Surveys
Primary inputs are gathered through expert interviews and structured surveys with processors, ingredient buyers, distributors, and downstream users in snacks and food manufacturing, which helps close gaps that desk sources do not explain well. We also ask how pricing is set (spot versus contract), what quality specifications drive premiums (for example, aflatoxin compliance and high-oleic preferences), and how demand shifts by channel, with coverage spread across key producing and consuming regions so assumptions are not shaped by one market only.
Distribution of primary research fieldwork respondents
| Company type | Respondent position | Region |
|---|---|---|
| Top tier: 39% | CXOs: 15% | APAC: 49% |
| Mid tier: 44% | Functional/Unit leaders: 32% | EMEA: 31% |
| Smaller Players: 17% | Managers: 53% | Americas: 20% |
Market-Sizing & Forecasting
The core sizing uses a top-down approach where production and trade data are used to reconstruct an addressable processed-peanut demand pool by geography, then translated into value using realistic price bands. Before totals are finalized, we sanity check the output using selective bottom-up approximations, such as sampled supplier revenue splits, channel checks for bulk versus packaged movement, and simple average selling price (ASP) times volume tests in high-consumption countries.
Key model inputs include peanut production and crush availability, processed output shares versus in-shell trade, import and export direction by product form, typical processing yield loss, and average realized prices by product type and level of processing (roasted and flavored usually price differently than plain). Because forecasts can swing with crop cycles and price resets, we apply scenario analysis anchored to expected harvested area and yield trends, with demand adjustments informed by interview-based views on snack consumption, reformulation, and non-food use stability. Where bottom-up visibility is weak in fragmented markets, we use conservative penetration assumptions and then compare them back to trade and consumption signals, so the final number remains explainable.
Data Validation & Update Cycle
Validation is handled through triangulation across independent signals, then variance checks at the country and regional level so outliers are flagged early. If a modeled swing is not supported by trade movement, production direction, or price behavior, we revisit the assumptions, adjust the driver set, and then re-test the change against interview feedback.
Before sign-off, the work goes through a multi-step analyst review where calculations are re-performed and key inputs are traced back to their source series. Reports are refreshed annually, with interim updates when material events occur, such as major crop disruptions, large capacity changes, or sharp currency moves. Right before delivery, a final pass is completed so clients receive the latest updated view available at that time.
Mordor Intelligence's Processed Peanut Market Size Compared With Other Published Estimates
Published market sizes for processed peanuts often do not align because teams do not count the same product coverage, they apply different price points, and they refresh assumptions on different timelines, which changes the starting value.
The benchmark table shows a spread, and in Mordor Intelligence's model we count only processed peanut value (roasted, flavored, whole or reduced forms), while farm-gate raw crop value and some adjacent peanut-derived ingredients are kept outside the scope. That scope boundary shifts totals even when the growth direction looks similar.
Benchmark comparison
| Source | Market Size | Gaps in Research Methodology |
|---|---|---|
| Mordor Intelligence | USD 115.47 B (2025) | |
| Industry Association A | USD 128.90 B (2025) | Uses a broader basket that can blend processed peanuts with some peanut ingredient streams and byproducts, and it often applies averaged value per ton across multiple grades which lifts the price base. |
| Global Consultancy B | USD 104.20 B (2025) | Leans on a narrower trade-led view that undercounts domestic processing sold within producing countries, and it can lag on price updates when contracts reset after crop season changes. |
Taken together, differences mainly come down to scope boundaries and how prices are applied to volumes, followed by how quickly inputs are refreshed after crop and currency moves. By tying the value build to observable production and trade signals and then checking it with practical channel and pricing inputs from interviews, we end up with a balanced number that can be repeated and explained step by step.
Key Questions Answered in the Report
What is the current value of the processed peanut market?
The market is valued at USD 120.57 billion in 2026 and is projected to reach USD 149.61 billion by 2031.
How fast is North America growing compared with other regions?
North America is forecast to expand at a 5.39% CAGR, making it the fastest-growing region through 2031.
Which product type is gaining share the quickest?
Flavored peanuts are advancing at a 5.41% CAGR, outpacing plain formats thanks to bold seasonings and premium positioning.
Why are roasted formats becoming more popular in food-service?
HoReCa operators prefer roasted peanuts because they cut kitchen labor and guarantee consistent flavor, underpinning a 6.12% CAGR.