
Process Automation And Instrumentation Market Size and Share
Market Overview
| Study Period | 2020 - 2031 |
|---|---|
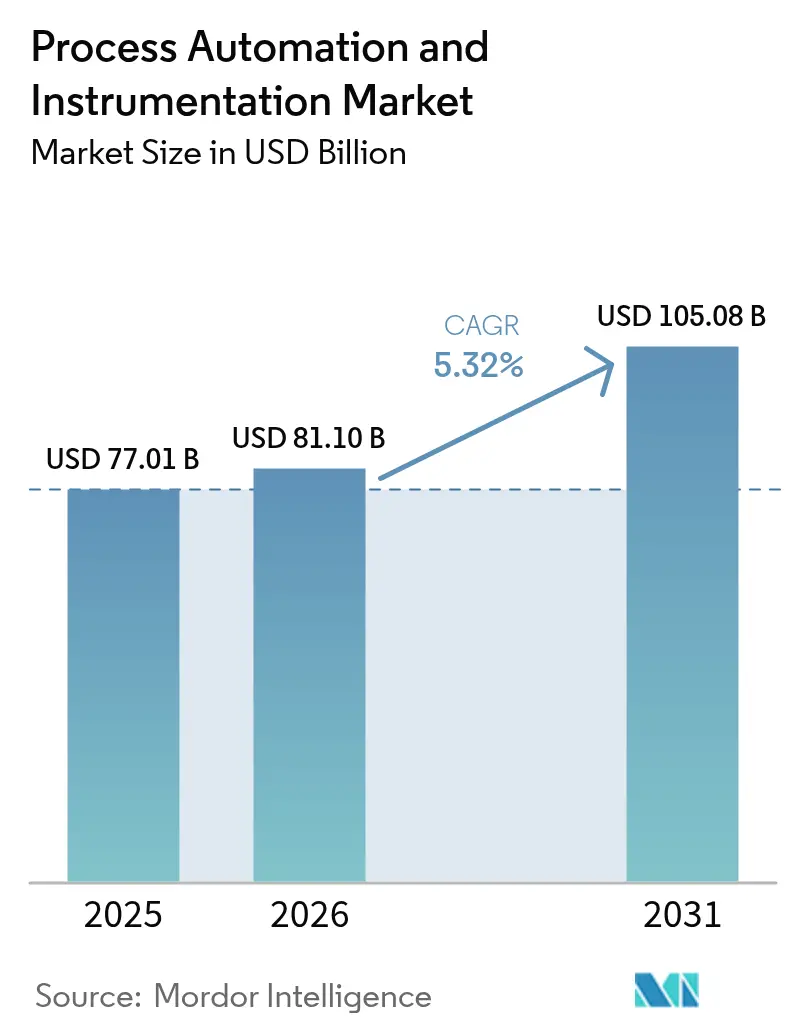
| Market Size (2026) | USD 81.1 Billion |
| Market Size (2031) | USD 105.08 Billion |
| Growth Rate (2026 - 2031) | 5.32 % |
| Fastest Growing Market | Middle East and Africa |
| Largest Market | Asia Pacific |
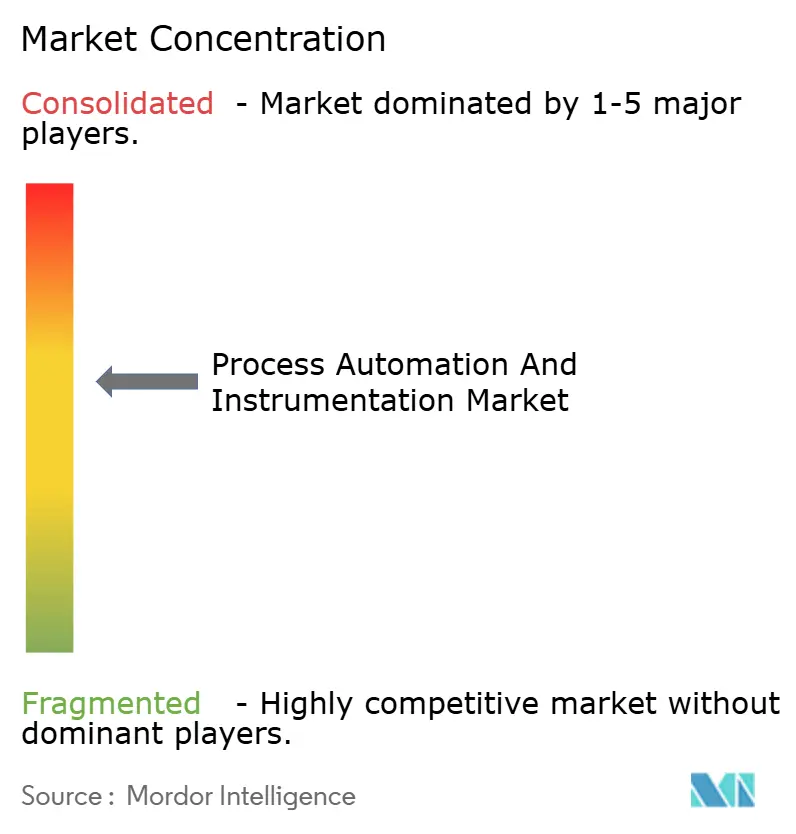
| Market Concentration | Medium |
Major Players *Disclaimer: Major Players sorted in no particular order Image © Mordor Intelligence. Reuse requires attribution under CC BY 4.0. | |
Process Automation And Instrumentation Market Analysis by Mordor Intelligence
The process automation and instrumentation market size in 2026 is estimated at USD 81.10 billion, growing from 2025 value of USD 77.01 billion with 2031 projections showing USD 105.08 billion, growing at 5.32% CAGR over 2026-2031. Rising capital expenditure in energy-intensive sectors, the drive to meet stricter emission rules, and the push for fully digital plants continue to underpin demand. Suppliers are leveraging electrified control valves, Ethernet-APL devices, and AI-enabled analytics to help operators cut fugitive emissions, shorten batch cycles, and unlock predictive maintenance. Geopolitically driven reshoring in North America and Europe is accelerating brownfield retrofits, while hydrogen and carbon capture projects are opening greenfield opportunities in the Middle East and Africa. Semiconductor lead-time volatility and the widening OT-cyber skills gap temper near-term installation velocity; yet, the overall investment outlook remains positive as industry budgets shift from hardware refreshes to software-defined architectures.
Key Report Takeaways
- By instrument type, field instruments led with a 43.62% revenue share in 2025, whereas control valves are projected to grow at the fastest rate, with a 6.52% CAGR through 2031.
- By solution, programmable logic controllers captured 22.05% of the process automation and instrumentation market share in 2025; advanced process control systems are poised to have the highest CAGR of 7.74% from 2025 to 2031.
- By end-user industry, oil and gas accounted for 28.74% demand in 2025, while pharmaceuticals and biopharma are expanding at a 7.18% CAGR to 2031.
- By geography, the Asia-Pacific region accounted for 37.12% of 2025 revenue; the Middle East is forecast to register the fastest regional CAGR of 6.63% through 2031.
Note: Market size and forecast figures in this report are generated using Mordor Intelligence’s proprietary estimation framework, updated with the latest available data and insights as of 2026.
Market Trends and Insights
Drivers Impact Analysis of Process Automation And Instrumentation Market*
| Driver | (~) % Impact on CAGR Forecast | Geographic Relevance | Impact Timeline |
|---|---|---|---|
| Tightening global emission norms propelling advanced process controls adoption | +1.2% | Global; early gains in EU, North America | Medium term (2-4 years) |
| Rapid migration from conventional DCS to modular, scalable IIoT-ready platforms in Asia | +0.9% | APAC core; spill-over to MEA | Short term (≤ 2 years) |
| Shift toward predictive maintenance in hybrid process industries across Europe | +0.7% | Europe; expanding to North America | Medium term (2-4 years) |
| Growing brown-field digital retrofits in North-American mid-stream oil and gas | +0.6% | North America; selective adoption in Middle East | Short term (≤ 2 years) |
| Mandated functional-safety (IEC 61511) compliance in high-hazard chemical plants (Middle East) | +0.4% | Middle East and North Africa | Long term (≥ 4 years) |
| Renewable-power-driven hydrogen projects triggering new instrument demand (Africa) | +0.3% | Africa; early gains in South Africa, Egypt | Long term (≥ 4 years) |
| Source: Mordor Intelligence | |||
Tightening Global Emission Norms Propelling Advanced Process Controls Adoption
Governments now link operating permits to real-time visibility of volatile-organic-compound and greenhouse-gas releases, making continuous emission monitoring systems mandatory for chemical and refining sites. The EU Industrial Emissions Directive compels operators to adopt best-available abatement techniques as part of integrated pollution prevention, a requirement that has accelerated investment in digital valves, high-speed analyzers and multivariable smart transmitters. Emerson’s zero-emission electric dump valves lowered energy draw from 96 W to 1.2 W per unit while removing methane venting at Laramie Energy wells, illustrating immediate compliance and cost benefits. The United States Environmental Protection Agency has tightened reporting accuracy thresholds, pushing operators toward platforms that integrate control logic, historian and automated report generation. Firms that lag in upgrades risk escalating penalties and curtailed throughput, shifting advanced controls from discretionary to essential spend.[1]
Rapid Migration from Conventional DCS to Modular, Scalable IIoT-Ready Platforms in Asia
Price-competitive local vendors and China’s “intelligent manufacturing” programs have shortened product life cycles for legacy distributed control systems. New platforms, such as Rockwell Automation’s PlantPAx 5.0, combine TÜV-certified cybersecurity, built-in analytics, and universal device bundling, which can cut engineering hours by up to 30%. Mitsubishi Electric’s dedicated “LingLing” line targets tier-2 factories seeking affordable upgrades, reinforcing a switch to hardware-agnostic, software-centric architectures. According to Assembly magazine, 53% of Asian factories expect to operate autonomously by 2040, far ahead of their Western peers, which magnifies the immediate demand for IIoT-ready controls.[2]
Shift Toward Predictive Maintenance in Hybrid Process Industries across Europe
Dow Chemical trained 150 personnel on SAP-based asset-health dashboards that use machine-learning models to flag failure modes weeks ahead, cutting emergency repairs and spare-parts spend by up to 40%. European initiatives promoting industrial symbiosis drive cross-plant data-sharing, enabling predictive scheduling that minimizes lost production windows. Operators increasingly pair digital twins with process control simulators to rehearse maintenance scenarios without halting production, reinforcing the shift from reactive to condition-based strategies.
Growing Brown-field Digital Retrofits in North-American Mid-stream Oil and Gas
North-American operators have proven that targeted sensor upgrades, cloud historians and edge-based analytics can lift throughput without new pipelines. A San Juan Basin pilot boosted gas production by 4 MMcf/d using integrated digital automation, validating retrofit economics in mature assets. Kongsberg Digital’s mid-stream twin-platform aggregates SCADA, GIS and corrosion data to provide single-pane visibility, lowering annual maintenance budgets while reducing spill risk.
Restraints Impact Analysis of Process Automation And Instrumentation Market*
| Restraint | (~) % Impact on CAGR Forecast | Geographic Relevance | Impact Timeline |
|---|---|---|---|
| Cyber-security certification bottlenecks delaying large-scale IIoT roll-outs | –0.8% | Global; acute in North America and EU | Short term (≤ 2 years) |
| Skilled workforce shortage for advanced process control tuning in emerging Asia | –0.6% | APAC emerging markets; spill-over to MEA | Medium term (2-4 years) |
| Fragmented legacy infrastructure raising total cost of ownership in Europe | –0.4% | Europe; selective impact in North America | Long term (≥ 4 years) |
| Extended semiconductor lead-times constraining PLC and DCS supply chains | –0.7% | Global; severe in automotive and electronics | Short term (≤ 2 years) |
| Source: Mordor Intelligence | |||
Cyber-security Certification Bottlenecks Delaying Large-Scale IIoT Roll-outs
ISA/IEC 62443 assessment cycles add six-to-twelve months to mega-projects, demanding exhaustive penetration tests for every network segment. Water utilities juggling NIS2 compliance find budgets stretched by third-party audits and “zero-trust” deployments, delaying sensor connectivity upgrades. Frontiers research notes limited plug-and-play security frameworks, widening gaps between security policy and real-world adoption.
Skilled Workforce Shortage for Advanced Process Control Tuning in Emerging Asia
Kelly Services estimates just 9 qualified automation candidates per open position, despite median salaries above USD 72,000. A systematic review of Industry 4.0 adoption shows South-Asian manufacturers battling training costs and job-security concerns, slowing ramp-up of model-predictive controllers that need domain expertise to retune loops across variable feedstocks. Vendors are rolling out virtual academies, yet the three-to-five-year learning curve keeps the constraint material through mid-decade.
*Our forecasts treat driver/restraint impacts as directional, not additive. The impact forecasts reflect baseline growth, mix effects, and variable interactions.
Process Automation And Instrumentation Market Segment Analysis
By Instrument:
Field Instruments Drive Market FoundationField instruments captured 43.62% of 2025 revenue, forming the essential measurement layer that feeds higher-level controls across refining, chemicals, and power. Pressure, temperature, and level transmitters now feature embedded diagnostics that flag sensor drift and wiring faults, reducing troubleshooting hours. Control valves, expected to expand at a 6.52% CAGR to 2031, benefit from electrification that removes compressed-air losses while enabling torque-dense actuation. Emerson’s acquisition of Flexim broadened its ultrasonic flowmeter line, signalling deeper consolidation around multi-parameter sensing. Analytical gas and liquid analyzers incorporate AI classifiers that slash false alarms, and the Endress+Hauser–SICK partnership extends global lifecycle support for process analyzers. Ethernet-APL, capable of 10 Mbps over 1 km intrinsically safe cabling, is now a default spec in green-field bids. These upgrades keep the process automation and instrumentation market in a cycle of intelligent-edge expansion.
The instrument landscape is converging on “sensor-as-a-service” models, where diagnostics, firmware, and calibration certificates are pushed directly from vendor clouds to distributed control systems. Flowmeter multiplexing platforms reduce cabinet footprints, while optical analyzers shrink sample systems and lower purge-gas costs. In water and wastewater, smart pressure transducers interface directly with cloud SCADA, enabling predictive leak detection. Such integration propels vendor lock-in yet simplifies lifecycle cost tracking, reinforcing the central role of field devices in overall plant optimisation.


By Solution:
PLC Leadership Faces APC DisruptionProgrammable logic controllers held a 22.05% share in 2025, but their primacy is challenged by 7.74% CAGR growth in advanced process control as plants adopt AI-driven, closed-loop optimisation. Emerson’s DeltaV Platform now bundles SCADA, MES, and historian layers, blurring traditional tier boundaries. Safety-instrumented-system demand rises in tandem with IEC 61511 audits at Middle East chemical complexes. Siemens’ Simatic Automation Workstation eliminates hardware PLC racks, consolidating logic, HMI, and edge gateways in industrial PCs. Honeywell’s Digital Cognition suite introduces generative AI co-pilots that reduce operator procedure build time by 80%. The solution stack is coalescing into platform licenses that capture multi-year software revenue, a structural shift shaping the future mix of the process control and instrumentation process automation and instrumentation market.
Integrated asset-performance-management, data-ops, and edge-analytics modules are now packaged with control licences, ensuring a seamless workflow from loop tuning to remote vibration analysis. Ethernet-APL gateways bridge plant floor and ERP backbones, enabling near-real-time production costing. As supply-chain fragility elevates hardware lead times, software-defined logic gains favour by decoupling application development from I/O marshalling—an arrangement that will sustain APC momentum through the decade.
By End-user Industry:
Oil and Gas Maturity Contrasts Pharma InnovationOil and gas remained the largest buyer with a 28.74% share in 2025. Upstream facilities focus on methane-sniffer networks and electrified valve retrofits, while mid-stream operators deploy cloud SCADA twins to optimise linepack and reduce unplanned downtime. Downstream refineries invest in model-predictive controllers that tighten crude-to-distillate yields amid volatile energy markets. By contrast, pharmaceuticals and biopharma post the highest 7.18% CAGR, accelerated by FDA guidance supporting continuous manufacturing and process analytical technology. Pharma 4.0 roadmaps prioritize modular skids with integrated real-time release testing, which requires spectrum analyzers, micro-flowmeters, and autonomous clean-room control loops.
Chemicals and petrochemicals modernise heat-integrated reactors via soft-sensor-equipped APC, improving energy intensity metrics. Power-generation segments upgrade distributed controls to integrate battery storage and hydrogen co-firing. Water utilities, having allocated more than USD 530 million to “smart water” projects in 2024, continue rolling out ultrasonic meters and AI leak analytics. Across sectors, the push toward Scope 1 emission cuts and circular-economy supply chains ensures that every industry vertical extends sensor density and analytics depth, sustaining long-term growth for the process automation and instrumentation market.

Geography Analysis
APAC Process Automation And Instrumentation Market
Asia-Pacific generated 37.12% of 2025 revenue and remains the prime production hub for mid-range PLCs, smart valves and embedded IPCs. Chinese authorities subsidise industrial-Ethernet chipsets, helping local OEMs undercut imports and accelerating vendor consolidation. India, Vietnam and Indonesia expand discrete and hybrid manufacturing corridors, boosting demand for scalable, IIoT-ready control architectures. Regional governments also tighten particulate-matter caps, spurring uptake of laser gas analyzers and high-range differential-pressure transmitters. This combination of price-sensitive buyers and stricter regulations positions APAC as both volume and innovation leader for the process automation and instrumentation market.
MEA Process Automation And Instrumentation Market
The Middle East is projected to register the fastest 6.63% CAGR to 2031, as Gulf states channel sovereign funds into blue- and green-hydrogen value chains. The adoption of IEC 61511-mandated safety-instrumented systems across petrochemical clusters propels orders for SIL-rated transmitters and emergency shutdown valves. Egypt’s multibillion-dollar green-hydrogen projects in the Suez Canal Economic Zone signal Africa’s southern expansion of process instrumentation demand. South Africa’s Green Hydrogen Atlas identifies over 30 potential hubs, creating fresh bids for flow, pressure and gas-chromatograph packages.
The Americas and Europe Process Automation And Instrumentation Market
North America emphasises brown-field retrofits that integrate edge analytics into existing DCS, unlocking quick returns without lengthy shutdowns. Federal funding for infrastructure electrification sparks control upgrades in water, wastewater and chemical batch plants. Concurrently, stringent cyber-security rules drive investment in zero-trust firewalls and certificate-managed gateways delaying some IIoT projects yet expanding spend on secure remote-access modules. Europe, with its legacy infrastructure and decarbonisation mandates, channels budgets toward migration toolkits that link PROFIBUS nodes to Ethernet-APL spurs. The region also champions predictive-maintenance pilots, fostering demand for self-learning APC packages in chemicals, cement and steel mills. South America remains an emerging play; Chile’s lithium brine processing and Brazil’s bio-ethanol complexes illustrate latent growth potential tied to decarbonisation financing.

Regulatory Landscape
Regulation is increasingly shaping both what gets instrumented and how automation assets are secured across their lifecycle. In Europe, Regulation (EU) 2024/2847 (Cyber Resilience Act) entered into force on December 10, 2024, creating product cybersecurity obligations that cascade to industrial components such as PLCs, HMIs, gateways, and connected field devices. Reporting obligations start on September 11, 2026, with full application of essential requirements from December 11, 2027. In the United States, NIST SP 800-82 Rev. 3 is widely used as an operational technology security baseline referenced in industrial cyber programs, reinforcing security-by-design expectations that can add time and cost to large IIoT rollouts already constrained by ISA/IEC 62443 certification cycles noted by end users.
On the industrial policy side, China elevated Industrial Internet platform modernization with MIITs Action Plan for High-Quality Development of Industrial Internet Platforms (2026-2028) released on January 13, 2026, and MOFCOMs AI + Industrial Internet Collaborative Empowerment Action Plan (2025-2027), targeting upgrades across 5,000 enterprises. Alongside functional safety enforcement in hazardous process industries under IEC 61511 and emissions-linked permitting practices described in the report context, these programs raise demand for secure connectivity, traceable data capture, and audit-ready control and instrumentation stacks. In the Middle East, government-led automation initiatives such as the Dubai Robotics and Automation Program (with a stated goal of 9% GDP contribution and 200,000 robots by 2032) further anchor modernization budgets that pull through sensors, control systems, and industrial networking.
Value Chain Analysis
The value chain spans semiconductor and component inputs (power semiconductors, microcontrollers, sensors, radios), instrument and control hardware manufacturing (field instruments, control valves, analyzers, PLC/DCS/SCADA hardware), platform software (APC, historians, asset performance and predictive maintenance), and systems integration, commissioning, and lifecycle services. Semiconductor availability remains a gating factor for PLC and DCS deliveries, while cybersecurity certification and OT skill gaps extend commissioning timelines and increase the role of integrators and vendor professional services. Digital plant programs are also shifting procurement from standalone devices toward platform licenses and bundled software modules, tightening vendor ecosystems around device management, analytics, and secure remote access.
Recent supply-side moves point to efforts to secure critical inputs and compress lead times through regional manufacturing and embedded supply chain intelligence. In July 2026, Infineon opened its Smart Power Fab in Dresden to expand power semiconductor and analog/mixed-signal capacity, and Bosch advanced its silicon carbide roadmap at Roseville, California as part of a USD 2 billion investment, both relevant to power and control electronics used across automation portfolios. On the software and procurement layer, Siemens partnered with Xometry in May 2026 to embed AI-native supply chain intelligence into Siemens Xcelerator, supporting faster sourcing of mechanical and electronic components, while Siemens and IFS (June 2026) targeted closed-loop digital twins linking engineering, execution, and enterprise asset history. Together, these moves reinforce the shift from hardware-led deliveries to lifecycle-oriented, data-driven automation stacks.
Competitive Landscape
The process control and instrumentation market is moderately concentrated, with the top five suppliers Emerson, ABB, Honeywell, Schneider Electric and Siemens collectively estimated at about 55% revenue share. Emerson’s USD 7.2 billion AspenTech buyout accelerates its pivot to a software-centric, recurring revenue model and embeds advanced hybrid-model engines into its DeltaV and Ovation lines. ABB’s 2025 acquisition of Siemens’ Chinese wiring-accessories arm widens its regional footprint to 230 cities, demonstrating continued inorganic expansion to secure channel access. Honeywell’s Field PKS generative-AI update reduces equipment downtime by 25% and procedure drafting effort by 80%, signalling a pivot toward cognitive automation platforms that defend margins amid rising component commoditisation.
Strategic themes include cloud-edge convergence, safety-compliance specialisation and vertical-specific application packages. Schneider Electric earmarks USD 700 million for U.S. energy-transition and AI projects, underscoring the race to embed analytics at the point of control. Smaller software firms exploit platform openness to deliver AI model libraries and low-code orchestration apps, encroaching on incumbents’ differentiation. Meanwhile, component scarcity shifts bargaining power to suppliers owning silicon roadmaps, albeit prompting OEMs to redesign boards around broadly available microcontrollers.
Price-based rivalry intensifies in entry-level transmitters and PLC mini-racks where APAC brands leverage scale and government incentives. Conversely, specialised SIL-3 valves, subsea-rated actuation and AI-augmented APC licenses command premium pricing and sticky service contracts. White-space opportunities abound in hydrogen electrolyzer control, battery-material processing and carbon-capture plants—segments demanding ultra-high-purity instrumentation and high-frequency closed-loop control.
Process Automation And Instrumentation Industry Leaders
-
ABB Limited
-
Emerson Electric Co.
-
Schneider Electric SE
-
Siemens AG
-
Honeywell International Inc.
- *Disclaimer: Major Players sorted in no particular order
Process Automation And Instrumentation Market Companies Covered in this Report
- ABB Ltd
- Emerson Electric Co.
- Honeywell International Inc.
- Mitsubishi Electric Corp.
- Rockwell Automation Inc.
- Schneider Electric SE
- Siemens AG
- Yokogawa Electric Corporation
- General Electric Company
- Eaton Corporation plc
- Omron Corporation
- Bosch Rexroth AG
- Phoenix Contact GmbH
- Metso Automation
- Endress+Hauser Group
- FANUC Corporation
- Fuji Electric Co., Ltd.
- Advantech Co., Ltd.
- Hitachi, Ltd.
- National Instruments Corp.
- Delta Electronics Inc.
- Pepperl+Fuchs SE
- KROHNE Messtechnik GmbH
- Belden Inc.
Read Analysis of Process Automation And Instrumentation Companies
Market Opportunities and Future Outlook
A key opportunity sits where emissions compliance, functional safety, and secure connectivity intersect. Operators need auditable, real-time data capture from field instruments through control systems and reporting layers. The report context already links operating permits to real-time visibility of VOC and GHG releases, and it highlights IEC 61511 audits as a driver of safety-instrumented system demand in high-hazard facilities. Taken together, these requirements create whitespace for integrated offerings that combine smart transmitters/analyzers, digital valves, APC, historians, and automated compliance reporting, delivered with built-in security controls aligned to common frameworks (for example, NIST SP 800-82 in the United States and forthcoming CRA obligations in Europe). The near-term constraint of ISA/IEC 62443 certification cycles also increases demand for pre-certified architectures and managed security services that can shorten project schedules.
A second opportunity is non-disruptive modernization of brownfield plants through open, software-defined architectures that reduce shutdown time and decouple application logic from I/O refresh cycles. Evidence for this shift shows up in both vendor actions and end-user pain points: Schneider Electric launched Industrial Automation Modernization as a Service in June 2026, built on HPE SimpliVity and compatible with IEC 61499. Emersons Project Beyond (May 2025) also positioned software-defined modernization with zero-trust principles. In parallel, large-scale government programs in China (MIITs 2026-2028 Industrial Internet platform plan and MOFCOMs AI + Industrial Internet plan targeting 5,000 enterprise upgrades) create implementation volume for IIoT-ready controls, industrial networking, and analytics. This supports opportunities for scalable PLC/DCS migrations, Ethernet-APL connectivity, and asset health software in APAC supply chains and export-oriented process industries.
Recent Industry Developments in Process Automation And Instrumentation Market
- July 2026: ABB announced the acquisition of Rotork Plc for approximately USD 5.5 billion, expanding its electrification and automation portfolio into a broader installed base of actuation and related field assets. The deal strengthens ABBs position in valve and actuator adjacencies that influence control-valve modernization, service pull-through, and installed-base lifecycle revenue across process industries.
- June 2026: Schneider Electric announced a definitive agreement to acquire Cognite Holding B.V. for USD 3.1 billion in an all-cash transaction to deepen its industrial data, AI, and software capabilities. The move reinforces the market shift toward software-centric automation stacks where contextualized operational data underpins APC, predictive maintenance, and emissions reporting workflows.
- May 2025: Emerson launched Project Beyond, a software-defined enterprise operations platform integrating AI orchestration and a zero-trust security architecture to modernize industrial automation technology stacks without disrupting existing systems. By emphasizing modernization-in-place, it aligns with brownfield retrofit priorities where operators seek faster upgrades to control, historian, and reporting layers while limiting downtime.
Process Automation And Instrumentation Market Report Scope and Research Methodology
Market Definition and Coverage
This market is defined as the revenues earned from products and systems used to measure, control, and optimize continuous industrial processes, starting at the sensor and valve level and extending to plant control and supervisory software used in operations.
Scope exclusions: Excludes discrete-factory automation that is mainly tied to assembly-line robotics and motion control where it is not used for process-industry control loops.
Segments Covered in This Report
- By Instrument
- Field Instruments
- Pressure Transmitters
- Temperature Transmitters
- Level Transmitters
- Flow Meters
- Control Valves
- Pneumatic Control Valves
- Electric Control Valves
- Hydraulic Control Valves
- Analytical Instruments
- Gas Analyzers
- Liquid Analyzers
- Field Instruments
- By Solution
- Advanced Process Control (APC)
- Distributed Control System (DCS)
- Human-Machine Interface (HMI)
- Manufacturing Execution System (MES)
- Programmable Logic Controller (PLC)
- Safety Instrumented Systems
- Supervisory Control and Data Acquisition (SCADA)
- Asset Management and Predictive Maintenance Software
- Industrial Communication and Networking Solutions
- By End-user Industry
- Oil and Gas
- Chemicals and Petrochemicals
- Pharmaceuticals and Biopharma
- Food and Beverage
- Power Generation and Utilities
- Water and Wastewater Treatment
- Metals and Mining
- Pulp and Paper
- Semiconductor and Electronics
- By Geography
- North America
- United States
- Canada
- Mexico
- Europe
- United Kingdom
- Germany
- France
- Italy
- Rest of Europe
- Asia-Pacific
- China
- Japan
- India
- South Korea
- Rest of Asia-Pacific
- Middle East
- Israel
- Saudi Arabia
- United Arab Emirates
- Turkey
- Rest of Middle East
- Africa
- South Africa
- Egypt
- Rest of Africa
- South America
- Brazil
- Argentina
- Rest of South America
- North America
Data Sources, Market Sizing, and Validation
Desk Research
Desk research was used to build the first structure of the model and to make sure we start from realistic industrial activity indicators. We referred to public sources such as the US Energy Information Administration for energy and refining indicators, the International Energy Agency for global industrial energy and emissions context, and the US Geological Survey for mining and metals activity signals.
To anchor end-market demand, we also used sources such as the US Census Bureau for manufacturing output series, the World Bank for macro indicators and investment trends, and trade and customs releases that signal instrumentation and control equipment imports and exports. Company filings, investor presentations, and reputable press were reviewed to understand product mix and regional exposure. A paid subscription covering company financials and another covering patent databases were used selectively to cross-check segment direction. These examples are not exhaustive, and many other public documents and datasets were also used for data collection, validation, and clarification.
Primary Interviews and Surveys
Primary work focused on confirming what is actually shipped and installed in process plants, then translating that into value using realistic pricing and replacement cycles. We spoke with a mix of automation suppliers, channel partners, EPC-linked experts, and plant-side users across APAC, EMEA, and the Americas, so assumptions around project timing, retrofit rates, and service attach levels could be checked and adjusted.
Distribution of primary research fieldwork respondents
| Company type | Respondent position | Region |
|---|---|---|
| Top tier: 34% | CXOs: 12% | APAC: 45% |
| Mid tier: 49% | Functional/Unit leaders: 34% | EMEA: 34% |
| Smaller Players: 17% | Managers: 54% | Americas: 21% |
Market-Sizing & Forecasting
Sizing starts with a top-down build where process-industry capex and operating intensity are translated into an addressable spend pool for field instruments, control valves, analyzers, and control and supervisory systems, which is then allocated by region and end-use using adoption and replacement patterns. To keep the totals realistic, selective bottom-up checks are run, including sampled ASP times shipment volume for common instruments, channel checks on control-system project sizes, and supplier revenue mix tests. The model is tuned when the ranges do not reconcile.
Key inputs used in the model include project activity in oil and gas, chemicals, and power, plant modernization and safety compliance cycles, installed base refresh rates for control systems, average selling price movement for common instrumentation categories, and regional trade signals for control and measurement equipment. Where direct value signals are weak for a niche category, gaps are handled through proxy intensity factors (for example, instrument density per process unit) that were reviewed with practitioners before final use.
For forecasting, scenario analysis is used to translate different capex and utilization paths into demand outcomes, and then exponential smoothing is applied to stabilize short-term volatility in project timing. Assumptions on pricing and upgrade cadence are revisited with interview feedback so the forecast stays tied to what plants are likely to approve and execute.
Data Validation & Update Cycle
Validation is done through multiple checks so the output is not dependent on a single data series. We compare results with independent signals such as manufacturing output direction, energy and refining activity, and trade movement in relevant equipment categories, then investigate any sharp variance by geography or end-use before sign-off.
A second analyst review is completed to re-check key drivers, year-to-year movement, and any step changes created by assumptions. The report is refreshed annually, and interim updates are triggered when major events materially change capex plans, supply availability, or pricing. Before delivery, a final pass is run to incorporate the latest public indicators and any new expert feedback collected during the update window.
Mordor Intelligence's Process Automation and Instrumentation Market Size Compared Against Other Published Estimates
Published market sizes for process automation and instrumentation can look different even when the topic sounds the same, because the counted product basket and the year used as the starting point are not always aligned. Differences also show up when one study leans more on capex cycles and installed base behavior, and another leans more on revenue rollups without the same end-use filters.
Discrete automation hardware that is mainly used for factory assembly work sits outside Mordor Intelligence's scope, and that single inclusion choice can move totals upward in sources that blend process and factory automation together. Other common gap drivers are whether services and software are counted as full contract value or only as recurring revenue, how pricing is converted across currencies and years, and how often the assumptions are refreshed when project pipelines change.
Benchmark comparison
| Source | Market Size | Gaps in Research Methodology |
|---|---|---|
| Mordor Intelligence | USD 77.01 B (2025) | |
| Global Consultancy A | USD 79.96 B (2025) | Uses a different base-year build and may roll in a wider automation basket across industries, with pricing and services treated at a broader contract level, which can lift the near-term total. |
| Industry Publisher B | USD 79.52 B (2025) | Leans on a separate forecast window and may apply more optimistic project timing and modernization assumptions, with less transparency on how replacements versus new builds are split by end-use. |
The comparison shows a tight cluster around 2025, but the spread is explained by what is counted and how it is converted into value. By tying the market to process-industry demand signals, installed base refresh behavior, and clear category inclusions, the model stays repeatable and easier to audit when users test assumptions year by year.
Key Questions Answered in the Report
What is the current size of the process automation and instrumentation market?
The market reached USD 81.10 billion in 2026 and is projected to rise to USD 105.08 billion by 2031 at a 5.32% CAGR over 2026-2031.
Which region leads the process automation and instrumentation market?
Asia-Pacific holds the largest 37.12% revenue share, driven by widespread factory automation and competitive local suppliers.
Which instrument type is growing fastest?
Control valves show the highest growth, with a forecast 6.52% CAGR through 2031 due to electrification and tighter emission mandates.
Why are advanced process control systems gaining momentum?
Manufacturers adopt them to cut energy use, enable predictive maintenance and meet stricter regulatory reporting, driving an 7.74% CAGR in this solution category.
What is the main restraint facing large-scale IIoT roll-outs?
Cyber-security certification under ISA/IEC 62443 adds six-to-twelve months to project timelines, delaying connectivity upgrades.
How significant is the workforce skills gap?
Industry needs around 290,000 automation roles globally, but only 9 qualified candidates are available per opening, slowing advanced control-system deployment, particularly in emerging Asia.