
Pressure Vessel Market Size and Share
Market Overview
| Study Period | 2021 - 2031 |
|---|---|
| Market Size (2026) | USD 63.52 Billion |
| Market Size (2031) | USD 79.23 Billion |
| Growth Rate (2026 - 2031) | 4.52 % |
| Fastest Growing Market | Asia Pacific |
| Largest Market | Asia Pacific |
| Market Concentration | Medium |
Major Players *Disclaimer: Major Players sorted in no particular order Image © Mordor Intelligence. Reuse requires attribution under CC BY 4.0. | |
Pressure Vessel Market Analysis by Mordor Intelligence
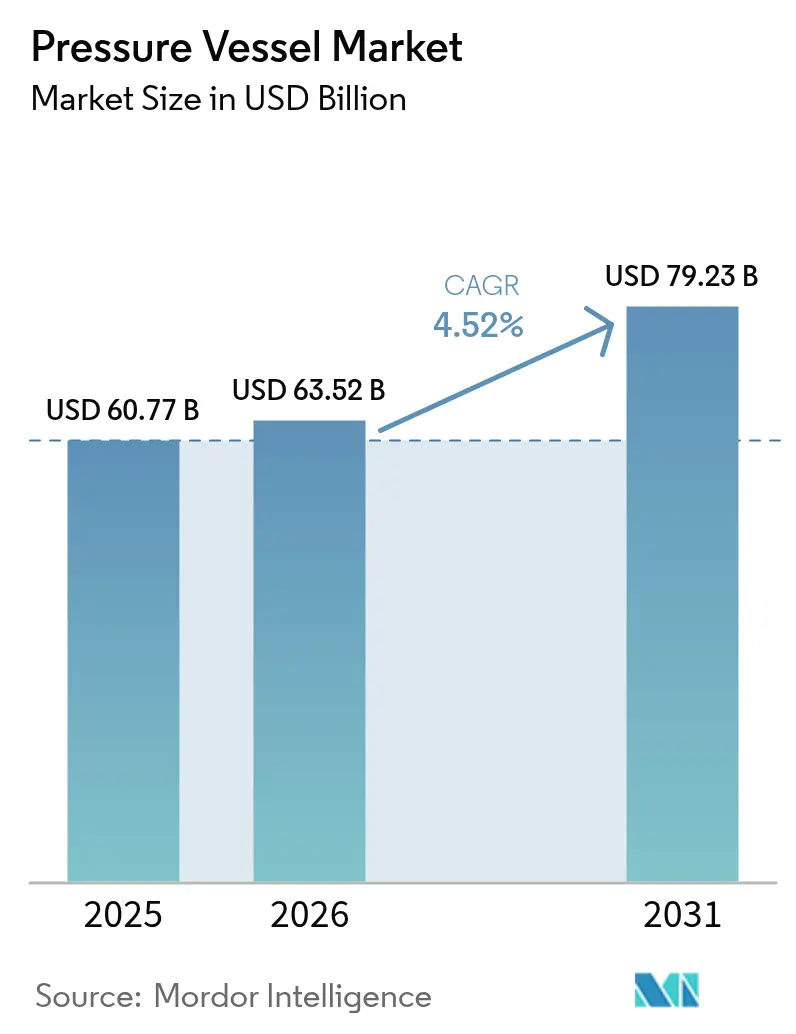
The Pressure Vessel market size is expected to grow from USD 60.77 billion in 2025 to USD 63.52 billion in 2026 and is forecast to reach USD 79.23 billion by 2031 at 4.52% CAGR over 2026-2031.
Energy-infrastructure modernization, Asia-Pacific nuclear construction, and hydrogen-economy investments are reshaping demand profiles. Composite overwrapped pressure vessels (COPVs) lead the technology shift because weight-to-strength advantages enable hydrogen mobility and space applications. Ultra-high-pressure ratings above 100 bar expand quickly as fuel-cell vehicles and supercritical chemical processing become mainstream. The pressure vessel market also benefits from tougher safety standards such as ASME, PED, and API 510, which accelerate replacement cycles and favor certified manufacturers. At the same time, volatile steel prices, skilled-labor shortages, and lengthy certification cycles weigh on profitability, nudging producers toward composites and automation.
Key Report Takeaways
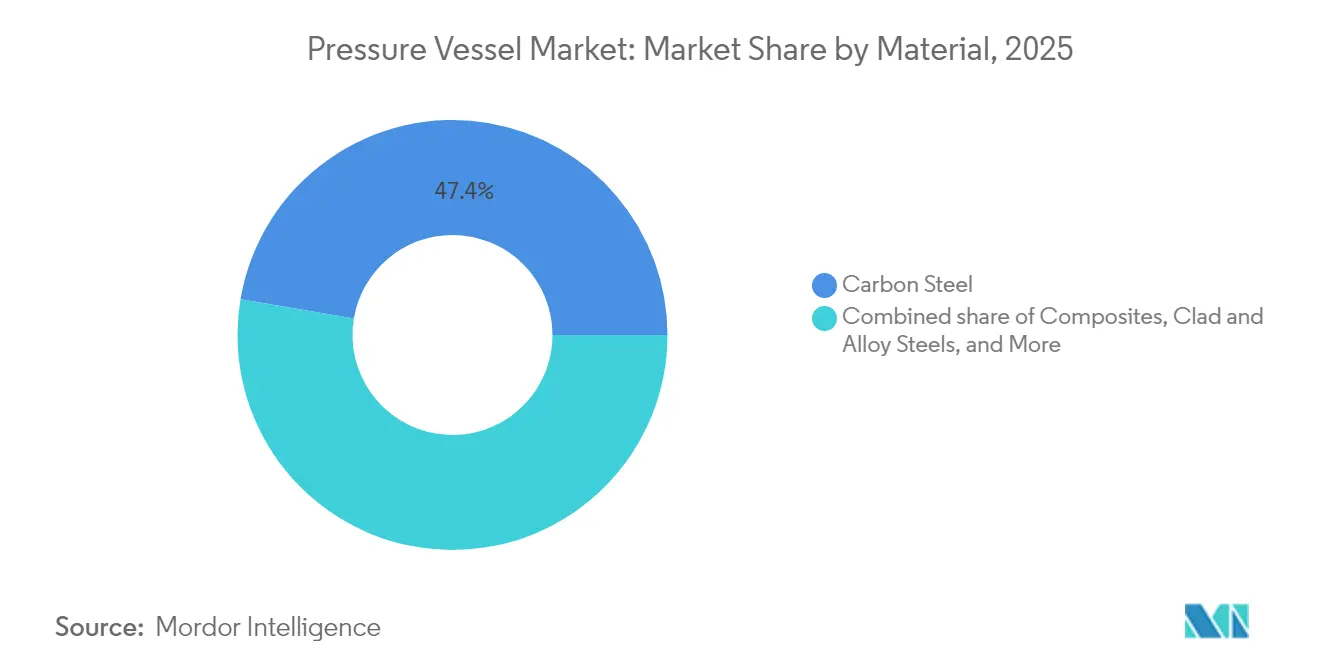
- By material, carbon steel held 47.35% pressure vessel market share in 2025, while composites recorded the highest projected CAGR at 7.05% through 2031.
- By pressure rating, the 0 to 10 bar (low) segment captured the largest share of 40.60% in 2025, while vessels above 100 bar captured 7.20% of incremental growth, eclipsing all other brackets between 2025 and 2031.
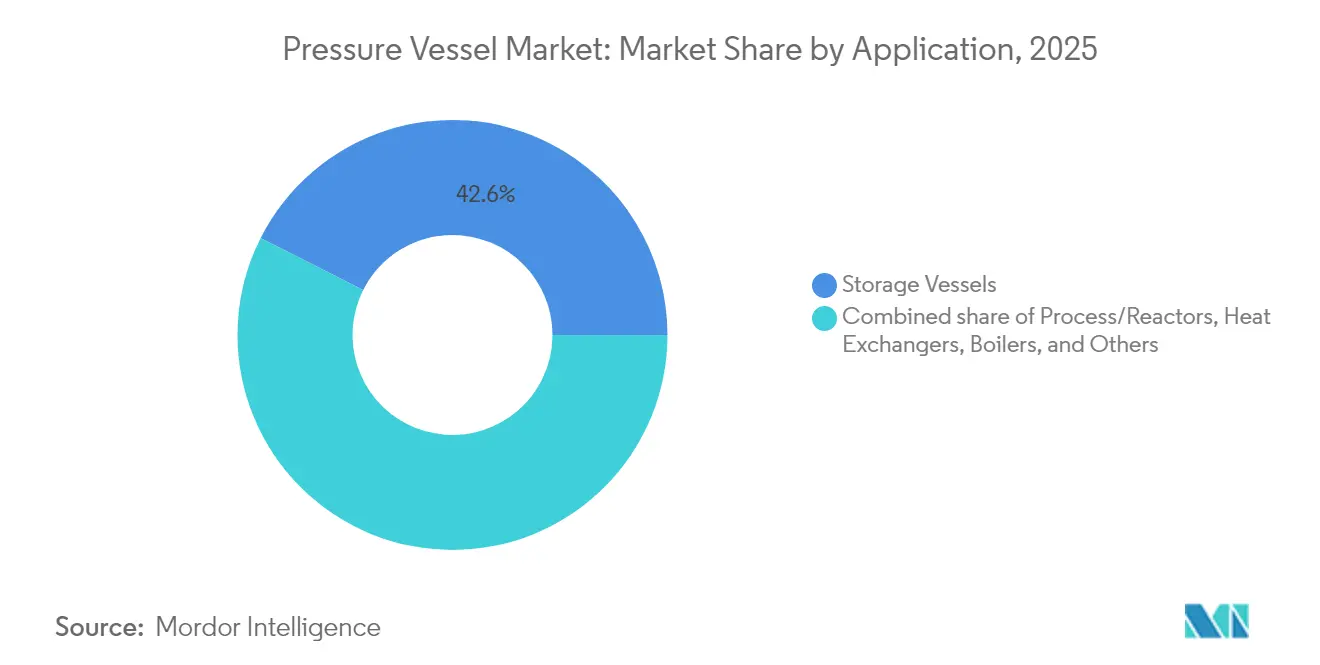
- By application, storage accounted for 42.55% of the pressure vessel market size in 2025, yet the specialty “Others” category is set to expand at a 6.85% CAGR to 2031.
- By end-user, oil and gas mid/downstream retained 33.45% revenue share in 2025, whereas pharmaceutical and biotech uses are advancing at 7.05% CAGR through 2031.
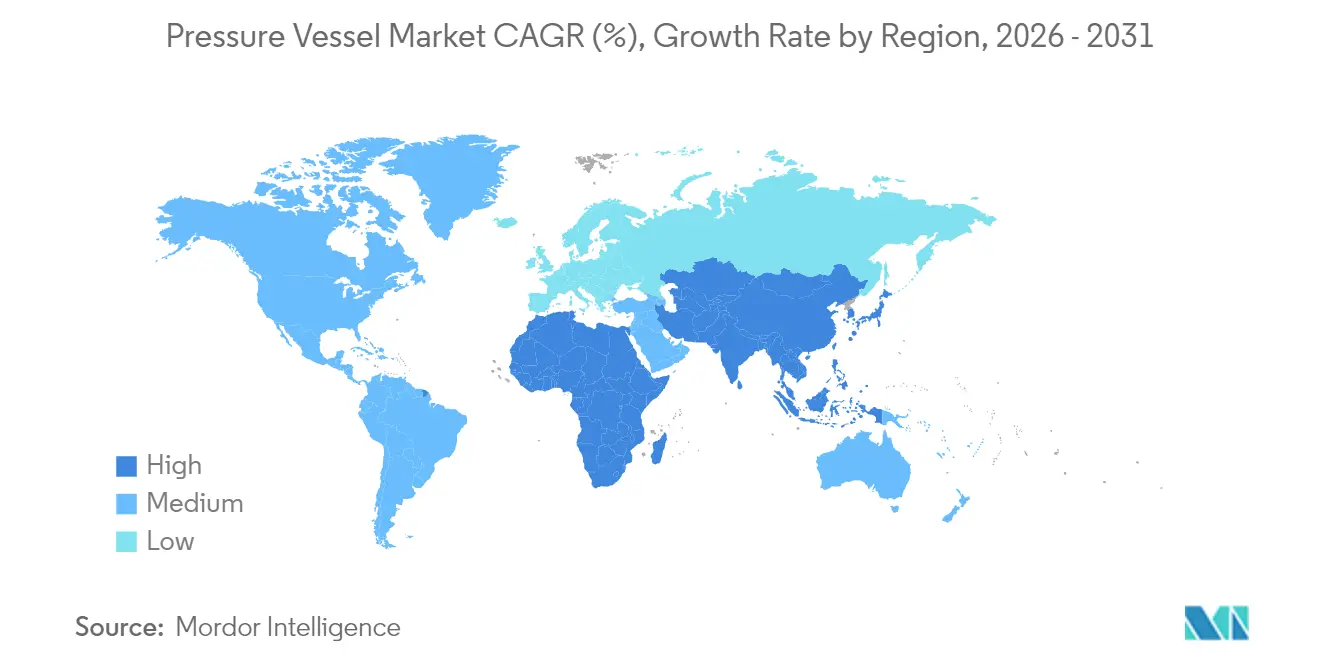
- Asia-Pacific commanded 44.62% of the pressure vessel market in 2025, and it posts the strongest regional CAGR at 6.05% over the forecast window.
Note: Market size and forecast figures in this report are generated using Mordor Intelligence’s proprietary estimation framework, updated with the latest available data and insights as of 2026.
Market Trends and Insights
Drivers Impact Analysis of Pressure Vessel Market*
| Driver | (~) % Impact on CAGR Forecast | Geographic Relevance | Impact Timeline |
|---|---|---|---|
| Energy infrastructure upgrades in emerging economies | +1.20% | Asia-Pacific, Middle East & Africa, South America | Medium term (2-4 years) |
| Rising global LNG trade and associated cryogenic storage demand | +0.90% | Global, focus on North America & Asia-Pacific | Long term (≥ 4 years) |
| Nuclear new-build resurgence in Asia | +0.80% | Asia-Pacific core, spill-over to Europe | Long term (≥ 4 years) |
| Stricter workplace safety regulations | +0.60% | Global | Short term (≤ 2 years) |
| COPV adoption in hydrogen mobility | +0.70% | North America & Europe, expanding to Asia-Pacific | Medium term (2-4 years) |
| Modular small-scale chemical processing skids | +0.50% | Global | Medium term (2-4 years) |
| Source: Mordor Intelligence | |||
Energy Infrastructure Upgrades in Emerging Economies
Asia-Pacific governments accelerate refinery, petrochemical, and power-generation projects that require large quantities of certified vessels; Dongfang Electric’s supply of domestic reactor pressure vessels for Taishan 2 underscores the shift from imports to local fabrication.(1)World Nuclear News, “Construction Milestone at Taishan 2 EPR,” world-nuclear-news.org Industrial parks across India and Southeast Asia specify standardised vessels for combined-cycle plants and LNG terminals, redistributing orders away from traditional Western suppliers. Funding from national development banks shortens project cycles and boosts volume guarantees for regional fabricators. Lower labour costs complement burgeoning technical skills, enabling price-competitive products that comply with ASME and PED codes. This geographic capacity migration adds manufacturing resilience and cost pressure within the pressure vessel market.
Rising Global LNG Trade and Associated Cryogenic Storage Demand
Canada’s first Pacific-coast export cargo to Asia shows North American LNG flows demand hundreds of double-walled stainless-steel vessels that maintain −162 °C temperatures under variable loading. The USD 40 billion LNG Canada plant illustrates the scale, with tanks engineered to manage boil-off gas and cyclic thermal stresses. Vessel complexity grows when integrating onto LNG-fuelled ships and heavy-duty trucks, where weight reduction and vacuum insulation become mission-critical. These technical barriers favour incumbents with proven cryogenic know-how, consolidating market share among specialised suppliers. Long-term offtake contracts reduce volume risk, enabling large backlog visibility for cryogenic vessel manufacturers.
Nuclear New-Build Resurgence in Asia
Japan Steel Works controls 80% of global large-forging capacity used in reactor pressure vessels, anchoring Asia-Pacific leadership.(2)Japan Steel Works, “Nuclear Component Orders Bolster JSW Results,” jsw.co.jp Mitsubishi Heavy Industries has expanded reactor production at Kobe to support domestic restarts and export orders, while Russia’s Atommash now produces four full nuclear-island sets per year after its relaunch. Advanced small modular reactors leverage factory fabrication, standardising vessel designs to cut site labour and schedule risk. Each reactor order commands tens of millions of dollars for a single pressure vessel, making nuclear the highest-value segment of the pressure vessel market. New-build pipelines across China and India, therefore, underpin long-duration demand visibility.
Stricter Workplace Safety Regulations (API 510, PED, ASME)
API 510 inspections require periodic wall-thickness and flaw assessments, prompting early replacement of ageing refinery vessels. The European Pressure Equipment Directive streamlines compliance across 27 member states, but documentation burdens and notified-body audits raise costs that smaller fabricators struggle to absorb. ASME code revisions now include creep-strength-enhanced ferritic steels and additive-manufactured components, widening design options while keeping safety margins ASME.ORG. Firms advertising full-scope compliance gain tender advantages as asset owners treat safety credentials as selection criteria. Collectively, regulation transforms safety from a cost centre into a competitive differentiator within the pressure vessel market.
Restraints Impact Analysis of Pressure Vessel Market*
| Restraint | (~) % Impact on CAGR Forecast | Geographic Relevance | Impact Timeline |
|---|---|---|---|
| Volatile steel prices squeezing OEM margins | -0.80% | Global | Short term (≤ 2 years) |
| Lengthy certification & compliance cycles | -0.60% | North America & Europe | Medium term (2-4 years) |
| Slow commercialisation of Generation IV designs | -0.40% | Global | Long term (≥ 4 years) |
| Scarcity of skilled welders & inspectors | -0.70% | Global, acute in North America & Europe | Medium term (2-4 years) |
| Source: Mordor Intelligence | |||
Volatile Steel Prices Squeezing OEM Margins
European apparent steel consumption shrank for the fourth year in 2024, and new US import tariffs have intensified cost swings.(3)Financial Times, “Tariffs Hit Steel Market Hard as Recession Persists,” ft.com Pressure vessel makers negotiate fixed-price delivery contracts months before plate mills settle quarterly surcharges, creating negative margins when spot prices spike. Some producers accelerate substitution toward composites or duplex stainless grades to mitigate exposure, but code approvals limit rapid changeovers. Working-capital burdens also rise because mills demand quicker payment during tight supply cycles. Thus, price volatility directly constrains profitability in the pressure vessel market.
Lengthy Certification & Compliance Cycles
Document packages for nuclear reactors exceed 2,000 pages and require multi-year review by regulators such as the NRC and EURATOM, delaying revenue recognition for vessel suppliers. Pharmaceutical bioreactors undergo validation testing that can last 18 months before lot release. Smaller entrants find audit costs prohibitive, reinforcing incumbent dominance. Harmonisation efforts between ASME and PED progress slowly, so OEMs must still tailor product dossiers per jurisdiction. These protracted cycles stretch cash flows and restrict new-technology uptake across the pressure vessel market.
*Our forecasts treat driver/restraint impacts as directional, not additive. The impact forecasts reflect baseline growth, mix effects, and variable interactions.
Pressure Vessel Market Segment Analysis
By Material:
Composites Challenge Steel DominanceCarbon steel retained 47.35% share of the pressure vessel market in 2025, thanks to low cost and broad code coverage. However, the composites' pressure vessel market size is projected to rise 7.05% CAGR to 2031 as hydrogen mobility scales production volumes. Stainless steel maintains an evergreen role in food, pharmaceutical, and biotech services, where corrosion resistance justifies its premium price. Clad and alloy steels address high-temperature petrochemical reactors, and aluminium occupies weight-sensitive niches. Composite overwrapped pressure vessels achieve 60% weight reduction at 700 bar service, expanding adoption into transport and stationary storage.
The pressure vessel market responds by retooling filament-winding lines and securing carbon-fibre supply agreements to capture the emerging composite opportunity. Steel fabricators defend their share by adding electropolishing lines and duplex alloys to meet stringent hygiene codes. Material diversification, therefore, intensifies competition, with regulatory approvals acting as both barrier and catalyst. Certifications for composite liners in nuclear service remain elusive, keeping steel dominant in that premium segment but not halting composite encroachment elsewhere.


By Pressure Rating:
Ultra-High Pressure Drives InnovationLow-pressure vessels between 0 and 10 bar held 40.60% of the pressure vessel market share in 2025 across bulk storage and water treatment. The pressure vessel market size for ultra-high-pressure units above 100 bar will rise at a 7.25% CAGR to 2031 because hydrogen tanks and supercritical reactors require extreme ratings. Medium (10-50 bar) and high (50-100 bar) segments provide steady replacements in refining and chemical plants. Hydrogen fuel cell vehicles store at 350-700 bar, so Type 4 tanks become the design default.
Manufacturers targeting this segment invest in autofrettage presses, precision winding, and in-house burst-test rigs to comply with ISO 19881. Cost-per-kilogram of stored hydrogen becomes the competitive metric, driving thinner liners and advanced fibers. Conversely, low-pressure producers focus on modular tank farms and automated rolling lines to preserve margin in commodity markets. This bifurcation underscores how emerging technologies redefine competitive clusters within the pressure vessel market.
By Application:
Storage Dominance Faces Specialty GrowthStorage vessels captured 42.55% revenue in 2025, serving LNG terminals, industrial gases, and petrochemical storage. The “Others” category, including modular chemical-processing skids and cryogenic dewars, expands 6.85% CAGR to 2031, outpacing mainstream reactors and boilers. Cryogenic designs need multilayer insulation and vacuum jackets to manage heat ingress, whereas modular skid vessels prioritise compact footprints and integrated instrumentation.
The pressure vessel market capitalises on this divergence by offering customised skids under framework agreements, capturing design-for-manufacture fees and after-sales spares. High-volume storage suppliers accelerate robotic welding and digital quality records to maintain cost leadership. Over time, knowledge from specialty vessels feeds into standard offerings, fostering incremental innovation across the application spectrum.
By End-User Industry:
Pharma Biotech Accelerates GrowthOil and gas mid/downstream retained 33.45% of revenue in 2025, but pharmaceutical and biotech segments will log a 7.05% CAGR to 2031 as single-use bioreactor scales surpass 4,000 litres. Pressure vessel market size for nuclear power will also rise, given new reactor build programmes, while chemical and petrochemical users sustain baseline demand. Food and beverage applications rely on 300-series stainless steel with mirror finishes to mitigate biofilm, providing steady replacements.
Biotech’s stringent cleaning validation demands electropolished interiors and documentary traceability, raising average selling prices. Vendors, therefore, bundle validation support and GMP audit packages, strengthening lock-in. Conversely, oil and gas customers impose rigid cost disciplines, pressuring margins. The mixed portfolio cushions cyclicality, reinforcing diversified positioning among leading pressure vessel market participants.
Geography Analysis
APAC and North America Pressure Vessel Market
Asia-Pacific held 44.62% of the pressure vessel market in 2025 and is forecast to expand at a 6.05% CAGR through 2031. China’s localisation of nuclear island components and India’s refinery build-outs underpin large order books. Japan Steel Works and Mitsubishi Heavy Industries supply reactor forgings globally, reinforcing regional dominance in high-specification segments. South Korea leverages shipbuilding expertise to produce LNG tanks, and ASEAN economies invest in hydrogen refuelling stations that use 700 bar COPVs. These projects embed long-term manufacturing ecosystems across the region. North America represents a mature yet opportunity-rich landscape. The US aims to raise nuclear capacity from 100 GW in 2024 to 300 GW by 2050, implying that sizable reactor-grade vessel demand and export terminals along the Gulf Coast and British Columbia require cryogenic storage, sustaining specialised vessel orders. Replacement cycles in refineries and stricter OSHA rules create recurring domestic demand, although fabricators face competition from Asian imports on commodity tanks.
Europe Pressure Vessel Market
Europe prioritises decarbonisation, channelling funds into hydrogen infrastructure and small modular reactors. PED harmonisation simplifies cross-border sales but raises compliance thresholds. Steel price volatility and energy costs challenge margins, prompting consolidation among medium-sized fabricators. Scandinavia and Germany pilot Power-to-X plants, adding ultra-high-pressure vessels to local wish lists. Overall, European customers pay premiums for traceable supply chains and carbon-footprint disclosures.
MEA and South America Pressure Vessel Market
Emerging regions such as South America, the Middle East, and Africa show divergent growth arcs. Brazil’s pre-salt fields extend downstream infrastructure, Mexico retrofits refineries, and Argentina eyes shale monetisation. Gulf petrochemical clusters in Saudi Arabia and the UAE commission mega-scale reactors and heat exchangers. African nations pursue modular fertiliser and gasification units, leaning on foreign EPC contractors that bundle imported vessels. Collectively, these areas inject volume upside into the global pressure vessel market, albeit from smaller bases.

Regulatory Landscape
Globally, pressure vessel design, fabrication, inspection, and in-service integrity are governed by a mix of prescriptive and risk-based codes, with ASME BPVC, the EU Pressure Equipment Directive (PED, Directive 2014/68/EU), and API 510 forming key compliance anchors for many cross-border supply chains. A near-term inflection is the 2025 edition of the ASME Boiler and Pressure Vessel Code becoming effective for industry compliance on January 1, 2026. This includes updates to BPVC Section VIII (pressure vessels) and Section X (fiber-reinforced plastic vessels), which affect qualified procedures, documentation, and requalification cycles for both steel vessels and composite constructions.
In Europe, PED conformity is supported through harmonized EN standards, and the European Commission issued Implementing Decision (EU) 2026/79 (January 12, 2026) updating the list of harmonized references, including revisions tied to the EN 13445 series for unfired pressure vessels. In the United States, OSHA maintains standing pressure-vessel safety requirements across general industry, maritime, and construction (29 CFR 1910, 1915, and 1926), reinforcing inspection discipline and documented safe operation, while API 510 practices continue to shape refinery replacement and repair decisions in regulated environments.
Competitive Landscape
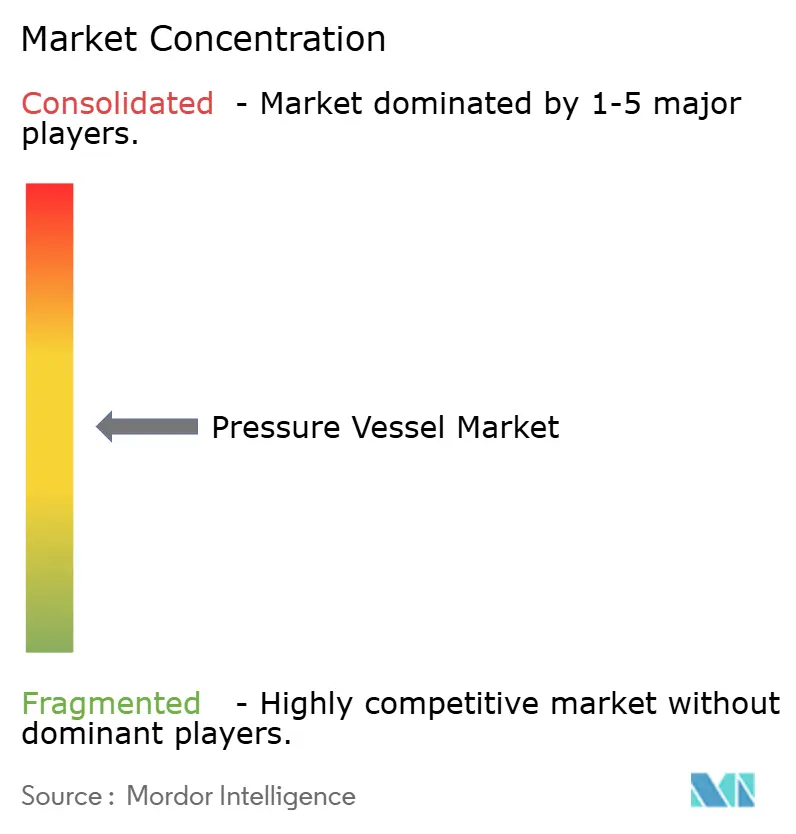
The pressure vessel market is fragmented in overall revenue terms but exhibits pockets of high concentration. Nuclear reactor vessels, for instance, are produced by a handful of ASME-certified suppliers led by Japan Steel Works, which controls 80% of large-diameter forgings. Babcock & Wilcox and Westinghouse focus on boilers and nuclear pressure boundaries, leveraging long-term utility partnerships. By contrast, storage tanks for chemicals and water are served by thousands of regional fabricators that compete largely on price.
Competitive strategies depend on segment focus. Legacy steel shops invest in advanced plasma cutting, robotic welding, and ERP-linked traceability to bolster productivity. Composite specialists develop proprietary resin systems and high-speed towpreg winding to outrun learning curves. Several incumbents acquire composite start-ups to hedge bets, while others form joint ventures in Asia-Pacific to secure local content mandates. Software for digital twin simulations now accompanies vessel bids, offering predictive maintenance as a service, deepening customer stickiness.
Regulatory credentials remain a crucial entry barrier. Nuclear suppliers must meet N stamp, RCC-M, and KTA codes, which take years to achieve. Pharmaceutical vendors maintain ISO 9001 and cGMP certifications audited by regulators. Cryogenic vessel players hold EN 13458 and ADR approvals for transport. The capital and time needed to obtain these badges explain the persistence of established brands in the upper tiers of the pressure vessel market even as new materials widen the field.
Pressure Vessel Industry Leaders
Babcock & Wilcox Enterprises Inc
Doosan Heavy Industries & Construction
Alfa Laval AB
Andritz AG
Larsen & Toubro Limited
- *Disclaimer: Major Players sorted in no particular order
Pressure Vessel Market Companies Covered in this Report
- Babcock & Wilcox Enterprises Inc
- Doosan Enerbility Co. Ltd
- Alfa Laval AB
- Andritz AG
- Larsen & Toubro Ltd
- Ergil (Aager GmbH)
- IHI Plant Services Corp.
- Frames Group BV
- GEA Group AG
- Mitsubishi Heavy Industries Ltd
- CB&I (McDermott)
- Paul Mueller Company
- Halvorsen Company
- Westinghouse Electric Co.
- Hitachi Zosen Corp.
- Keller Technology
- Samuel Pressure Vessel Group
- Toyo Kanso Co.
- Parr Instrument Company
- Pressure Vessel Engineering (PVE)

Market Opportunities and Future Outlook
Hydrogen and cryogenic storage infrastructure is creating higher-specification demand pockets for manufacturers with ultra-high-pressure and low-temperature design capability. In South Korea, Hyundai E&C began a 45-month national R&D program in April 2026 (supported by KAIA/MOLIT) targeting liquid hydrogen storage technologies and infrastructure up to 50,000 m3. Samsung C&T advanced commercialization of a DNV-certified 40,000 m3 liquid hydrogen tank design and, in parallel, is constructing a 30,000-tonne double-walled storage facility at the Samcheok Power Complex, targeted for completion in July 2027. In Japan, Kawasaki Heavy Industries signed a January 2026 contract to build a 40,000 m3 liquefied hydrogen carrier under the NEDO Green Innovation Fund Project, reinforcing demand for cryogenic vessels and associated pressure systems across the LH2 logistics chain.
A parallel white-space is emerging in large-scale underground hydrogen storage and the supporting high-pressure equipment ecosystem. In China, H1 2026 commissioning of a 1.5 million standard cubic meter deep-underground salt cavern hydrogen storage facility in Pingdingshan, Henan included verification of domestically produced 22 MPa diaphragm hydrogen compressors by Sinopec Petrochemical Machinery. This points to procurement pull for high-pressure, hydrogen-compatible components and pressure boundaries. The January 1, 2026 mandatory adoption of the 2025 ASME BPVC also creates an immediate services and upgrade opportunity around re-qualification, documentation modernization, and code-aligned redesign for fabricators and asset owners operating multi-code portfolios across ASME and PED environments.
Recent Industry Developments in Pressure Vessel Market
- June 2026: Alfa Laval signed a contract worth about SEK 1.1 billion to supply pre-treatment technology for Acelen's new biorefinery project in Brazil, a package that includes heat exchangers and separation equipment. The award ties decarbonizing fuels capacity additions to higher-throughput, corrosion-managed process equipment, supporting demand for engineered pressure-containing systems and associated fabrication quality requirements.
- November 2025: Babcock & Wilcox announced an AI data center power generation solution and signed a limited notice to proceed with Applied Digital to design and install one gigawatt of electric power. The move expands near-term boiler and steam system pull-through from non-traditional end users that prioritize rapid deployment and high availability of pressure-boundary equipment.
- July 2024: The Netherlands mapped EUR 56-69 billion in electrolyser and offshore wind investments, bringing hydrogen production and storage infrastructure into a defined capital planning window. That program visibility supports procurement pipelines for high-pressure storage, compression, and balance-of-plant vessels that must meet stringent European conformity and documentation requirements.


Pressure Vessel Market Report Scope and Research Methodology
Market Definition and Coverage
For this study, the market covers revenue earned from pressure vessels that are designed and manufactured to safely contain fluids or gases at pressures above or below ambient, and supplied as new-build equipment for industrial use.
Scope exclusions: We exclude routine aftermarket services, standalone valves and fittings, and general industrial tanks that do not meet recognized pressure-vessel design and compliance requirements.
Segments Covered in This Report
- By Material
- Carbon Steel
- Stainless Steel
- Clad and Alloy Steels
- Composites
- Aluminium and Others
- By Pressure Rating
- 0 to 10 bar (Low)
- 10 to 50 bar (Medium)
- 50 to 100 bar (High)
- Above 100 bar (Ultra-high)
- By Application
- Storage Vessels
- Process/Reactors
- Heat Exchangers
- Boilers
- Others (Custom vessels, Specialty vessels, Expansion vessels)
- By End-User Industry
- Oil and Gas Upstream
- Oil and Gas Mid/Downstream
- Chemical and Petrochemical
- Power Generation
- Food and Beverage
- Pharmaceuticals and Biotech
- Water and Wastewater
- Others
- By Geography
- North America
- United States
- Canada
- Mexico
- Europe
- Germany
- United Kingdom
- France
- Italy
- Russia
- Rest of Europe
- Asia Pacific
- China
- India
- Japan
- South Korea
- ASEAN Countries
- Rest of Asia Pacific
- South America
- Brazil
- Argentina
- Rest of South America
- Middle East and Africa
- Saudi Arabia
- United Arab Emirates
- South Africa
- Egypt
- Rest of Middle East and Africa
- North America
Data Sources, Market Sizing, and Validation
Desk Research
Desk research was used to set the boundaries of what is counted, and to ground assumptions that can be checked year over year. We mainly referenced public safety and design-code context and industry activity signals, such as ASME Boiler and Pressure Vessel Code references, US EIA energy statistics, USGS and other government commodity series (steel and alloy indicators), and trade and production statistics published by agencies such as the US International Trade Commission and UN Comtrade.
To connect demand with end-use build cycles, we also reviewed sources like IEA energy outlook commentary, government tender portals for large plant projects, and company filings and investor decks that discuss capacity additions and capital spending. Where available, paid subscriptions for company financials and news were used to cross-check large order announcements and to time major project ramps. This desk source list is illustrative, and many other public references were also used for data collection, validation, and clarification during the work.
Primary Interviews and Surveys
Primary work focused on validating how pressure vessels are specified and procured across oil and gas, chemicals, and power, since project timing can shift totals quickly. We used expert interviews and short surveys with fabricators, EPC-facing sales teams, inspection and compliance specialists, and end-user maintenance leaders across APAC, EMEA, and the Americas to confirm demand drivers, pricing logic, and regional mix assumptions.
Distribution of primary research fieldwork respondents
| Company type | Respondent position | Region |
|---|---|---|
| Top tier: 34% | CXOs: 13% | APAC: 43% |
| Mid tier: 50% | Functional/Unit leaders: 43% | EMEA: 33% |
| Smaller Players: 16% | Managers: 44% | Americas: 24% |
Market-Sizing & Forecasting
Sizing started from a top-down build that reconstructs demand using end-use plant activity and equipment intensity, and then allocates totals by region and application. The model leans on signals such as refinery and petrochemical capacity additions, LNG and gas-processing project counts, power-generation capex cycles, and typical pressure-vessel replacement patterns in regulated sites. For each major end use, we applied realistic vessel-per-project or vessel-per-capacity factors, and then translated them into value using observed pricing brackets that reflect material choice and fabrication complexity.
The totals were then corroborated through selective bottom-up checks, including sampled ASP x volume estimates from fabricator discussions, channel checks on large project packages, and sanity checks against publicly visible order pipelines. When gaps appeared (for example, when project visibility is weaker in certain countries), assumptions were bridged using regional trade flows, construction starts, and the nearest comparable end-use build cycle, before being revalidated in follow-up calls.
For forecasting, scenario analysis was used because the market is closely tied to project sanctioning and schedule changes. We built a base case and tested upside and downside paths using expected energy and chemicals investment trends, input cost direction (steel and alloy movements), and lead-time and utilization feedback gathered from primary discussions, and then the final forecast path was selected to match the most common expert consensus.
Data Validation & Update Cycle
Outputs were checked through triangulation across independent demand signals, and any large variances were reviewed at the assumption level before sign-off. We also ran anomaly checks on region splits, growth rates, and implied average selling prices so that sudden changes could be traced back to a real project wave, a pricing shift, or a scope boundary.
Before publication, the model and key inputs go through a multi-step analyst review, and respondents are re-contacted when a major assumption moves outside expected ranges. Reports are refreshed annually, with interim updates triggered by material events such as large project cancellations, sharp commodity price moves, or changes in safety and compliance enforcement. Right before delivery, we do a final pass to ensure clients receive the latest updated view.
Mordor Intelligence's Pressure Vessel Market Estimate Compared With Other Published Estimates
It is common to see different market values for pressure vessels because publishers do not always count the same equipment boundaries or time their pricing assumptions the same way. Differences also come from how project-driven demand is treated, since a few delayed megaprojects can move a year's total.
Order pipeline checks, end-use capacity additions, and a spot review of steel and alloy price direction are the evidence used to keep Mordor Intelligence's estimate tied to new-build pressure vessels purchased for oil and gas, chemicals, and power, rather than wider equipment bundles. When other figures roll adjacent items into the total (such as broader tankage or services) or apply aggressive pricing escalation, the number can shift even if underlying unit demand is similar.
Benchmark comparison
| Source | Market Size | Gaps in Research Methodology |
|---|---|---|
| Mordor Intelligence | USD 63.52 B (2026) | |
| Trade Journal A | USD 50.30 B (2023) | Uses an earlier base year and often reflects narrower reported revenue sets, which can undercount large project cycles that were sanctioned later and delivered outside the cut-off. |
| Industry Brief B | USD 35.40 B (2025) | Likely applies a tighter definition or a partial end-use and geography view, and it can also lean on conservative pricing assumptions that do not fully reflect material and fabrication mix shifts. |
Taken together, the spread mainly reflects timing and scope choices more than a disagreement on where demand is coming from. Our approach stays traceable because each region total can be linked back to end-use build activity, checked pricing brackets, and follow-up validation when a major project assumption changes.


Key Questions Answered in the Report
What is the current value of the pressure vessel market?
The pressure vessel market is valued at USD 63.52 billion for 2026 and is expected to reach USD 79.23 billion by 2031, growing at a 4.52% CAGR.
Which region leads the pressure vessel market and why?
Asia-Pacific leads with 44.62% share due to nuclear new-build activity, refinery expansion, and emerging hydrogen infrastructure.
Which material category is growing fastest?
Composite overwrapped pressure vessels are advancing at 7.05% CAGR because their weight savings make them ideal for hydrogen mobility.
How does steel price volatility impact the industry?
Unpredictable steel costs compress OEM margins under fixed contracts, prompting material diversification and composite substitution.
What are the top growth applications?
Ultra-high-pressure hydrogen tanks, cryogenic LNG storage, and modular chemical-processing skids exhibit the highest growth trajectories.
Why are certification cycles considered a restraint?
Nuclear, pharmaceutical, and pressure-code compliance reviews can last multiple years, delaying revenue and raising entry barriers for newcomers.
Page last updated on:


 Your data is secure and never sold or shared.


