
Pressure Labels Market Size and Share
Market Overview
| Study Period | 2020 - 2031 |
|---|---|
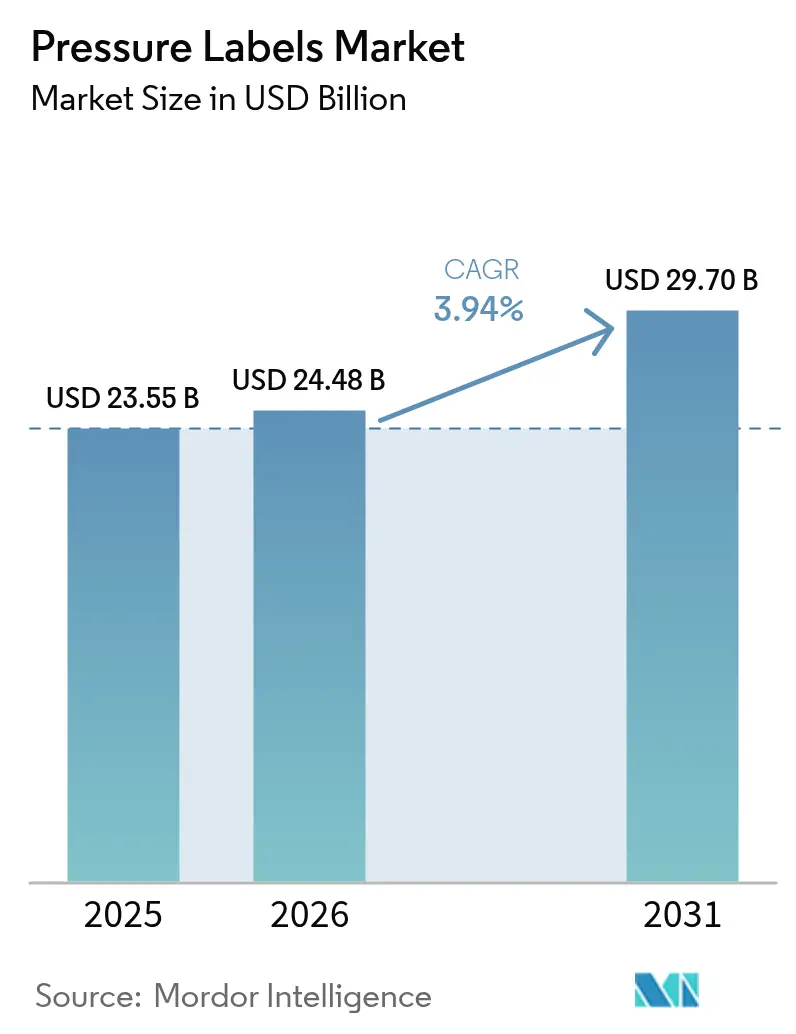
| Market Size (2026) | USD 24.48 Billion |
| Market Size (2031) | USD 29.7 Billion |
| Growth Rate (2026 - 2031) | 3.94 % |
| Fastest Growing Market | Asia Pacific |
| Largest Market | North America |
| Market Concentration | Low |
Major Players *Disclaimer: Major Players sorted in no particular order Image © Mordor Intelligence. Reuse requires attribution under CC BY 4.0. | |
Pressure Labels Market Analysis by Mordor Intelligence
The pressure labels market size is expected to grow from USD 23.55 billion in 2025 to USD 24.48 billion in 2026 and is forecast to reach USD 29.7 billion by 2031 at 3.94% CAGR over 2026-2031. Growth drivers include e-commerce logistics that need durable address and return labels, rapid adoption of digital presses for short-run jobs, and stricter traceability mandates across food and pharmaceutical supply chains. Producers are also accelerating sustainability investments, introducing linerless formats and bio-based adhesives to comply with Extended Producer Responsibility rules. Competitive strategies pivot on vertical integration and regional capacity expansions that reduce lead times for brand owners.
Key Report Takeaways
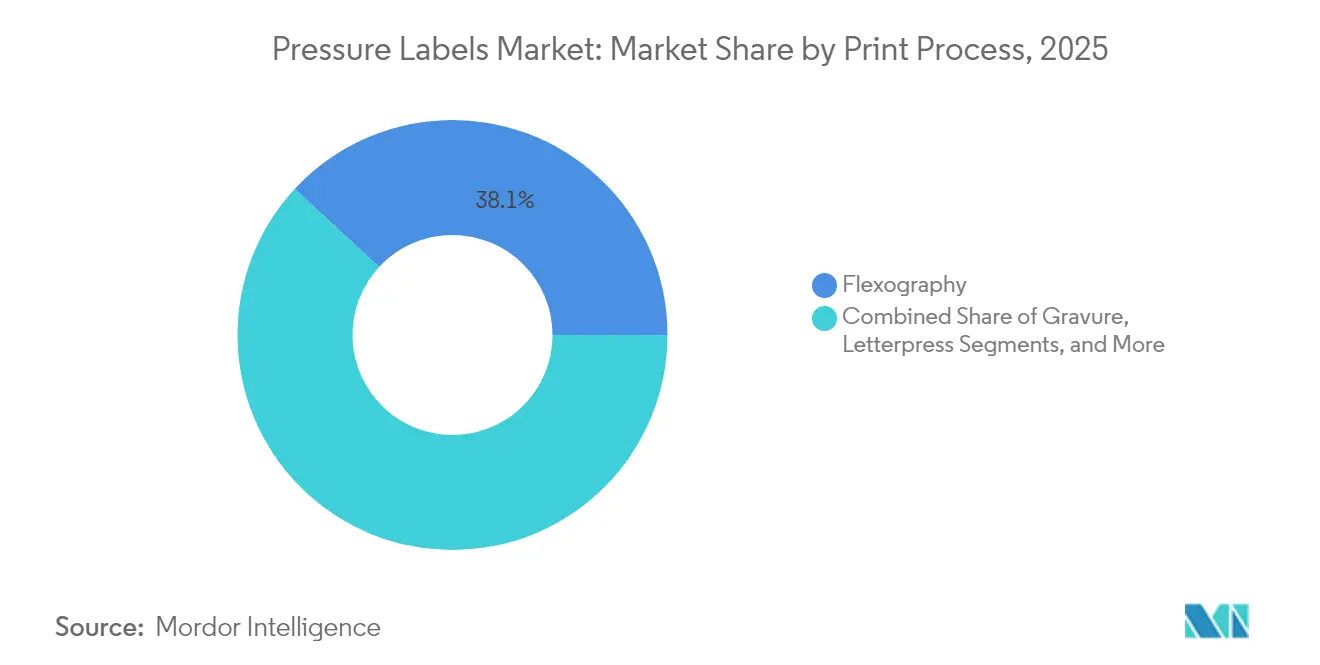
- By print process, flexography accounted for a 38.12% share of the pressure labels market in 2025.
- By end-user, the pressure labels market size for cosmetics is projected to grow at a 5.52% CAGR between 2026-2031.
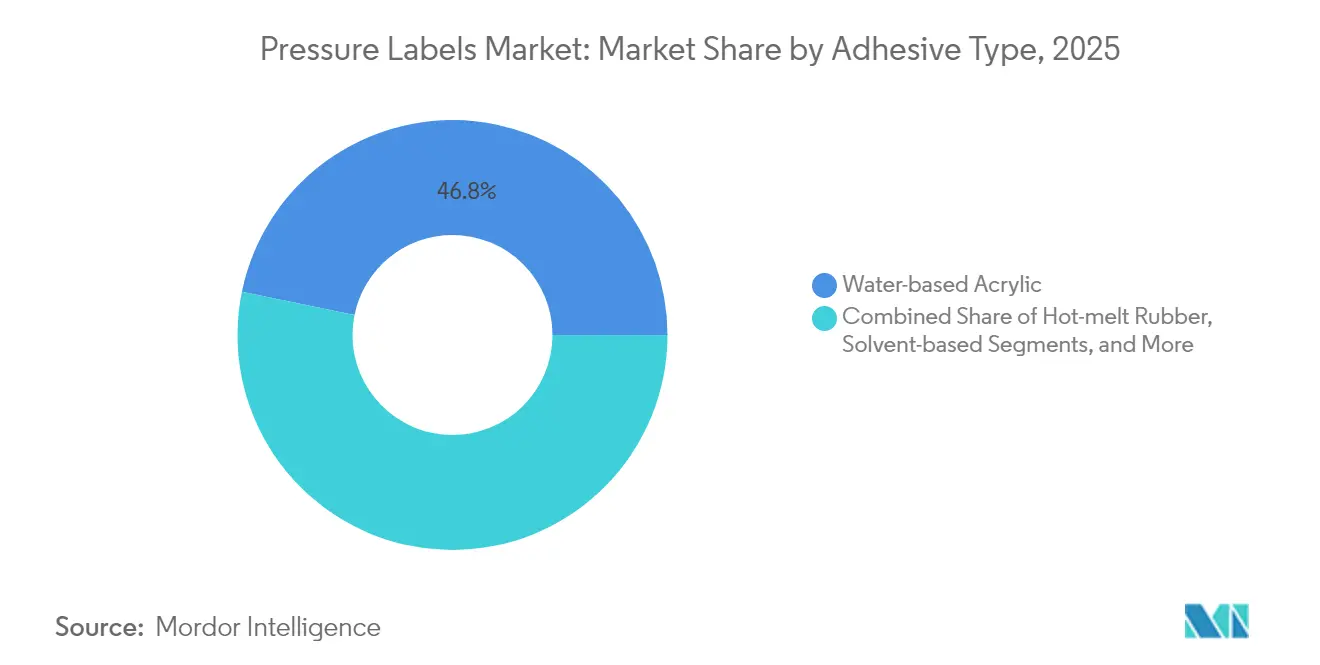
- By adhesive type, water-based acrylic systems accounted for 46.78% share of the pressure labels market in 2025.
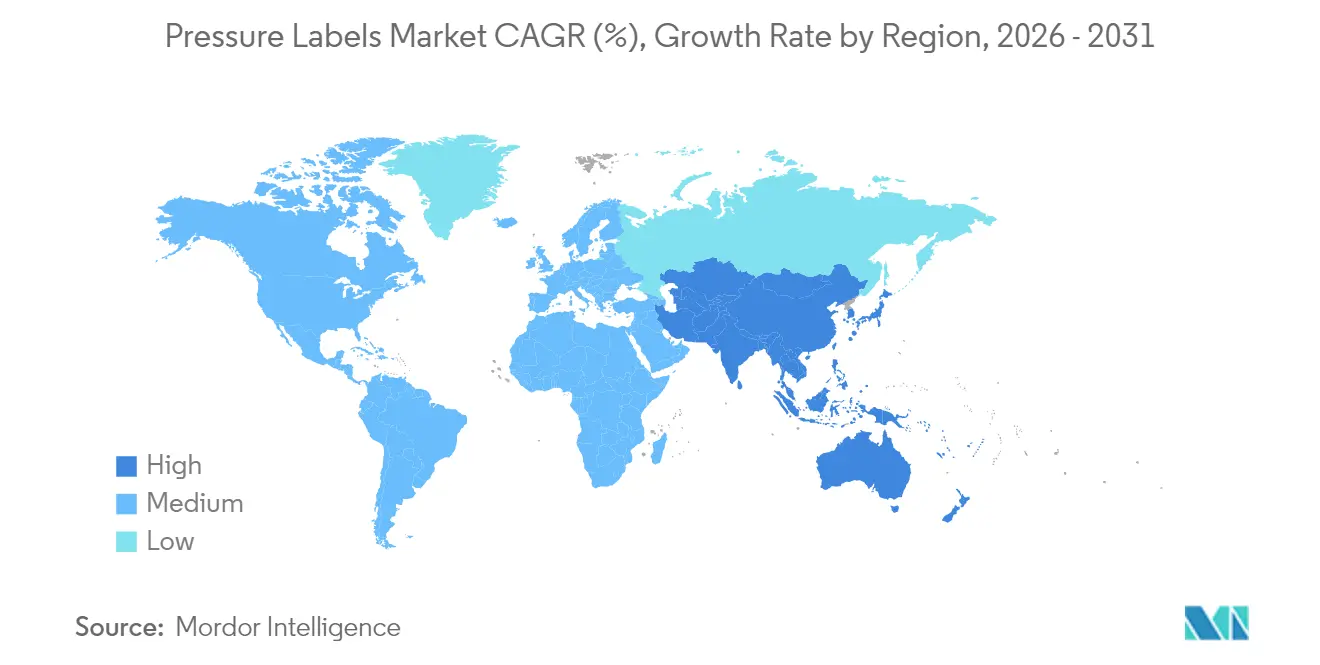
- By geography, the pressure labels market size in the Asia-Pacific is expected to grow at a 5.33% CAGR between 2026-2031.
Note: Market size and forecast figures in this report are generated using Mordor Intelligence’s proprietary estimation framework, updated with the latest available data and insights as of 2026.
Global Pressure Labels Market Trends and Insights
Drivers Impact Analysis*
| Driver | (~) % Impact on CAGR Forecast | Geographic Relevance | Impact Timeline |
|---|---|---|---|
| Growth of e-commerce and just-in-time logistics | 1.2% | Global, with early gains in North America, Europe, APAC core | Medium term (2-4 years) |
| Rise of short-run, variable-data digital printing | 0.8% | North America and EU, spill-over to APAC | Short term (≤ 2 years) |
| Brand-owner demand for sustainable facestocks and liners | 0.9% | Global, led by EU regulatory framework | Long term (≥ 4 years) |
| Strict traceability mandates in food and pharma | 1.1% | North America, EU, expanding to APAC | Medium term (2-4 years) |
| Adoption of liner-less pressure labels in retail automation | 0.7% | North America, Northern Europe | Short term (≤ 2 years) |
| Smart labels with printed electronics for cold-chain monitoring | 0.4% | Global, with early adoption in developed markets | Long term (≥ 4 years) |
| Source: Mordor Intelligence | |||
Growth of e-commerce and just-in-time logistics
Parcel volumes from online retail continue to rise, and warehouses now print millions of pressure-sensitive shipping labels daily. Logistics providers specify adhesives that survive conveyor abrasion yet peel away cleanly for carton reuse. UPM Adhesive Materials released removable logistics facestocks that support multiple delivery cycles. Brand owners also compress inventory buffers, so converters must supply customized labels within hours rather than weeks. This urgency favors digital presses that swap jobs with minimal downtime, reinforcing the growth of the pressure labels market.
Rise of short-run, variable-data digital printing
Digital technology lets converters personalize graphics, languages, and serial numbers on the fly. Gravure presses, while growing fastest for premium cosmetics, still require cylinders that add cost at short lengths. By contrast, toner and inkjet platforms can print serialized barcodes or regional designs without the need for plates. AGH Labels highlighted that high-definition single-pass metalized effects now match analog quality while cutting makeready waste. These capabilities underpin the projected 6.13% CAGR for gravure and strengthen overall pressure labels market resilience.
Brand-owner demand for sustainable facestocks and liners
Corporate climate pledges and EU policy push brands to strip fossil content from packaging. UPM Raflatac’s OptiCut WashOff linerless label eliminates silicone liners and detaches cleanly in recycling plants. Avery Dennison’s CleanFlake adhesive separates during the PET wash to enable bottle-to-bottle loops. Such innovations help the pressure label market satisfy the Extended Producer Responsibility rules now in effect in Vietnam and the Philippines.
Strict traceability mandates in food and pharma
The FDA’s Food Safety Modernization Act Rule 204 will require end-to-end data capture for high-risk foods by January 2026. Pressure-sensitive labels apply 2D codes that withstand cold chain moisture better than ink-jet-direct marking. Pharmaceutical serialization under the Drug Quality and Security Act similarly requires unit-level DataMatrix codes. Compliance lifts demand for high-resolution digital printing and tamper-evident label stocks.
Restraints Impact Analysis*
| Restraint | (~) % Impact on CAGR Forecast | Geographic Relevance | Impact Timeline |
|---|---|---|---|
| Volatility in raw-material (acrylic PSA) prices | -0.6% | Global | Short term (≤ 2 years) |
| Stringent recyclability regulations limiting mixed-material labels | -0.4% | EU primary, expanding globally | Medium term (2-4 years) |
| Limited durability in extreme temperatures and UV exposure | -0.3% | Industrial applications globally | Long term (≥ 4 years) |
| Capital-intensive transition to digital presses for converters | -0.5% | Global, particularly emerging markets | Medium term (2-4 years) |
| Source: Mordor Intelligence | |||
Volatility in raw-material (acrylic PSA) prices
Spot petrochemical hikes squeeze converter margins. The American Chemistry Council reported fractional global chemical output growth, signaling tight monomer supply. Producers hedge by shifting to bio-based tackifiers, such as SASOLWAX, which offers a 35% lower cradle-to-gate footprint and more stable pricing.
Stringent recyclability regulations limiting mixed-material labels
EU Packaging Waste rules penalize metallic and multi-layer labels that hinder polymer recycling. UPM Raflatac secured the first APR certification for HDPE compatibility, but premium cosmetics brands face trade-offs between aesthetics and recyclability.
*Our forecasts treat driver/restraint impacts as directional, not additive. The impact forecasts reflect baseline growth, mix effects, and variable interactions.
Segment Analysis
By Print Process: Gravure Gains Despite Flexography Dominance
Flexography contributed 38.12% of the 2025 revenue, underscoring its cost-effectiveness for long food labeling runs. Gravure printing, however, is projected to deliver a 5.86% CAGR as beauty and pharmaceutical buyers request photographic quality and metallic inks. The pressure labels market size for gravure formats is forecast to reach USD 7.53 billion by 2031, indicating a widening premium niche. Screen and letterpress retain loyal followings in tactile luxury packaging, while inkjet widens adoption in serialization.
Flexo converters mitigate raw-material fluctuations by optimizing setup waste and implementing UV-LED curing, which reduces power consumption. Gravure facilities utilize electromechanical engraving to reduce cylinder lead times, enabling faster introductions of new products. The pressure labels market benefits from this balanced technology mix, giving brand owners price-service options across application tiers. Regulatory audits also favor processes certified to ISO 9001:2015 and G7 color targets, prompting process upgrades even in emerging economies.


By End User: Cosmetics Acceleration Amid Food Dominance
Food brands generated 41.94% of 2025 demand, mirroring the scale of packaged goods that require nutritional data and date coding. Cosmetics lines are set to expand at a 5.52% CAGR, propelled by premium skincare launches in Asia-Pacific duty-free channels. The pressure labels market share for cosmetics is expected to approach 10.92% by 2031, up from 8.12% in 2025. Beverage volumes remain robust, driven by functional drinks and craft beer that often utilize pressure-sensitive neck wraps.
Healthcare labels are subject to heightened scrutiny under counterfeit-prevention laws. Unique serial numbers and tamper-proof features lift average selling prices, adding value even though square-meter volumes are smaller. Household chemicals demand chemical-resistant topcoats, sustaining steady purchases despite economic swings. Together, these trends diversify revenue streams and blunt sector-specific shocks for the pressure labels industry.
By Adhesive Type: Hot-Melt Rubber Challenges Water-Based Dominance
Water-based acrylics held a 46.78% share in 2025 due to their combination of cost, clarity, and FDA food-contact compliance. Hot-melt rubber-based systems are forecast to rise 5.18% annually due to superior tack on rough corrugate and chilled meat films. The pressure labels market size for hot-melt solutions is expected to exceed USD 8.78 billion in 2031. Solvent and UV-curable chemistries remain essential for extreme temperatures, aviation, and chemical drums.
Bio-based polyurethane dispersions such as Pearlbond ECO replace petroleum sources without compromising bond strength. LCA studies indicate 30% to 50% carbon savings, enabling brand owners to report lower Scope 3 footprints. As legislation rolls out recycled-content mandates, converters experiment with removable adhesives that allow mono-material bottle recycling, reinforcing sustainability goals within the pressure labels market.
Geography Analysis
North America generated 39.05% of 2025 revenue, anchored by strict traceability legislation and sophisticated retail automation. The Drug Supply Chain Security Act and the Food Safety Modernization Act sustain annual demand for serialized labels across the pharmaceutical and leafy green industries. CCL Industries logged 8.6% sales growth in Q1 2025, reflecting steady converter margins despite input volatility. Investments at UPM’s Mills River site add premium wine, spirits, and postal laminates, ensuring local supply.
The Asia-Pacific region is projected to record the fastest growth, with a 5.33% CAGR through 2031, as rising disposable incomes drive demand for packaged cosmetics and ready-to-drink teas. UPM’s Johor Bahru coating line will supply filmic and electronics labels to meet regional electronics exports. Extended Producer Responsibility laws in the Philippines and Vietnam stimulate demand for wash-off or linerless labels. Domestic converters invest in digital presses to offer multilingual versions for ASEAN’s mobile consumer base. The pressure labels market is seeing supply-chain shifts as global brands relocate plants closer to Jakarta, Ho Chi Minh City, and Bengaluru.
Europe maintains moderate growth underpinned by ambitious recycling targets and advanced collection systems. The Packaging and Packaging Waste Regulation pressures converters to prove compatibility with household sorters. APR-certified label-container systems earn eco-modulated fees that lower extended producer costs, encouraging adopters. Pharmaceutical serialization, complete since 2019, sustains recurring code-label purchases. Brexit regulatory divergence adds complexity, but established players adapt swiftly, preserving customer loyalty. Together these factors keep the pressure labels market in Europe on a stable upward path.

Regulatory Landscape
In the European Union, the Packaging and Packaging Waste Regulation (PPWR) 2025/40 entered into force on 11 February 2025 and applies starting 12 August 2026, raising the compliance bar for pressure-sensitive labels by tying packaging design-for-recycling requirements to labeling choices that can affect sorting and recycling performance. PPWR also moves the bloc toward harmonized packaging labels, with Article 12(6) requiring the European Commission to set implementing acts for harmonized packaging labels, including specifications for digital means, by 12 August 2026. This reinforces demand for label constructions that are demonstrably compatible with recycling streams.
In the United States, food labeling and packaging compliance continues to shape adhesive and material selection for pressure labels, including FDA rules for indirect food contact such as 21 CFR 175.125 for pressure-sensitive adhesives used as food-contact surfaces on labels and tapes. The FDA established January 1, 2026 as a uniform compliance date for food labeling regulations published between January 1, 2023 and December 31, 2024, tightening operational planning for brand owners and converters managing artwork, materials, and inventory transitions. In parallel, state-level restrictions on intentionally added PFAS in food packaging in states such as California, Washington, and Colorado add another layer of chemical compliance screening for label components used on food and beverage packs.
Competitive Landscape
The top five suppliers account for roughly 55% of global sales, indicating moderate concentration. CCL Industries, Avery Dennison, and Multi-Color Corporation leverage global footprints and R&D centers to secure multinational contracts. UPM Raflatac differentiates itself by embedding environmental data from Carbon Action in quotes, enabling brand owners to benchmark their label footprints.
Acquisitions accelerate geographic reach. Resource Label Group acquired Canada’s Imprimerie Ste-Julie in February 2025, thereby expanding its bilingual capacity. Coveris added S&K Label in January 2025, broadening European coverage. Converters also integrate backward into liner coating or forward into shrink-sleeve print to offer multi-format portfolios.
Sustainability and smart-label projects shape the direction of R&D. Partners are testing NFC tags printed with copper-free inks that reduce e-waste. Bio-based adhesive lines scale up in the United States and Finland, reducing dependence on volatile petro feedstocks. Emerging disruptors focus on linerless dispensers that fit legacy lines, allowing retailers to adopt waste-saving materials without costly machine swaps. These moves sustain competitive pressure and fuel innovation inside the pressure labels market.
Pressure Labels Industry Leaders
CCL Industries Inc.
Avery Dennison Corporation
Multi-Color Corporation
Huhtamäki Oyj
Smurfit WestRock plc
- *Disclaimer: Major Players sorted in no particular order


Market Opportunities and Future Outlook
Recyclability-verified pressure-label constructions are emerging as a clear whitespace as EPR and design-for-recycling requirements increasingly link label choice to packaging recyclability outcomes. Supplier roadmaps provide tangible evidence: in May 2026, UPM Adhesive Materials launched the UPM ProCycle portfolio for PET and HDPE rigid packaging, and in March 2026 BASF announced acResin UV 3532, a UV-curable acrylic hotmelt adhesive with RecyClass approval for compatibility with PET bottle recycling streams. These moves expand the addressable space for wash-off, recycling-compatible adhesives and facestocks that help brand owners retain premium labeling while meeting recycling-system requirements.
A second opportunity is tied to compliance-driven variable information and logistics labeling, where traceability mandates and just-in-time operations elevate the need for higher-resolution printing, durable topcoats, and materials engineered for scuff resistance and controlled removability. The January 2026 implementation milestone for FDA FSMA Rule 204 traceability for high-risk foods raises demand for 2D codes and serialized identifiers that withstand cold-chain conditions, supporting investments in digital printing workflows and qualified material platforms. Converters that pair certified recyclable constructions with fast-turn digital capabilities are positioned to win short-run, multilingual, and variable-data programs across food, pharma, and e-commerce supply chains.
Recent Industry Developments
- June 2026: CCL Industries completed the acquisition of Sleever International Company SA, adding shrink sleeve labeling and application equipment capabilities. The transaction strengthens CCL's packaging decoration platform and expands its presence in sleeve formats alongside pressure-sensitive labeling through integration into CCL Label and Innovia Films.
- May 2026: Avery Dennison announced that new thermal paper label products achieved Old Corrugated Container equivalency (OCC-E) certification and How2Recycle pre-qualification. These validations support recyclability-aligned logistics and shipping label programs, aligning converter and brand-owner specifications with fiber recycling requirements.
- September 2024: UPM Raflatac obtained APR certification for HDPE-compatible pressure labels. The certification provides an external design-for-recyclability signal for rigid packaging applications and supports brand owners seeking label-container combinations that perform in recycling wash and sorting processes.


Research Methodology Framework and Report Scope
Market Definition and Coverage
This market covers pressure labels that stick to a product or pack through pressure at room temperature, without needing heat, water, or solvent. We calculate market value from label materials and the converting activity that results in saleable pressure label products used across end markets.
Scope exclusions: excludes non-pressure label formats that need heat activation or wet-glue application, and excludes labeling equipment and applicator machinery.
Segmentation Overview
- By Print Process
- Gravure
- Flexography
- Screen
- Letterpress
- Inkjet
- Other Print Processes
- By End-User
- Food
- Beverage
- Healthcare
- Cosmetics
- Household
- Industrial
- Other End-user Industries
- By Adhesive Type
- Water-based Acrylic
- Hot-melt Rubber-based
- Solvent-based
- UV-curable
- By Geography
- North America
- United States
- Canada
- Mexico
- South America
- Brazil
- Argentina
- Chile
- Rest of South America
- Europe
- United Kingdom
- Germany
- France
- Italy
- Spain
- Russia
- Rest of Europe
- Asia-Pacific
- China
- India
- Japan
- South Korea
- Australia
- Rest of Asia-Pacific
- Middle East and Africa
- Middle East
- Saudi Arabia
- United Arab Emirates
- Turkey
- Rest of Middle East
- Africa
- South Africa
- Nigeria
- Rest of Africa
- Middle East
- North America
Data Sources, Market Sizing, and Validation
Desk Research
Desk work starts with building the demand setting for labeled packaged goods and the supply setting for label materials and converting. Sources used for this step include US Census Bureau manufacturing data, Eurostat production series, UN Comtrade trade flows, and national customs statistics for paper and film inputs. We also refer to association pages and technical bodies such as TLMI and FINAT for market context, plus peer-reviewed packaging and materials journals for definitions and performance norms.
On the company side, we pull public filings, investor presentations, sustainability reports, and press releases to understand capacity additions, footprint shifts, and product mix language. Where needed, paid subscriptions are used for company financials and intelligence, patent databases, and shipment-level import export checks that help validate directional movement in facestock and adhesive inputs. The sources listed above are illustrative, and additional public references were also used to collect data, validate it, and clarify open questions.
Primary Interviews and Surveys
Primary work is used to test what we built from public data and to close gaps that are hard to see from documents alone, such as mix shifts between liner-based and linerless constructions and the share of digital printing in short runs. Interviews and surveys typically cover converters, raw material participants, distributors, and packaging and procurement stakeholders across APAC, EMEA, and the Americas, and then the inputs are used to confirm assumptions and adjust the final model where needed.
Distribution of primary research fieldwork respondents
| Company type | Respondent position | Region |
|---|---|---|
| Top tier: 26% | CXOs: 13% | APAC: 44% |
| Mid tier: 60% | Functional/Unit leaders: 27% | EMEA: 36% |
| Smaller Players: 14% | Managers: 60% | Americas: 20% |
Market-Sizing & Forecasting
The core sizing uses a top-down model where packaged goods output and labeled SKU intensity are used to reconstruct the addressable demand pool by region, and then the result is translated into value using typical price bands for pressure label constructions. To keep totals realistic, we corroborate results with selective bottom-up approximations, such as sampled converter revenue splits, channel checks on label material consumption, and a simple volume times ASP cross-check for large end-user verticals.
Key inputs that move the model include packaged food and beverage volumes, healthcare and personal care packaging growth, e-commerce parcel and logistics labeling demand, shifts toward linerless adoption, and the mix of printing processes like flexography and inkjet that affects average realization. When some country inputs are missing, we bridge using trade and production proxies for paper and film facestock and then adjust with interview-based penetration ranges. For forecasting, scenario analysis is used around packaging demand, raw material price pass-through timing, and adoption pace for sustainability-driven label constructions, and then the base case is aligned to what respondents consider achievable over the next cycle.
Data Validation & Update Cycle
Validation is done through consistency checks across regions, end-user verticals, and print process shares, so the model does not drift away from known packaging and converting realities. Our team reviews variances against independent signals like trade flows for label inputs, converter utilization commentary, and end-market packaging growth, and then anomalies are flagged and reworked before sign-off.
Reports are refreshed annually, and interim updates are triggered when material events occur, such as major capacity moves, sharp input price swings, or regulatory shifts that change construction choices. Before delivery, a final pass is completed so the latest public releases and primary confirmations are reflected in the numbers clients receive.
Mordor Intelligence's Pressure Labels Market Size Measured Against Other Published Estimates
Published market sizes for pressure labels can look far apart because each publisher draws the scope differently and also uses different timing for currency and price assumptions. Differences also show up when one study leans heavily on segment roll-ups while another leans on macro packaging totals.
By tracking print process mix and linerless adoption rates, and then refreshing converter price realization checks through Mordor Intelligence, the 2026 value is kept tied to finished pressure label constructions only, rather than being widened to include adjacent label categories or labeling machinery.
Benchmark comparison
| Source | Market Size | Gaps in Research Methodology |
|---|---|---|
| Mordor Intelligence | USD 24.48 B (2026) | |
| Global Consultancy A | USD 73.06 B (2025) | Uses a much wider scope that appears to roll pressure labels into broader self-adhesive label value, and the year basis also differs, which can lift the headline number versus a constructions-only definition. |
| Industry Publisher B | USD 69.27 B (2024) | Likely stacks raw material components such as facestock and adhesives with finished label value, and it anchors to a different base year and currency timing, which can shift the reported level even if growth rates look similar. |
Taken together, the spread is mainly explained by what is counted as in-scope value and how pricing and year selection are handled. When the model is tied to clear demand signals and cross-checked against converting realities, the resulting market size is easier to trace back to repeatable steps and visible inputs that can be reviewed each update cycle.


Key Questions Answered in the Report
What is the current value of the pressure labels market?
The pressure labels market size reached USD 24.48 billion in 2026.
Which print process is gaining the most momentum?
Gravure printing is projected to register the highest 5.86% CAGR through 2031 due to premium cosmetics and pharma demand.
How fast is the sector expected to grow?
Revenue is forecast to increase at a 3.94% CAGR, climbing to USD 29.7 billion by 2031.
Which region offers the fastest expansion opportunity?
Asia-Pacific is set to record a 5.33% CAGR as consumer goods output rises and EPR rules drive label upgrades.
How are sustainability trends shaping product development?
Brand owners shift toward linerless, wash-off, and bio-based adhesive solutions to meet recycling targets and cut carbon footprints.
Who are the major industry players?
CCL Industries, Avery Dennison, Multi-Color Corporation, and UPM Raflatac lead with integrated global operations and strong R&D pipelines.
Page last updated on:


 Your data is secure and never sold or shared.


