
Pressure Control Equipment Market Size and Share
Market Overview
| Study Period | 2020 - 2031 |
|---|---|
| Market Size (2026) | USD 10.31 Billion |
| Market Size (2031) | USD 11.46 Billion |
| Growth Rate (2026 - 2031) | 2.12 % |
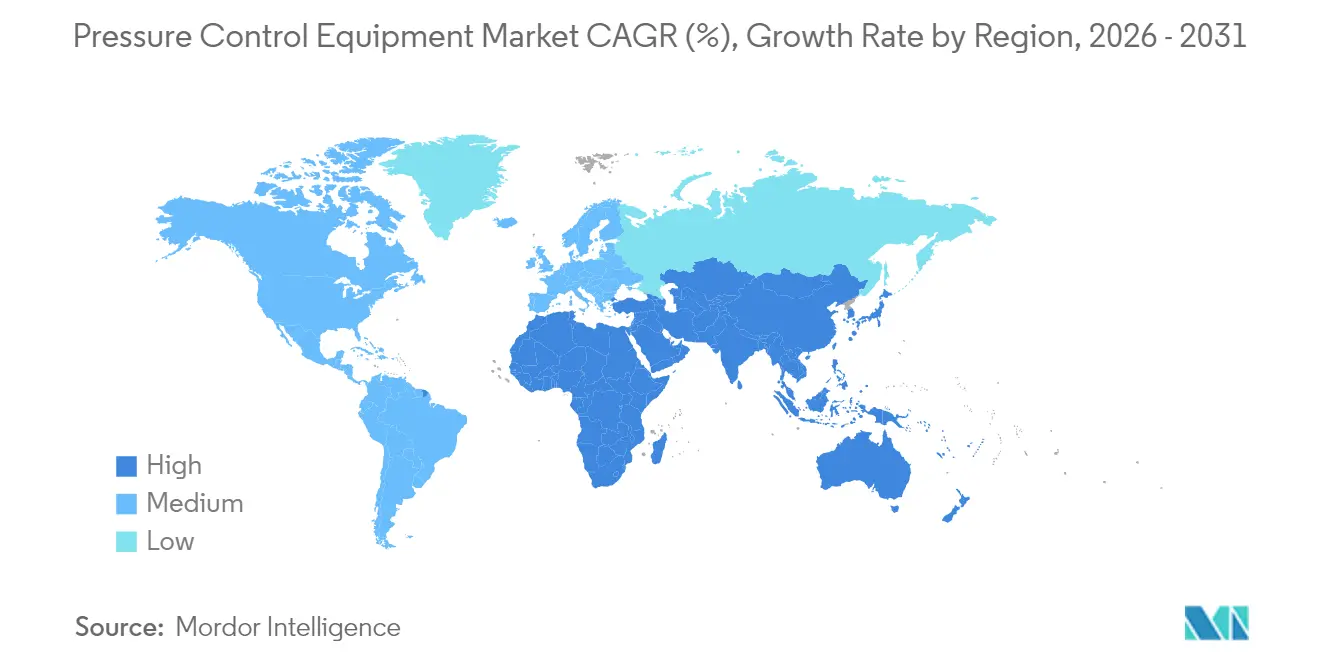
| Fastest Growing Market | Middle East and Africa |
| Largest Market | North America |
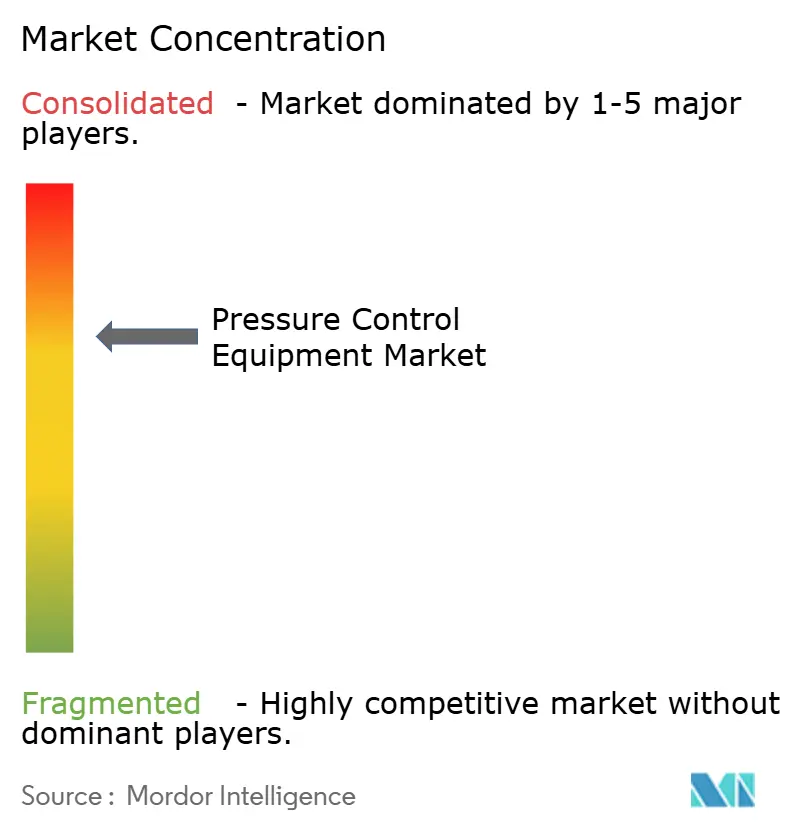
| Market Concentration | Medium |
Major Players
*Disclaimer: Major Players sorted in no particular order Image © Mordor Intelligence. Reuse requires attribution under CC BY 4.0. |
|
Pressure Control Equipment Market Analysis by Mordor Intelligence
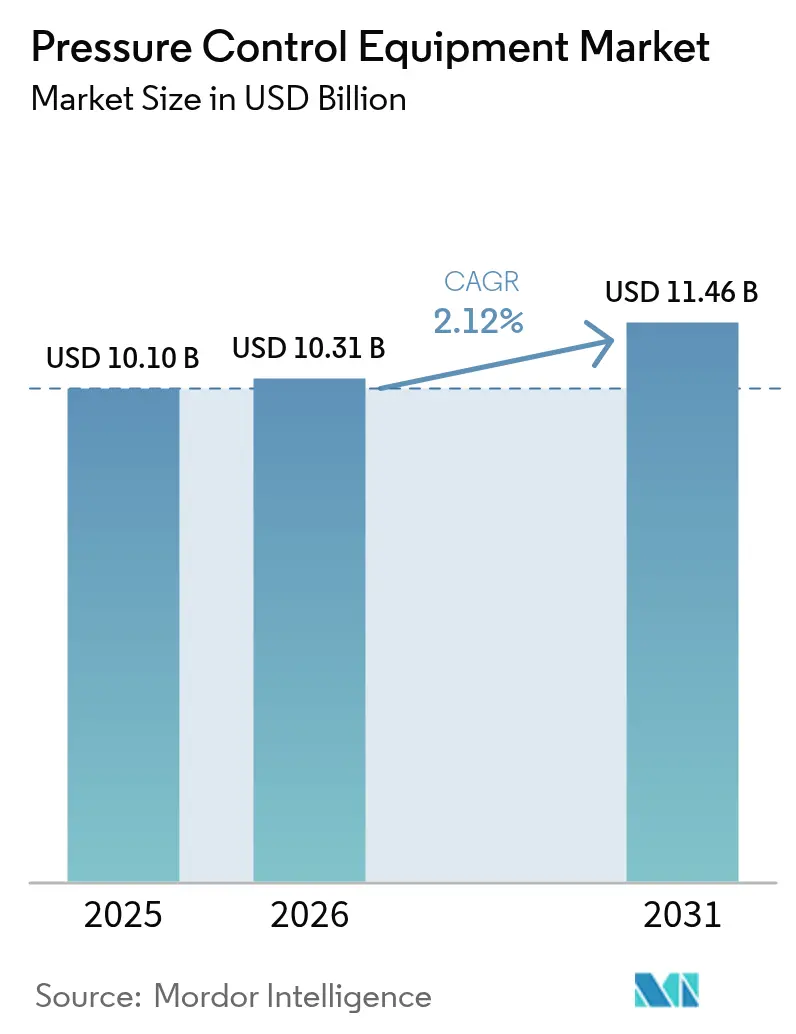
The pressure control equipment market size is expected to grow from USD 10.1 billion in 2025 to USD 10.31 billion in 2026 and is forecast to reach USD 11.46 billion by 2031 at 2.12% CAGR over 2026-2031. Growth is propelled by deep- and ultra-deepwater drilling campaigns in South America, rapid adoption of managed pressure drilling technologies, and stricter safety regulations that shorten replacement cycles for aging systems. North American shale programs and North Sea brownfield projects sustain baseline demand, while ultra-high-pressure (20 kpsi+) systems unlock frontier reservoirs. Digital valve diagnostics, electrification, and AI-enabled predictive maintenance further stimulate equipment upgrades as operators pursue operational integrity and lower emissions. Meanwhile, crude-price volatility and a thriving rental model temper capital spending on new builds, driving suppliers to balance fleet investments with traditional sales channels.
Key Report Takeaways
- By component, valves led with 32.10% revenue share in 2025; blowout preventers are forecast to expand at an 2.44% CAGR through 2031.
- By pressure rating, high-pressure systems held 56.55% of pressure control equipment market share in 2025, while ultra-high-pressure systems are projected to grow at 3.28% CAGR between 2026-2031.
- By well type, onshore operations commanded 63.75% of the pressure control equipment market size in 2025; ultra-deepwater offshore wells are advancing at a 2.58% CAGR to 2031.
- By operation phase, drilling accounted for 46.20% share of the pressure control equipment market size in 2025, whereas intervention services exhibit a 3.06% CAGR to 2031.
- By geography, North America captured 38.55% of the pressure control equipment market share in 2025; the Middle East records the highest regional CAGR at 2.58% through 2031.
Note: Market size and forecast figures in this report are generated using Mordor Intelligence’s proprietary estimation framework, updated with the latest available data and insights as of 2026.
Global Pressure Control Equipment Market Trends and Insights
Drivers Impact Analysis*
| DRIVER | (~) % IMPACT ON CAGR FORECAST | GEOGRAPHIC RELEVANCE | IMPACT TIMELINE |
|---|---|---|---|
| Rising Deep- & Ultra-Deepwater Drilling Campaigns in South America | +0.7% | South America, with spillover to Gulf of Mexico | Medium term (2-4 years) |
| Adoption of Managed Pressure Drilling Requiring Advanced Control Heads | +0.5% | Global, with early adoption in North America & North Sea | Short term (≤ 2 years) |
| Stringent Safety Regulations Driving Replacement Cycles in North American Shale | +0.4% | North America, particularly Permian Basin | Short term (≤ 2 years) |
| North Sea Brownfield Life-Extension Retrofits | +0.3% | Europe, primarily UK & Norwegian sectors | Medium term (2-4 years) |
| Digital Valve Diagnostics Minimising NPT in Middle-East Offshore Assets | +0.2% | Middle East, expanding to Asia-Pacific | Long term (≥ 4 years) |
| LNG Import-Terminal Expansion in Asia Boosting High-Pressure Transfer Valves | +0.2% | Asia-Pacific, with concentration in China & South Korea | Medium term (2-4 years) |
| Source: Mordor Intelligence | |||
Rising Deep- & Ultra-Deepwater Drilling Campaigns in South America
South America’s deepwater renaissance demands pressure control equipment that withstands extreme pressures, high CO₂ content, and corrosive fluids. SLB’s USD 800 million contract with Petrobras covers more than 100 wells in Brazil’s pre-salt basins, integrating high-spec safety valves and AI-enabled monitoring. Woodside Energy’s Trion project relies on 20 kpsi subsea systems for 18 ultra-deepwater wells at 2,500 m water depth. Flexible pipe supplied by Baker Hughes uses corrosion-resistant alloys to mitigate CO₂-induced cracking. Integrated hardware-plus-service packages spur aftermarket revenue as operators seek single-throat accountability for life-of-field support.[1]
Adoption of Managed Pressure Drilling Requiring Advanced Control Heads
Managed pressure drilling (MPD) has moved from deepwater niche to mainstream technique. Halliburton and Sekal deployed the first automated on-bottom drilling system integrating LOGIX automation and Drilltronics for real-time pressure control. Weatherford’s Victus Intelligent MPD suite won projects with Saudi Aramco and Petroleum Development Oman, illustrating onshore uptake. Field results show MPD cutting non-productive time by 92 hours and trimming total drilling time by 7.4 days. AI algorithms embedded in control heads predict influx or loss events, boosting safety and lowering well costs.[2]
Stringent Safety Regulations Driving Replacement Cycles in North American Shale
Updated blowout-preventer test intervals and pressure vessel inspection requirements shorten replacement cycles, enlarging the installed-base opportunity. The US Bureau of Safety and Environmental Enforcement underscores MPD as a compliant control method for high-pressure wells. Baker Hughes’ all-electric SureCONTROL Plus valves and Hummingbird cementing unit meet new reliability metrics while slashing maintenance. Operators adopting advanced systems report up to 75% fewer well-control incidents compared with legacy equipment.
North Sea Brownfield Life-Extension Retrofits
More than half of North Sea installations exceed 20 years of service. Next-generation subsea controls for Tordis and Vigdis fields restore bandwidth while eliminating obsolete electronics. Shell’s thermoplastic composite risers deliver a 50% lower CO₂ footprint than steel and remove continuous chemical dosing. Modular retrofit kits reduce capex by 70% versus wholesale replacement and align with UK carbon-reduction targets.
Restraints Impact Analysis*
| RESTRAINTS | (~) % IMPACT ON CAGR FORECAST | GEOGRAPHIC RELEVANCE | IMPACT TIMELINE |
|---|---|---|---|
| Crude-Oil Price Volatility Delaying Offshore CAPEX | -0.7% | Global, with highest impact on deepwater projects | Short term (≤ 2 years) |
| Rental Pressure-Control Packages Dampening New-Build Sales | -0.3% | North America & North Sea, expanding globally | Medium term (2-4 years) |
| Forged-Alloy Component Supply Bottlenecks Post-Ukraine Conflict | -0.2% | Global, with acute impact in Europe & North America | Short term (≤ 2 years) |
| Skilled-Labour Shortage for 20k-psi Equipment Maintenance in Emerging Markets | -0.1% | Asia-Pacific, Middle East, Africa | Long term (≥ 4 years) |
| Source: Mordor Intelligence | |||
Crude-Oil Price Volatility Delaying Offshore CAPEX
Brent is expected to average USD 74/bbl in 2025, but bearish views place downside at USD 65/bbl amid oversupply and tepid Chinese demand. Operators defer final investment decisions, pushing deepwater recovery to 2026+ as FPSO lead times stretch three-plus years. US E&Ps cut 2024 capex to USD 61.7-65.4 billion, underscoring disciplined spend. Equipment orders slow, especially for new ultra-deepwater rigs.
Rental Pressure-Control Packages Dampening New-Build Sales
Operators favor opex-based rentals that flex with rig utilization. Service firms grow fleets to secure recurring revenue but must maintain high uptime to offset lower capital turnover. Demand for latest-generation BOP stacks via rental boosts aftermarket services but tempers OEM sales pipelines.
*Our forecasts treat driver/restraint impacts as directional, not additive. The impact forecasts reflect baseline growth, mix effects, and variable interactions.
Segment Analysis
By Component: Valves Sustain Leadership while Blowout Preventers Accelerate
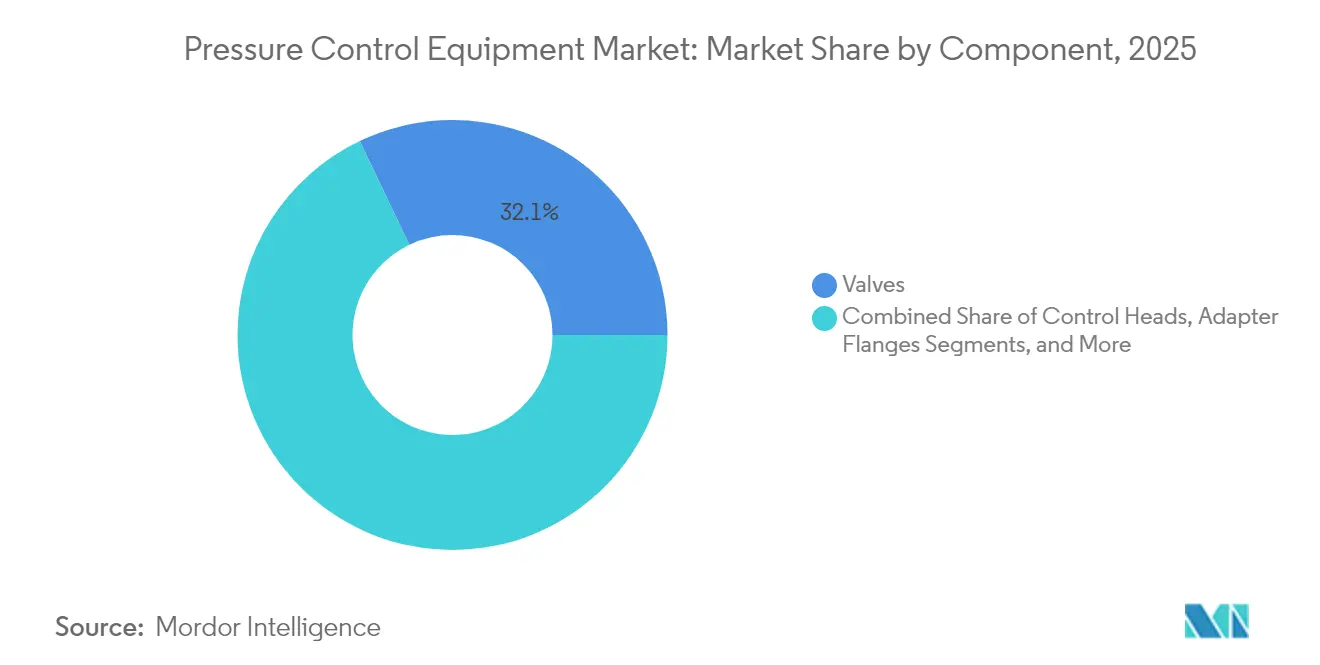
Valves generated 32.10% of 2025 revenue as every drilling, completion, and production phase depends on ball, gate, and choke variants for fail-safe isolation. Incremental gains arise from digital positioners that provide real-time health data. Blowout preventers expand at an 2.44% CAGR to 2031, propelled by mandatory 20 kpsi capability for ultra-deepwater basins. Control heads enjoy growing share as MPD moves onshore; annular designs with elastomer enhancements reduce routine seal changes by 30%. Complementary items like adapter flanges and quick unions capture steady demand as rig owners standardize interfaces.
Supplier innovation spans beyond oil and gas: Emerson’s TESCOM HV-7000 hydrogen regulator signals cross-sector diversification. Christmas trees, particularly subsea vertical monobore styles, command premium price due to higher metallurgy and sensor density. OEM gross margins on subsea variants exceed 25% versus 17-19% on comparable surface trees. Integrated packages bundling valves, manifolds, and digital twins strengthen customer lock-in and open service-contract annuities.

By Pressure Rating: Ultra-High-Pressure Solutions Unlock Frontier Plays
High-pressure (10–20 kpsi) systems controlled 56.55% of pressure control equipment market share in 2025, anchored by 15 kpsi stacks deployed on deepwater floaters. The pressure control equipment market size tied to this rating tier will expand in low-single digits as adoption plateaus. Conversely, ultra-high-pressure (>20 kpsi) solutions outpace all categories at 3.28% CAGR to 2031, driven by Chevron’s Anchor and BP’s 20 kpsi projects.
OEMs are redesigning rams with tungsten-carbide inserts and maraging-steel housings to meet fatigue targets. Maximator’s 8,000-bar test rigs accelerate qualification of next-gen alloys. Low-pressure (<10 kpsi) equipment retains relevance in legacy land wells yet faces pricing pressure due to oversupply. Regional split shows North America skewing toward higher pressures, while parts of Middle East still deploy 10 kpsi systems on conventional fields.
By Well Type: Offshore Ultra-Deepwater Growth Surpasses Onshore Baseline
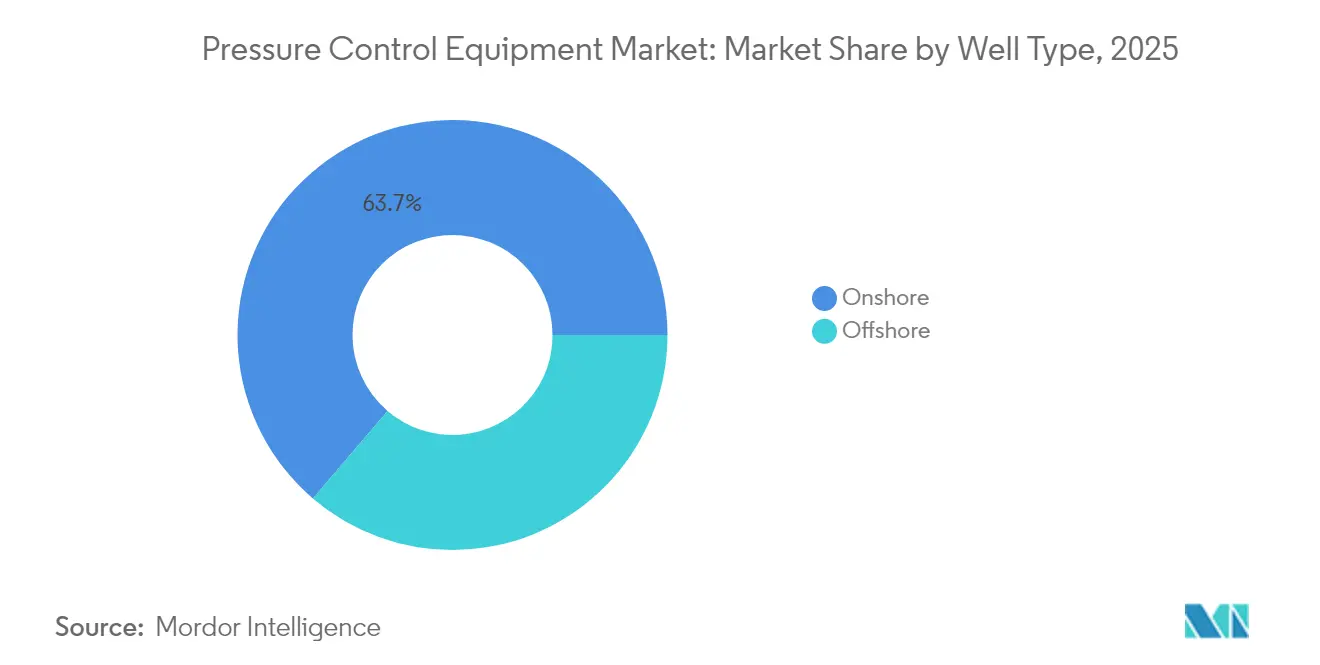
Onshore wells accounted for 63.75% of 2025 revenue thanks to resilient shale programs and conventional land rigs across the Middle East and China. Mature basin re-fracturing sustains valve demand, but growth moderates. Ultra-deepwater wells rise at 2.58% CAGR as Petrobras, Woodside, and Shell sanction projects requiring 2,500-3,000 m water-depth capability.
The pressure control equipment market size attached to ultra-deepwater could double by 2030, reflecting hardware unit cost multiples of 3-4× versus land equivalents. Subsea trees engineered for 15–20 kpsi and –18 °C to 176 °C temperature range enable safe production from high-pressure, high-temperature formations. Shallow-water and deepwater projects maintain steady demand through tie-backs and life-extension drilling near existing hubs.
By Operation Phase: Intervention Services Drive Fastest Upside
Drilling remained the largest phase with 46.20% share in 2025, underpinned by around 600 active US land rigs and 200 offshore rigs worldwide. However, intervention and work-over exhibit 3.06% CAGR as operators stretch asset life. AI-enabled chemical optimization platforms such as Baker Hughes’ InjectRT prolong equipment run life and drive chemical savings up to 30%.
Growing adoption of thru-tubing services and coiled-tubing-conveyed MPD tools boosts control-head utilization. Completion operations seek compact, all-electric wellhead systems that reduce topside footprint and emissions, aligning with decarbonization goals. Continuous production activities generate predictable aftermarket revenue for choke valves, wellhead sensing, and emergency-shutdown systems.
Geography Analysis
North America captured 38.55% of 2025 revenue, led by Permian Basin shale drilling and Gulf of Mexico subsea developments. Rig activity averages 600 land and 25 floating rigs, sustaining steady call-off orders for BOP spares and valve refurbishments. Canada adds incremental growth through oil-sands sustaining projects and Montney gas drilling, with rig counts expected to rise 4-5% annually, while Mexico’s Trion project brings new ultra-deepwater demand.
The Middle East is the fastest-growing region at 2.58% CAGR. Saudi Aramco, ADNOC, and PDO raise rig count from 412 in 2024 to a forecast 618 by 2028, spurring orders for high-pressure BOP stacks and digital choke manifolds. Real-time valve diagnostics installed on offshore platforms cut non-productive time by 18%, encouraging broader deployment. Israel and Turkey add to regional momentum through gas development.
Asia-Pacific shows diversified drivers: China’s shale gas and LNG terminal build-out, India’s exploration push lifting rigs from 111 to 142 by 2028, and South Korea’s new regas terminals that specify 15 kpsi actuated valves. Regional buyers demand local content, prompting OEMs to expand joint ventures and assembly lines. Australia maintains investment in Northwest Shelf tie-backs, while Southeast Asian national oil companies focus on marginal-field redevelopment.
Europe’s North Sea leverages brownfield retrofits and life-extension to sustain equipment upgrades. Electrification and composite risers reduce platform emissions, dovetailing with EU carbon objectives. Latin America beyond Brazil gains support from Argentina’s Vaca Muerta shale pilots and Guyana’s deepwater ramp-up. Africa remains mixed: Angola and Namibia attract exploration budgets, whereas Nigeria grapples with fiscal uncertainties.
Regulatory Landscape
Pressure control equipment used in oil and gas and adjacent industrial services is governed by a mix of statutory safety regimes and consensus standards that shape design, certification, and in-service inspection. In Europe, the Pressure Equipment Directive (PED) 2014/68/EU anchors conformity assessment and CE marking for pressure vessels, valves, and assemblies, while operators and OEMs commonly align specifications to widely used industry standards such as API 521 (pressure-relieving and depressuring systems) and ISO requirements relevant to gas pressure safety (for example, ISO 23555-1:2022). In upstream projects, operator procurement frameworks also reference industry specifications such as IOGP JIP33 for pressure regulators to standardize technical requirements across suppliers and regions.
Regulatory attention is shifting beyond mechanical integrity toward software-enabled and connected safety functions used in automated pressure control. The European AI Act (Regulation (EU) 2024/1689) becomes fully binding on August 2, 2026, increasing conformity and documentation obligations for industrial AI systems, while the EU Machinery Regulation (EU) 2023/1230 takes effect from January 20, 2027, tightening requirements for connected machinery and safety-related control systems. Together, these timelines add compliance workload for AI-enabled valve diagnostics, automated choke control, and MPD-integrated control heads, particularly where third-party assessment and notified-body capacity influence product releases and project delivery schedules.
Value Chain Analysis
The value chain runs from metallurgical inputs through engineered manufacturing, system integration, and lifecycle services. Upstream suppliers provide forged alloy steels, corrosion-resistant superalloys, and high-performance elastomers that feed machining, heat treatment, coating, and qualification testing for critical items such as BOP components, high-pressure valves, chokes, and manifolds. OEMs and service companies then package these into pressure-control systems integrated with sensors, control software, and communications for remote monitoring and predictive maintenance, distributed via direct project sales, rental fleets, and field service bases supporting drilling, completion, intervention, and production operations.
Recent activity points to consolidation and partnership-driven capability buildout across the chain. In June 2026, ONGC signed an MoU with CUDD Pressure Control (USA) to enhance specialized well control and blowout safety capabilities, highlighting the role of national operators in strengthening local service ecosystems. M&A and product launches also broaden engineered flow-control coverage, including Cashco completing its acquisition of UK-based 3B Controls (July 2026) and Control Devices acquiring Solenoid Solutions (July 2026), while PRUSS and OMB Valves Group introduced the PROcv control valve series (May 2026). These moves reinforce a shift toward integrated, automation-ready offerings and tighter control over specialized components that can affect delivery timing.
Competitive Landscape
The market displays moderate concentration: top five suppliers account for roughly 68% of global revenue. SLB, Baker Hughes, Halliburton, Weatherford, and NOV leverage integrated portfolios and global service networks. SLB’s acquisition of ChampionX, awaiting final clearances, will unlock USD 400 million synergies and deepen production-chemical integration. Baker Hughes and Cactus formed a surface pressure-control joint venture granting Cactus 65% ownership, consolidating wellhead positions and broadening international reach.
Technology leadership pivots on AI-driven automation, electrification, and materials science. Halliburton’s LOGIX automated drilling and SLB’s Ora intelligent testing deliver data-rich insights that inform pressure-control parameters. White-space entrants such as Innovex International target niche downhole tools, while Maximator supplies ultra-high-pressure test equipment critical for 20 kpsi certification. OEMs race to patent fail-safe valve actuation and remote condition-monitoring algorithms, creating defensible IP and aftermarket pull.
Customers favor bundled hardware-software-service contracts reducing interface risk and enabling performance-based KPIs. Suppliers respond by expanding digital twins and remote operations centers that supervise drilling and production pressure envelopes. Skilled-labor shortages in emerging markets elevate value propositions around autonomous systems. Sustainability also influences buying: all-electric wellheads and composite risers command premiums as operators strive for lower Scope 1 and Scope 2 emissions.
Pressure Control Equipment Industry Leaders
-
Baker Hughes (A GE Company)
-
Schlumberger, Ltd.
-
Weatherford International, PLC
-
National Oilwell Varco, Inc.
-
Halliburton Co.
- *Disclaimer: Major Players sorted in no particular order
Market Opportunities and Future Outlook
Opportunities are increasingly centered on integrated pressure-control automation rather than stand-alone components, particularly where managed pressure drilling (MPD) and closed-loop control reduce human exposure and non-productive time. Halliburton and Eni reported an industry-first closed-loop rig automation deployment with MPD on a deepwater exploration well offshore Indonesia (July 2026), connecting choke management, pumps, and rig control systems. This creates whitespace for suppliers that can package control heads, valves, and diagnostics with interoperable software, cybersecurity, and field support, matching procurement preferences for bundled hardware-software-service contracts.
Ultra-high-pressure and HP/HT developments also drive near- to mid-term demand for qualified designs, materials expertise, and test capability. IMI won a North Sea contract for ultra-high-pressure chemical injection valves using EroSolve Metamorphic Trim technology rated above 600 bar (March 2026), and Chevron introduced a next-generation subsurface pressure control system integrating hardware, advanced modeling, and real-time monitoring for ultra-deep reservoir development (May 2026). At the same time, the European AI Act becoming fully binding on August 2, 2026, and the EU Machinery Regulation effective January 20, 2027, raise compliance requirements for AI-enabled diagnostics and automated control functions. That environment supports vendors that can deliver certifiable, audit-ready digital features alongside mechanical integrity and serviceability.
Recent Industry Developments
- May 2026: Weatherford secured multiple managed pressure drilling awards and a global aftermarket agreement with Noble Corporation, covering system deliveries and upgrades across regions including Guyana and Nigeria. The deal ties equipment deployment to longer-term service and spares support, reinforcing the shift toward lifecycle contracts alongside hardware supply.
- February 2026: SLB launched the Cameron frac fluid delivery system as a fully electric alternative to traditional hydraulic actuation for wellsite operations. The shift supports electrification of pressure-control-related workflows and strengthens differentiation around safety, controllability, and reduced hydraulic complexity.
- January 2026: Baker Hughes and Cactus closed the surface pressure control joint venture, with Baker Hughes contributing its SPC product line and retaining a 35% stake. The transaction consolidates manufacturing and service capabilities in surface pressure control and reshapes routes to market through a combined platform.
Research Methodology Framework and Report Scope
Market Definition and Coverage
This market covers pressure control equipment used to safely contain, manage, and direct well pressure during oil and gas drilling, completion, and well intervention work, covering both onshore and offshore wellsite activity.
Scope exclusions: We exclude general industrial pressure management items that are not purpose-built for well control use at the wellsite.
Segmentation Overview
-
By Component
-
Valves
- Ball Valves
- Gate Valves
- Choke Valves
- Check Valves
-
Blowout Preventers
- Annular BOP
- Ram BOP
- Control Heads
- Adapter Flanges
- Quick Unions
- Christmas Tree / Flow Tee
- Others (Pack-offs, Lubricators)
-
Valves
-
By Pressure Rating
- Low Pressure (less than 10 000 psi)
- High Pressure (10 000-20 000 psi)
- Ultra-High Pressure (greater than 20 000 psi)
-
By Well Type
-
Onshore
- Conventional Land Rigs
- Shale and Tight Formations
-
Offshore
- Shallow-Water
- Deepwater
- Ultra-Deepwater
-
Onshore
-
By Operation Phase
- Drilling
- Completion
- Intervention / Work-over
- Production
-
By Geography
-
North America
- United States
- Canada
- Mexico
-
Europe
- United Kingdom
- Germany
- France
- Italy
- Rest of Europe
-
Asia-Pacific
- China
- Japan
- India
- South Korea
- Rest of Asia-Pacific
-
Middle East
- Israel
- Saudi Arabia
- United Arab Emirates
- Turkey
- Rest of Middle East
-
Africa
- South Africa
- Egypt
- Rest of Africa
-
South America
- Brazil
- Argentina
- Rest of South America
-
North America
Data Sources, Market Sizing, and Validation
Desk Research
For the initial fact base, we reviewed public oil and gas activity and safety signals that link directly to equipment demand, then set realistic volume and pricing ranges based on those signals. Useful public sources included EIA drilling and production statistics, Baker Hughes rig count releases, BSEE offshore incident and activity reports, and IEA outlooks for upstream spending and supply trends.
We also pulled supporting context from operator annual reports, investor presentations, industry association publications, and reputable press coverage of well intervention campaigns and offshore project timelines. For cross-checks, patent databases were used to sense innovation direction in high-pressure designs, and a paid subscription for company financials and news helped validate revenue exposure and timing for key product groups. The specific desk sources named here are illustrative only, since many other references were also used to collect data, validate assumptions, and clarify open questions.
Primary Interviews and Surveys
To confirm what the secondary signals were implying, we spoke with supply-side and demand-side experts who work with pressure control equipment in day-to-day operations. Interviews covered manufacturers, rental and service providers, and wellsite users, and we balanced inputs across offshore and onshore activity so assumptions on mix and replacement demand were not driven by a single basin.
We used these discussions to pressure-test utilization, typical package configurations, lead times, and pricing movements for high-pressure versus low-pressure jobs, then adjusted the model when the desk view was too optimistic or too conservative.
Distribution of primary research fieldwork respondents
| Company type | Respondent position | Region |
|---|---|---|
| Top tier: 30% | CXOs: 13% | APAC: 46% |
| Mid tier: 56% | Functional/Unit leaders: 37% | EMEA: 32% |
| Smaller Players: 14% | Managers: 50% | Americas: 22% |
Market-Sizing & Forecasting
Market size was built using a top-down demand pool that reconstructs equipment need from well activity and intervention intensity, then ties it back to how pressure control packages are deployed in the field. Key inputs included active rig counts, well intervention and workover frequency, the offshore versus onshore job mix, the split of high-pressure (above 10,000 PSI) versus low-pressure work, and typical service life and replacement cycles for frequently used components.
Once the total was formed, we corroborated it with selective bottom-up checks using sampled shipment and revenue signals, plus price per package and utilization benchmarks gathered in interviews. Where direct volume visibility was limited, we used proxy indicators such as announced campaign schedules and regional activity shares, then rechecked those assumptions with experts before finalizing.
For forecasting, we ran scenario analysis connected to upstream capex direction, rig count outlooks, and expected changes in well intervention needs, and then tuned the trajectories using expert input on pricing pressure and service intensity. This kept the projection practical, since the drivers can be refreshed each year without relying on hard-to-access internal datasets.
Data Validation & Update Cycle
Numbers were checked through multiple layers, starting with basic consistency tests across regions, pressure classes, and application mix, then followed by variance checks against independent activity indicators. If a region showed a jump that could not be explained by rig counts, offshore project timing, or intervention cadence, we revisited the assumptions and, when needed, re-contacted experts to confirm what changed.
Before sign-off, the model and written conclusions are reviewed by another analyst to keep calculation logic and scope alignment consistent. Reports are refreshed annually, and interim updates are made when material events occur, such as sharp shifts in drilling activity, major offshore project delays, or meaningful pricing changes. Right before delivery, a final data pass is done so clients receive the most current view available.
Mordor Intelligence's Pressure Control Equipment Market Sizing Compared With Other Published Estimates
Published market values for pressure control equipment can differ because the included revenue streams are not always the same, and because assumptions for well activity, pressure-class mix, and pricing are updated at different times. Variance also comes from whether the estimate leans more on drilling-only indicators or also accounts for intervention intensity and rental usage.
A large share of the spread typically comes from scope choices, such as counting only well intervention packages versus also adding services, rentals, and spares, followed by how high-pressure jobs are weighted versus low-pressure work. Currency timing and base-year selection matter as well, since converting multi-region revenue using older exchange rates can shift totals. This is why the model refresh cadence and activity checks tied to rig counts and intervention cycles stay central in our sizing approach, including the specific inclusion of valves, control heads, and wellhead flanges counted in the total by Mordor Intelligence.
Benchmark comparison
| Source | Market Size | Gaps in Research Methodology |
|---|---|---|
| Mordor Intelligence | USD 10.31 B (2026) | |
| Trade Journal A | USD 6.80 B (2022) | Uses an earlier base year and is presented around a shorter 2022 to 2027 cycle, which can understate later-cycle offshore and intervention recovery, and it may also differ on whether rentals and spares are fully counted. |
| Industry Publication B | USD 8.90 B (2027) | Focuses strongly on well intervention usage and can apply a faster pricing uplift and drilling rebound path to reach the 2027 figure, which can shift totals if pressure-class mix and service intensity are not revalidated frequently. |
Looking across the table, the main reason the totals do not match is that the years, activity assumptions, and counted revenue buckets are not aligned. When the scope is kept consistent across components and pressure ranges, and when the outlook is tied to repeatable signals like rig activity and intervention cadence, the resulting market value is easier to explain and update over time.
Key Questions Answered in the Report
What is the current size of the pressure control equipment market?
The market is valued at USD 10.31 billion in 2026 and is forecast to reach USD 11.46 billion by 2031.
Which region holds the largest pressure control equipment market share?
North America leads with 38.55% share in 2025 owing to robust shale drilling and Gulf of Mexico projects.
What segment is growing fastest within the market?
Ultra-high-pressure systems (>20 kpsi) are expanding at 3.28% CAGR as deepwater operators target frontier reservoirs.
How are managed pressure drilling technologies influencing demand?
MPD adoption drives control-head sales and replacement cycles by enabling precise bottomhole pressure control and reducing non-productive time.
Why are valves still the largest component segment?
Valves are integral at every well phase; their 32.10% revenue share stems from ubiquity, rapid shutoff capability, and the shift toward smart, self-diagnosing designs.
How does crude-oil price volatility affect equipment purchases?
Low price scenarios delay offshore capex, slowing new-build orders, although replacement and rental demand cushion the impact by keeping existing rigs compliant.