
Premium Snacks Market Size and Share
Market Overview
| Study Period | 2021 - 2031 |
|---|---|
| Market Size (2026) | USD 54.62 Billion |
| Market Size (2031) | USD 67.08 Billion |
| Growth Rate (2026 - 2031) | 4.18 % |
| Fastest Growing Market | Asia-Pacific |
| Largest Market | Europe |
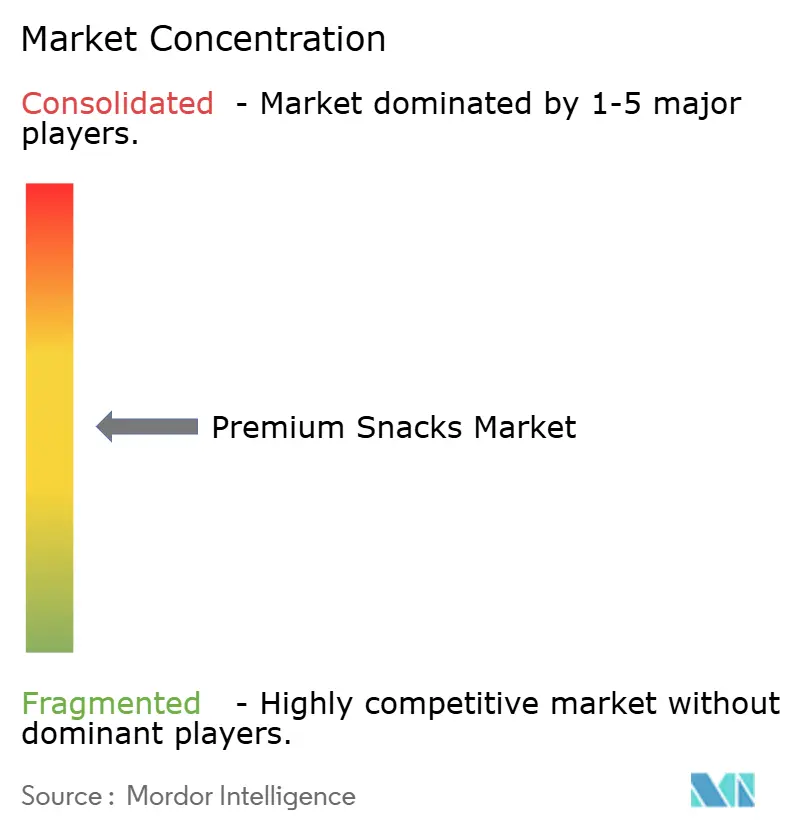
| Market Concentration | Medium |
Major Players *Disclaimer: Major Players sorted in no particular order Image © Mordor Intelligence. Reuse requires attribution under CC BY 4.0. | |
Premium Snacks Market Analysis by Mordor Intelligence
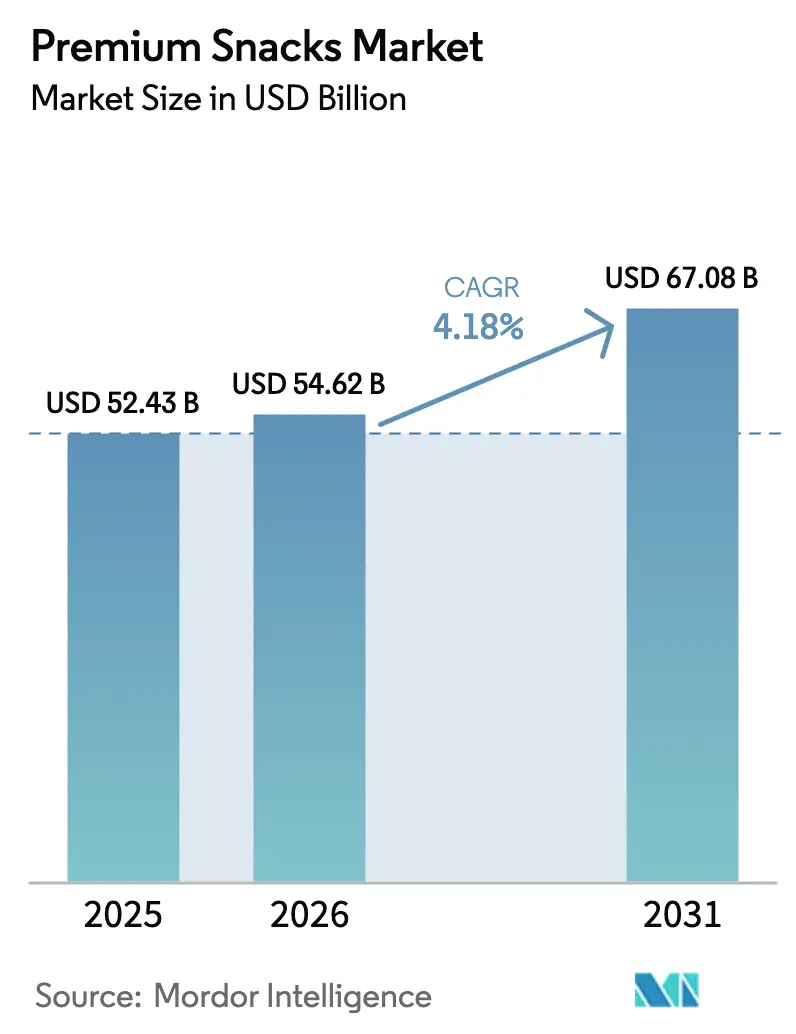
Premium snacks market size in 2026 is estimated at USD 54.62 billion, growing from 2025 value of USD 52.43 billion with 2031 projections showing USD 67.08 billion, growing at 4.18% CAGR over 2026-2031. Consumer behavior has evolved significantly, with premium snacks becoming a standard part of their shopping baskets rather than an occasional purchase. Market expansion is driven by products emphasizing health benefits, transparent ingredient declarations, and functional attributes, which continue to attract consumers even during periods of economic uncertainty. Companies that successfully combine nutritional benefits with unique and satisfying flavor experiences demonstrate strong customer loyalty metrics. The market's competitive structure is undergoing transformation as the rise of digital commerce platforms diminishes the importance of traditional retail shelf space, allowing boutique and artisanal manufacturers to achieve significant market expansion. Furthermore, consumer purchasing decisions are increasingly influenced by their ability to trace product origins and assess environmental impact, compelling companies to invest in advanced supply chain tracking technologies and implement sustainable agricultural practices.
Key Report Takeaways
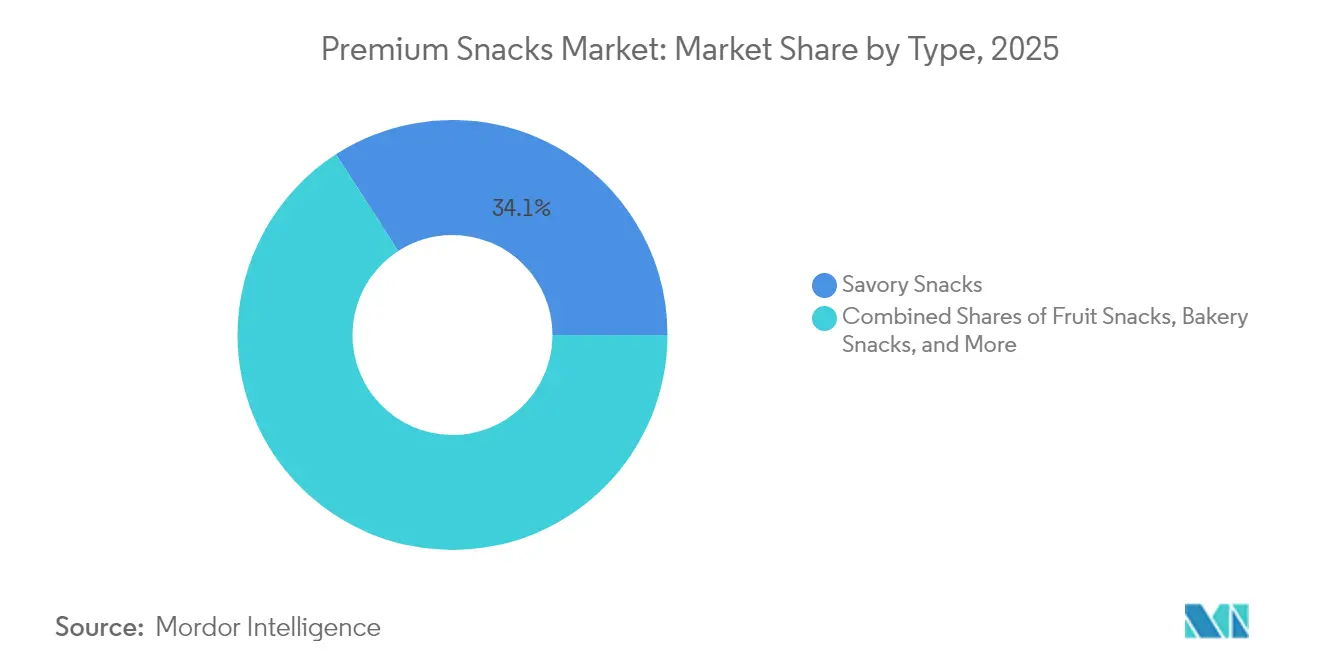
- By type, savory snacks led with 34.12% revenue share in 2025 and are projected to expand at a 5.52% CAGR to 2031.
- By category, conventional formats held 63.05% share in 2025, whereas free-form offerings are positioned for a 5.39% CAGR through 2031.
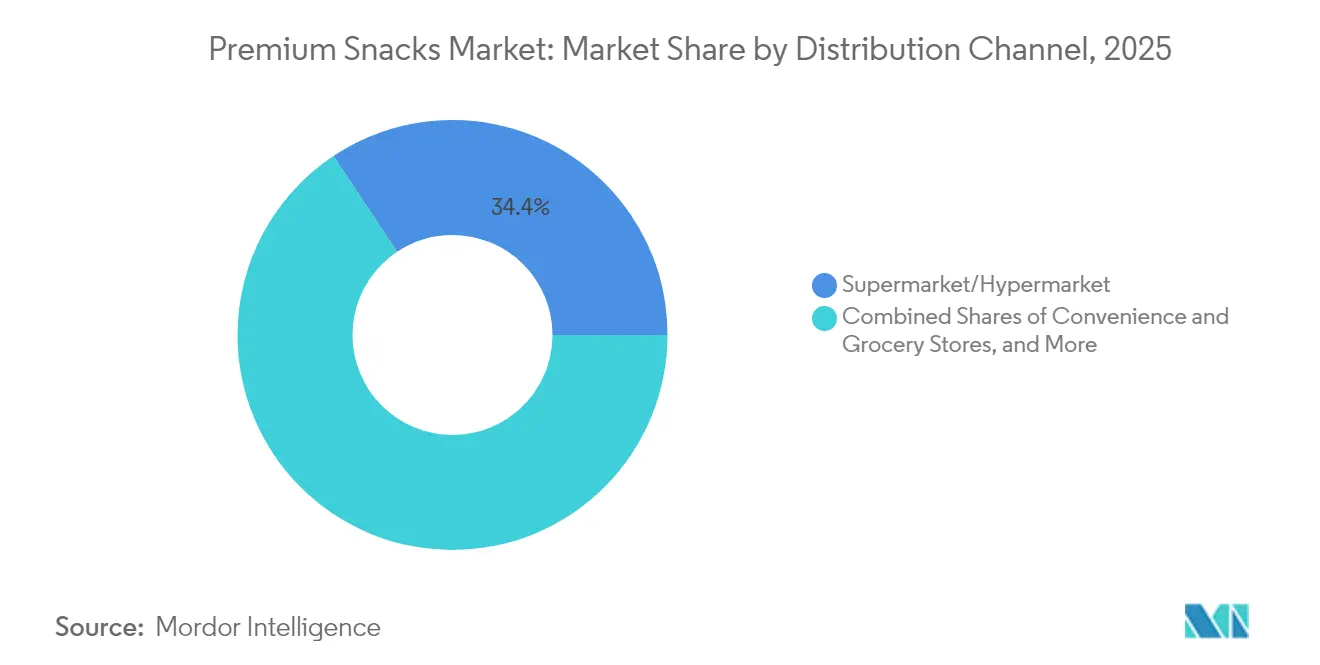
- By distribution channel, supermarkets and hypermarkets retained 34.35% share in 2025, while online retailers are forecast to grow at 5.73% CAGR between 2026-2031.
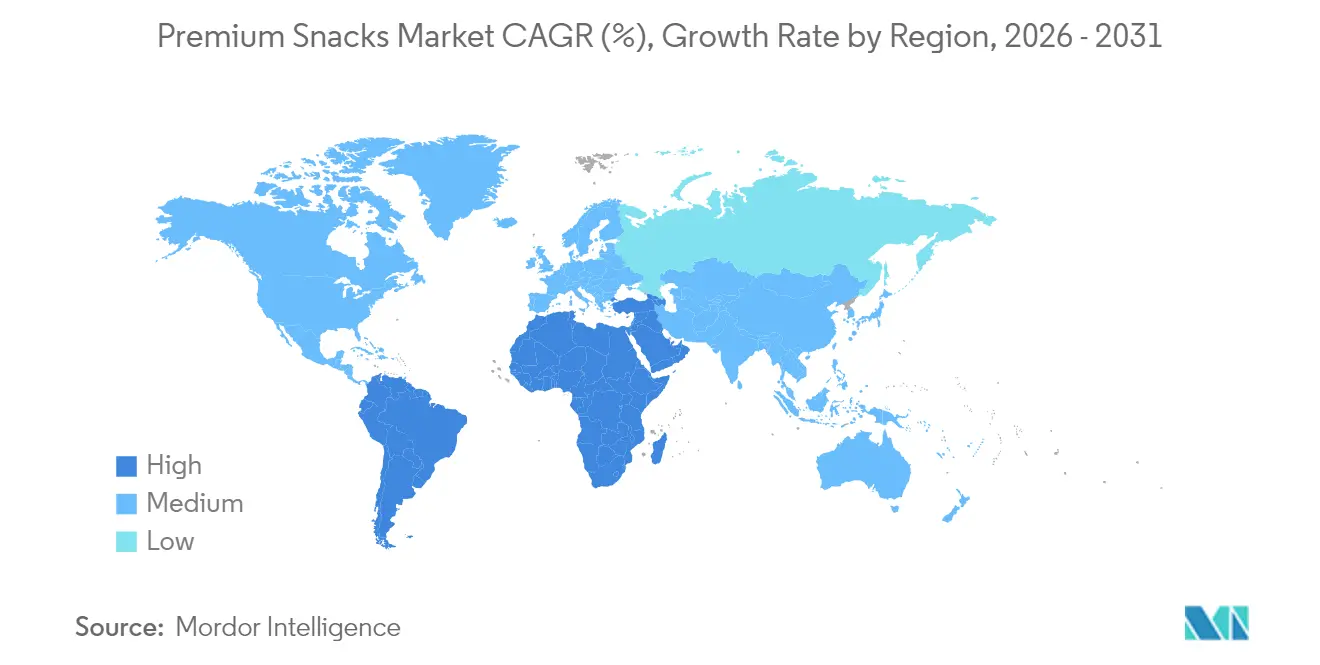
- By geography, Europe commanded 28.10% of 2025 revenue, but Asia-Pacific is expected to post the fastest 5.08% CAGR during the forecast period.
Note: Market size and forecast figures in this report are generated using Mordor Intelligence’s proprietary estimation framework, updated with the latest available data and insights as of 2026.
Market Trends and Insights
Drivers Impact Analysis of Premium Snacks Market*
| Driver | (~) % Impact on CAGR Forecast | Geographic Relevance | Impact Timeline |
|---|---|---|---|
| Rising demand for healthier, low-calorie, and clean-label ingredients | 1.2% | Global, with strongest adoption in North America & EU | Medium term (2-4 years) |
| Growth in consumer preference for plant-based snacks | 0.8% | North America & EU core, expanding to APAC urban centers | Long term (≥ 4 years) |
| Increased demand for gluten-free and allergen-free products | 0.7% | Global, with regulatory support in developed markets | Medium term (2-4 years) |
| Surge in functional snacks | 0.6% | APAC leading, followed by North America | Short term (≤ 2 years) |
| Shift toward organic and non-GMO ingredients | 0.5% | North America & EU, selective APAC markets | Long term (≥ 4 years) |
| Sustainability initiatives in packaging and ingredients sourcing | 0.4% | EU regulatory-driven, expanding globally | Long term (≥ 4 years) |
| Source: Mordor Intelligence | |||
Rising Demand for Healthier, Low-Calorie, and Clean-Label Ingredients
The clean-label reformulation trend enables premium positioning as manufacturers replace artificial additives with natural alternatives. Intersnack Group has successfully eliminated artificial colors and sweeteners across its product portfolio while maintaining natural flavoring, demonstrating effective approaches to ingredient transparency that appeal to health-conscious consumers. The shift extends beyond ingredient substitution to include new preservation methods, with companies like Kerry developing vinegar-based antimicrobials and mushroom fiber solutions for shelf-life extension while maintaining clean-label standards. MycoTechnology's ClearHT ingredient, derived from honey truffle and recently granted FEMA GRAS status, represents an advancement in natural taste modulation that enables sugar reduction without artificial sweeteners. This regulatory approval indicates growing acceptance of biotechnology-derived natural ingredients that meet consumer preferences for both health benefits and familiar tastes. The combination of clean labeling and functional benefits creates premium market opportunities where manufacturers can achieve higher margins through transparent ingredient communication and enhanced nutrition.
Growth in Consumer Preference for Plant-Based Snacks
Plant-based snacks have transformed the market by incorporating protein-rich formulations from legumes, nuts, and seeds, delivering superior nutritional benefits compared to conventional snacks. The market continues to expand through regulatory developments, particularly with EFSA's approval of tiger nut oil. This oil, containing substantial amounts of oleic acid, provides manufacturers with a premium alternative to traditional oils in their snack products [1]Source: European Food Safety Authority, “Safety of Tiger nuts (Cyperus esculentus) oil as a novel food pursuant to Regulation (EU) 2015/2283” efsa.europa.eu. The category has further diversified by incorporating functional ingredients, notably DHA derived from Schizochytrium microalgae. This ingredient, now approved for protein products within specified parameters, enables manufacturers to deliver omega-3 benefits without relying on fish-derived sources. Companies such as Ferrero exemplify industry commitment to sustainability through comprehensive traceable sourcing programs encompassing cocoa, hazelnut, and palm oil, while actively promoting regenerative agriculture practices. The adoption of plant-based products has gained significant momentum in urban markets, driven primarily by environmental consciousness and dietary flexibility, rather than strict vegetarian preferences. Recent manufacturing innovations in extrusion and fermentation technologies have successfully addressed texture-related challenges, eliminating the traditional compromises associated with plant-based formulations.
Increased Demand for Gluten-Free and Allergen-Free Products
The allergen-free product market has significant barriers to entry due to the requirements for specialized manufacturing facilities and segregated supply chains, which allow companies to maintain premium pricing. Organizations such as Every Body Eat and Free2b Foods gain competitive advantages through comprehensive allergen control systems that manage not only gluten but all major allergens, serving a market of approximately 32 million Americans with dietary restrictions. The FDA's Food Safety Modernization Act, effective January 2026, strengthens this market by mandating stricter allergen cross-contamination prevention and supplier verification protocols. The European Food Safety Authority's (EFSA) evaluation of new ingredients, including Acheta domesticus (house cricket), demonstrates the ongoing need for allergenicity research and cross-reactivity studies to develop appropriate labeling and risk assessment methods. Technological improvements in manufacturing now enable the production of gluten-free items that match conventional products in texture and shelf life, removing previous quality limitations. The market continues to expand as celiac disease diagnoses increase and awareness of gluten sensitivity grows, indicating sustained market growth beyond initial consumer adoption.
Surge in Functional Snacks
Functional snacking combines convenience with specific health benefits by incorporating bioactive ingredients that provide measurable physiological effects. These benefits support premium pricing and encourage repeat purchases. For example, FrieslandCampina Ingredients received approval for 16 health claims for its Biotis Vivinal GOS ingredient, demonstrating the regulatory pathway for validated functional benefits. The market now extends beyond traditional vitamins and minerals to include prebiotics, adaptogens, and cognitive enhancement compounds that target specific health concerns like stress management and mental focus. Regulatory bodies, such as EFSA, require comprehensive clinical evidence for functional claims, giving companies that invest in scientific studies and regulatory compliance a competitive edge. Asian markets, particularly Japan with its FOSHU (Foods for Specified Health Uses) system, are at the forefront of functional snack development, influencing global product strategies. Product development emphasizes delivery systems that maximize bioavailability while maintaining taste, including encapsulation and time-release technologies to improve ingredient effectiveness.
Restraints Impact Analysis of Premium Snacks Market*
| Restraint | (~) % Impact on CAGR Forecast | Geographic Relevance | Impact Timeline |
|---|---|---|---|
| Stringent food safety and labeling regulations | -0.4% | Global, with varying compliance costs by region | Medium term (2-4 years) |
| Complexity of supply chain management for high-quality ingredients | -0.3% | Global, acute in emerging markets | Short term (≤ 2 years) |
| Short shelf life for many premium, perishable snacks | -0.3% | Global, particularly challenging for e-commerce | Short term (≤ 2 years) |
| Allergens and dietary restrictions limiting market reach | -0.2% | Developed markets with high allergy awareness | Long term (≥ 4 years) |
| Source: Mordor Intelligence | |||
Stringent Food Safety and Labeling Regulations
The complex regulatory environment in the food industry presents significant operational and financial challenges for premium food manufacturers, particularly affecting smaller brands. These companies face substantial hurdles in managing compliance costs, as they lack the resources and scale advantages that larger competitors possess. The FDA's Food Safety Modernization Act updates, scheduled for 2025-2027, introduce more stringent traceability requirements, with a unified compliance deadline of January 20, 2026, necessitating substantial system upgrades across the industry [2]Source: U.S. Food & Drug Administration, “FSMA Final Rule on Requirements for Additional Traceability Records for Certain Foods,” fda.gov. The regulatory landscape becomes more intricate with state-level variations, as five states implement distinct Extended Producer Responsibility laws for packaging, each with specific requirements for recycled content and recyclability. This regulatory fragmentation forces manufacturers to navigate and comply with multiple frameworks simultaneously. The situation becomes more challenging for companies seeking novel ingredient approvals under EFSA's updated guidance, where despite streamlined processes, comprehensive safety assessments involving detailed compositional data, toxicology studies, and allergenicity testing can extend market entry timelines by 12-18 months. The incomplete harmonization of international regulations further complicates market access for premium brands aiming for global distribution, while functional snack manufacturers face additional pressures due to the requirement for clinical evidence and continuous monitoring for health claim substantiation, creating financial strains particularly for smaller market players.
Complexity of Supply Chain Management for High-Quality Ingredients
Premium ingredient sourcing demands specialized supplier networks and quality control systems, increasing operational complexity and working capital needs compared to conventional snack production. Mondelez International's procurement approach demonstrates these challenges, with 70% of its carbon footprint linked to raw materials, requiring extensive supplier engagement programs and sustainability verification systems beyond the reach of smaller competitors. Traceability requirements become more stringent as companies pursue organic, non-GMO, and sustainably sourced ingredients, requiring documentation across multi-tier supply chains, especially for specialty items like tiger nuts, ancient grains, and exotic fruit extracts. Climate-related disruptions affect premium ingredient availability and pricing, prompting companies like Ferrero to implement risk assessment tools such as Global Forest Watch to monitor deforestation and climate risks in commodity sourcing regions. Premium ingredients require specialized testing and storage conditions, increasing facility investment and operational costs, particularly for temperature-sensitive bioactive compounds and natural preservatives with limited shelf life. Companies pursuing multiple certifications (organic, fair trade, non-GMO) across diverse ingredient portfolios face additional complexity, as separate supply chains and documentation systems strain operational resources.
*Our forecasts treat driver/restraint impacts as directional, not additive. The impact forecasts reflect baseline growth, mix effects, and variable interactions.
Premium Snacks Market Segment Analysis
By Type:
Savory Dominance Drives InnovationSavory snacks dominate the snack food market with a substantial 34.12% market share in 2025, while demonstrating robust growth prospects at a 5.52% CAGR through 2031. The segment's impressive performance can be attributed to successful product innovations that incorporate enhanced protein content, diverse international seasonings, and alternative plant-based formulations. This market leadership position is reinforced by the segment's ability to continuously adapt to changing consumer preferences through flexible ingredient selection and innovative product formats.
Bakery snacks maintain their position as the second-largest category in the market, with cookies and biscuits showing particularly strong performance through their focus on artisanal production methods and clean-label ingredient reformulations. The cakes and pastries subsegment has carved out its niche by targeting consumers seeking indulgent experiences through the incorporation of premium ingredients. In the frozen snacks category, manufacturers address consumer demand for convenience through precise portion control and extended product shelf life. However, this segment experiences slower growth compared to ambient snack categories, primarily due to the operational challenges of cold chain distribution requirements and increasing energy costs associated with frozen storage.


By Category:
Conventional Stability Meets Free-Form InnovationThe free-form products segment demonstrates robust growth with a 5.39% CAGR, signaling a significant shift in consumer preferences and market dynamics. While conventional formats continue to dominate with a substantial 63.05% market share in 2025, the increasing momentum of free-form products indicates evolving consumer demands for innovative packaging and consumption experiences.
The conventional category's strong market position stems from deeply rooted consumer buying habits and well-established manufacturing processes that deliver cost-effective products at scale. Meanwhile, free-form products are carving out their niche by offering enhanced portion control features and improved convenience, attracting premium-seeking consumers. This market evolution presents manufacturers with a critical strategic decision: they can either maximize returns from existing production infrastructure or undertake investments in new equipment and supply chain modifications to capitalize on the growing demand for flexible formats that command higher price points.
By Distribution Channel:
Digital Transformation AcceleratesThe retail landscape is experiencing a significant shift as online retail grows at 5.73% CAGR, outpacing other channels, thanks to better technology and evolving shopping habits. While digital commerce expands rapidly, physical supermarkets and hypermarkets remain the backbone of retail, commanding 34.35% of the market in 2025. What started as a pandemic-driven necessity has transformed into a lasting change in how people shop, with consumers embracing the ease of online purchases and product discovery. Recent data from the U.S. Census Bureau's Retail E-Commerce report (2025) shows e-commerce sales hit USD 292.2 billion unadjusted and USD 304.2 billion seasonally adjusted in Q2 2025, making up 16.3% of total retail sales . Though e-commerce growth has moderated to 5.3% year-over-year, it still outperforms overall retail growth.
The changing retail environment creates a balancing act for premium brands as they work to develop strategies that combine traditional retail partnerships with direct-to-consumer sales opportunities. Local convenience stores and grocery outlets continue to play a vital role by meeting immediate shopping needs and capturing spontaneous purchases. However, they grow more slowly than online channels, which excel by offering wider product ranges and tailored shopping experiences that match individual customer preferences.
Geography Analysis
Europe Premium Snacks Market
The European market stands as the industry leader with a commanding 28.10% share in 2025, reflecting the region's deep-rooted appreciation for premium food products. European consumers consistently demonstrate their preference for artisanal and organic offerings, supported by robust regulatory frameworks that ensure product authenticity and health claim validation. The region's sophisticated premium snacking culture creates natural market barriers while ensuring steady demand for brands focused on quality ingredients and supply chain transparency. Market powerhouses Germany, the United Kingdom, and France drive regional success through their strong purchasing power and advanced retail networks. Emerging markets within Europe, particularly Poland and Belgium, show promising growth potential as their middle-class consumer base expands. The European Union's unified regulations facilitate seamless cross-border trade while maintaining high standards that protect established premium brands in the market.
The Americas, APAC and MEA Premium Snacks Market
The Asia-Pacific region emerges as the market's growth engine, advancing at a robust 5.08% CAGR through 2031. This impressive growth stems from the region's rapid urban development and rising consumer affluence, particularly in China and India's tier-2 cities, where new consumer segments are actively seeking premium products. International brands are finding success through thoughtful localization strategies, while local companies leverage their market knowledge and distribution strengths to capture premium market segments. China's nutrition bar segment exemplifies this growth trajectory, expanding at an exceptional 22.8% CAGR. Southeast Asian markets are benefiting from the digital retail revolution, enabling premium brands to connect directly with consumers. Japan's established FOSHU regulatory framework provides clear pathways for functional food approvals, influencing product innovation across the region.North America maintains its strong market position through well-established premium snacking categories and consumers' readiness to invest in health-focused products, despite showing signs of market maturity in core segments. The region's business-friendly regulatory environment, particularly the GRAS pathway, encourages product innovation, while established organic and non-GMO certification systems support premium market positioning. Mexico presents fresh opportunities as its economic growth drives demand for premium snacks that blend traditional flavors with modern convenience. The South American and Middle East & African markets hold significant long-term potential, with improving economic conditions and retail infrastructure creating new opportunities for premium brands willing to invest in regional expansion and regulatory compliance.

Regulatory Landscape
Regulation for premium snacks is being shaped by tighter requirements on food safety, labeling, and substantiation of health and functional claims, which increases compliance expectations for both large manufacturers and newer premium brands. In the United States, the FDA Food Safety Modernization Act (FSMA) traceability compliance deadline of January 20, 2026 is a key catalyst for investments in traceability systems and supplier verification, especially for premium claims linked to origin, allergens, and ingredient integrity.
In 2026, the FDA Human Foods Program has highlighted priority deliverables that include workstreams affecting packaged foods, including front-of-pack nutrition labeling (targeted for early 2026 actions) and potential changes to the GRAS pathway, including a proposal around mandatory GRAS notice submission. At the same time, attention to definitions and marketing of ultra-processed foods is increasing, and litigation actions at the local-government level (for example, the City of San Francisco pursuing claims against major food companies over health impacts and marketing of ultra-processed foods) add reputational and legal scrutiny to premium snack portfolios competing on better-for-you positioning.
Value Chain Analysis
The premium snacks value chain starts with sourcing differentiated inputs (specialty grains, nuts, cocoa, functional ingredients, clean-label preservatives), then moves through processing and formulation, packaging, distribution, and multi-channel retail execution. Upstream, premium positioning increases reliance on audited suppliers and multi-tier documentation for certifications and claims, while also raising exposure to ingredient availability and price volatility for specialty and sustainably sourced raw materials. Manufacturers typically respond through tighter supplier qualification, traceability and transparency programs, and reformulation capabilities, reflecting the industry shift toward track-and-verify supply chains driven by consumer disclosure expectations and food-safety compliance.
Midstream, manufacturing and packaging are key value-adding steps where shelf-life management and sensory quality protect margins in ambient and e-commerce channels. Technologies such as improved moisture and oxygen barriers and freshness-preserving packaging formats are increasingly used for premium, clean-label products with fewer synthetic preservatives. Downstream, distribution splits between traditional retail (where planograms and SKU rationalization constrain access) and growing online and direct-to-consumer routes that reward brand storytelling, high ratings, and efficient fulfillment; this mix requires coordination of demand planning, inventory turns, and packaging suitability across both physical and digital shelves.
Competitive Landscape
The premium snacks market shows a balanced mix of large multinational corporations and smaller regional players working side by side. Regional companies have built their market presence by focusing on health-conscious products, sustainable practices, and high-quality artisanal production. Companies across the market are taking control of their supply chains through vertical integration, with Mondelez leading by example through its USD 1 billion investment in Cocoa Life programs by April 2025. This investment helps Mondelez secure its raw material supply while strengthening its position as a sustainability-focused company that premium consumers trust. Companies are also embracing new technologies, from blockchain systems that track products to AI that predicts consumer demand and automated systems that maintain product quality, all working together to reduce costs and deliver consistent products.
The functional snacks category offers significant business potential, especially where regulatory requirements create barriers to entry. Companies that invest time and resources in clinical testing and new ingredient development gain a competitive edge in this space. New companies are changing the market by selling directly to consumers and using social media marketing to avoid traditional retail channels. Established companies have responded by buying these innovative brands and creating innovation labs that allow them to develop new products with the speed and flexibility of a startup.
Success in the market now depends on companies' ability to balance environmental responsibility with efficient operations. Today's consumers want to know their snacks are produced sustainably but won't accept lower quality or less convenience. Companies that understand and follow complex food safety regulations have an advantage, especially as these requirements become stricter. This advantage becomes even more important when expanding internationally, where companies need both regulatory expertise and financial strength to navigate different countries' approval processes.
Premium Snacks Industry Leaders
PepsiCo Inc.
Mondelez International
Kellanova
General Mills Inc.
Conagra Brands, Inc.
- *Disclaimer: Major Players sorted in no particular order
Premium Snacks Market Companies Covered in this Report
- PepsiCo Inc.
- Mondelez International
- Kellanova
- General Mills Inc.
- Conagra Brands, Inc.
- Mars Incorporated
- Nestlé S.A.
- Campbell Soup Company
- B&G Foods, Inc.
- Hershey Co.
- Chocoladefabriken Lindt & Sprüngli AG
- Keurig Dr Pepper
- Calbee Inc.
- Orion Corp.
- Unilever PLC
- Lotus Bakeries NV
- J&J Snack Foods Corp.
- Arca Continental
- Ferrero Group
- Berco’s Popcorn

Market Opportunities and Future Outlook
Opportunity is building around reformulation and portfolio architecture that fit tightening definitions, labeling expectations, and scrutiny of ultra-processed foods, while still supporting premium taste and clear product claims. The FDA focus in 2026 on front-of-pack nutrition labeling and possible changes to GRAS notice practices reinforces the need for stronger ingredient dossiers, claims governance, and more transparent on-pack communication, creating differentiation headroom for premium brands that can back verified sourcing, cleaner labels, and substantiated functional benefits. Local-government litigation actions targeting marketing and health impacts of ultra-processed foods (for example, the City of San Francisco’s action involving large food companies) further raises the value of compliance-by-design marketing, conservative claims language, and product renovation toward simpler ingredient decks.
Retail execution is also creating whitespace for premium snacks that match clearer shopper missions and tighter category segmentation. Retailers are reorganizing snack sets into distinct lanes (premium indulgence, functional protein/better-for-you, and value/private label), which favors brands with a focused proposition and channel-specific pack-price architecture rather than broad, undifferentiated assortments. At the same time, demand for global and more complex flavor profiles supports innovation in savory and premium indulgence lines, while functional-protein innovation and allergen-managed manufacturing help translate premium price points across supermarkets, club formats, and online discovery-led shopping.
Recent Industry Developments in Premium Snacks Market
- July 2026: Ancient Crunch expanded MASA snack distribution into 326 Target stores nationwide. The expansion strengthens direct-to-consumer reach and increases presence in mainstream channels, supporting brand visibility in the premium MASA segment.
- July 2026: Wicked Cutz Licensing partnership with Cinnabon to produce bakery-inspired meat snacks (including bacon jerky). The partnership provides access to Cinnabon’s brand halo to drive portfolio diversification and reinforce premium positioning.
- June 2026: Second Nature Brands agreed to acquire Tillamook Country Smoker from Insignia Capital Group. The deal strengthens scale, distribution, and product diversification in premium protein snacks, reinforcing its position in the category.


Premium Snacks Market Report Scope and Research Methodology
Market Definition and Coverage
For this study, the premium snacks market covers packaged snack products positioned at a higher price point due to better ingredients, functional or clean-label claims, distinctive flavors, and premium packaging, and it is measured as manufacturer-level value sold through key retail and online channels.
Scope exclusions: Foodservice-only snack sales, unpackaged snacks, and private home-prepared snack items are excluded from this market sizing.
Segments Covered in This Report
- By Type
- Frozen Snacks
- Savory Snacks
- Fruit Snacks
- Bakery Snacks
- Cookies and Biscuits
- Cakes
- Pastries
- Others
- Others
- By Category
- Conventional
- Free-Form
- By Distribution Channel
- Supermarket/Hypermarket
- Convenience and Grocery Stores
- Online Retailers
- Others
- By Geography
- North America
- United States
- Canada
- Mexico
- Rest of North America
- Europe
- Germany
- United Kingdom
- Italy
- France
- Spain
- Netherlands
- Poland
- Belgium
- Sweden
- Rest of Europe
- Asia-Pacific
- China
- India
- Japan
- Australia
- Indonesia
- South Korea
- Thailand
- Singapore
- Rest of Asia-Pacific
- South America
- Brazil
- Argentina
- Colombia
- Chile
- Peru
- Rest of South America
- Middle East and Africa
- South Africa
- Saudi Arabia
- United Arab Emirates
- Nigeria
- Egypt
- Morocco
- Turkey
- Rest of Middle East and Africa
- North America
Data Sources, Market Sizing, and Validation
Desk Research
We start by building a clear demand and supply picture for premium snacks using public statistics and category references that can be checked. Useful inputs come from sources such as USDA and other national agriculture and food statistics offices, UN Comtrade trade flows for snack ingredients and finished foods, World Bank and IMF macro indicators for income and food inflation, and regulators such as the US FDA for labeling frameworks that influence premium claims.
The desk work is then complemented with company filings, annual reports, investor presentations, and reputable press coverage to understand portfolio mix and channel exposure. Where available, we also use paid databases for company financials and news, patent databases to track ingredient and processing activity, and an import-export shipment-level database to sanity-check trade-linked movements in relevant snack categories. These desk research sources are illustrative and not exhaustive, and additional references were used to collect data, validate assumptions, and clarify gaps.
Primary Interviews and Surveys
Primary work was used to test what buyers and sellers consider premium in day-to-day pricing and shelf placement, which is where desk assumptions can drift. We spoke with a mix of manufacturers, ingredient suppliers, distributors, and retail-side category voices across major regions to validate channel splits, premium price uplifts, and the pace of reformulation (such as sugar reduction and cleaner ingredient swaps).
Distribution of primary research fieldwork respondents
| Company type | Respondent position | Region |
|---|---|---|
| Top tier: 27% | CXOs: 12% | APAC: 41% |
| Mid tier: 59% | Functional/Unit leaders: 35% | EMEA: 37% |
| Smaller Players: 14% | Managers: 53% | Americas: 22% |
Market-Sizing & Forecasting
The market is first reconstructed using a top-down approach where food and grocery spending, packaged snack category splits, and premiumization rates are layered by geography and then converted into value using consistent currency timing. We then corroborate the totals with selective bottom-up approximations using sampled brand and retailer price checks, estimated premium price uplifts versus mainstream ranges, and supplier and channel checks on volume movement, which helps adjust for overcounting in overlapping categories.
Key model inputs include premium price uplift by snack type, online retail penetration for snack purchases, shares of clean-label and better-for-you claims within snacks, raw material cost signals (nuts, cocoa, dairy, grains), and observed packaging and portion-size shifts that influence realized pricing. For forecasting, scenario analysis is used to reflect different consumer trade-up and trade-down behaviors under inflation, and the assumptions are aligned with expert views gathered in primary discussions. When indicators are incomplete for smaller brands, gaps are handled through region-level penetration proxies and observed price ladders, and then assumptions are rechecked until the outputs stay consistent across channels.
Data Validation & Update Cycle
We validate the model by checking whether implied per-capita snack spending and premium share levels look realistic against independent food expenditure indicators, trade signals, and inflation paths. Outliers are reviewed region by region, and if a channel split or price uplift looks too aggressive, the underlying assumptions are revisited and, when needed, experts are re-contacted for a quick sense-check.
Before sign-off, the file goes through multi-step analyst review where calculation links, currency conversions, and year mappings are rechecked for mistakes. Reports are refreshed annually, and interim updates are made when material events shift pricing, labeling, or channel behavior. Right before delivery, a final pass is done so clients receive the most current view available at that time.
Mordor Intelligence's Premium Snacks Market Estimate Compared With Other Published Estimates
Different published values for premium snacks can look far apart because the word premium is interpreted in more than one way, and because some sources mix retail sales with manufacturer-level value. The year used as the starting point, currency timing, and whether online pricing is treated the same as in-store pricing can also move the final number.
The main gap comes from how premium is counted, where Mordor Intelligence includes only snacks that show sustained price uplift plus differentiated ingredients or claim-led packaging, rather than starting from broad snack totals and labeling a portion as premium. Another driver is category overlap, since some estimates fold in adjacent items like general gourmet foods or treat ranges, which can inflate the total even when the purchase occasion is not mainly snacking.
Benchmark comparison
| Source | Market Size | Gaps in Research Methodology |
|---|---|---|
| Mordor Intelligence | USD 54.62 B (2026) | |
| Global Consultancy A | USD 31.10 B (2025) | Uses a narrower premium screen that can undercount premium extensions within large snack portfolios, and it applies a longer-horizon growth lens that smooths short-term channel shifts. |
| Industry Publisher B | USD 30.00 B (2024) | Starts from an earlier base year and appears to apply tighter product inclusion rules, which can exclude premium items that signal quality through packaging and ingredients rather than category labels. |
The spread in the table is mainly explained by premium-definition rules, base-year choice, and how closely each model ties value to observable price ladders across channels. When the steps are anchored to repeatable indicators like price uplift, claim intensity, and channel mix, the resulting number becomes easier to audit and update as conditions shift.


Key Questions Answered in the Report
What is the 2026 value of the premium snacks market?
The premium snacks market size reached USD 54.62 billion in 2026.
Which snack type holds the largest share?
Savory snacks led with 34.12% share in 2025 and continue to outpace other categories.
Which region will grow fastest through 2031?
Asia-Pacific is forecast to log a 5.08% CAGR, the strongest regional pace.
How fast will online channels expand?
Sales via online retailers are projected to rise at a 5.73% CAGR from 2026-2031.
Which recent deal reshaped the leadership landscape?
Mars’ USD 35.9 billion acquisition of Kellanova in April 2025 created the world’s largest snacking company.
Page last updated on:


 Your data is secure and never sold or shared.


