
Precipitated Silica Market Size and Share
Market Overview
| Study Period | 2021 - 2031 |
|---|---|
| Market Volume (2026) | 3.38 Million tons |
| Market Volume (2031) | 4.08 Million tons |
| Growth Rate (2026 - 2031) | 3.86 % |
| Fastest Growing Market | Asia Pacific |
| Largest Market | Asia Pacific |
| Market Concentration | Medium |
Major Players *Disclaimer: Major Players sorted in no particular order Image © Mordor Intelligence. Reuse requires attribution under CC BY 4.0. | |
Precipitated Silica Market Analysis by Mordor Intelligence
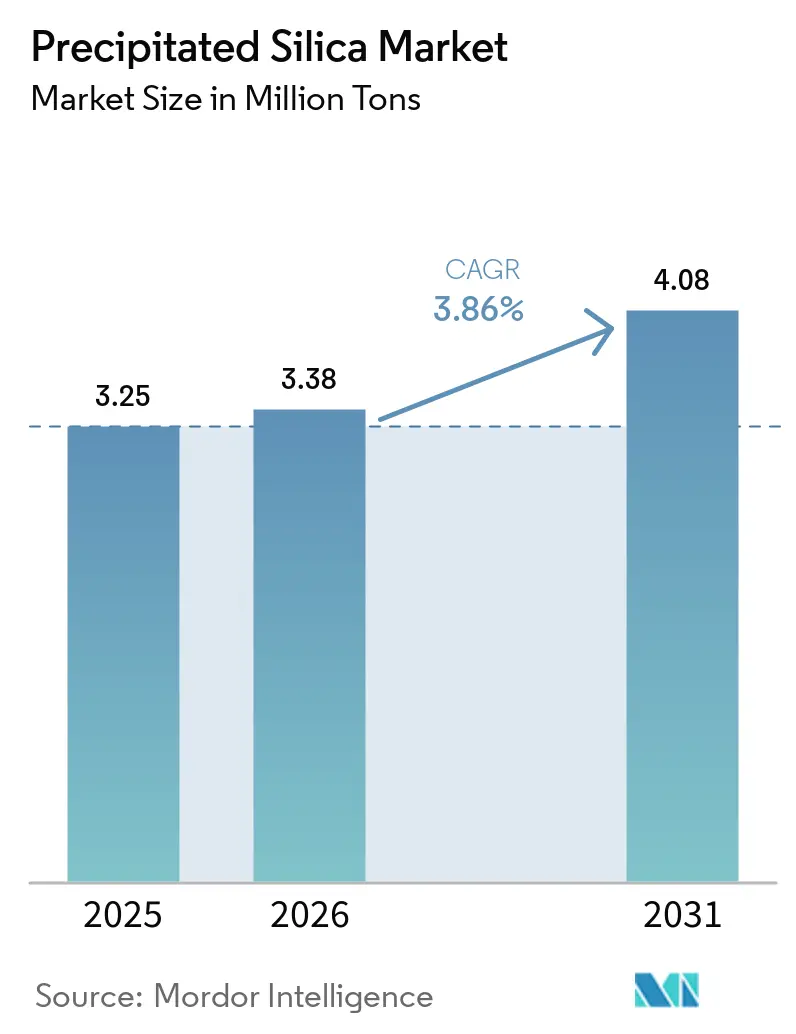
The Precipitated Silica Market size is expected to increase from 3.25 Million tons in 2025 to 3.38 Million tons in 2026 and reach 4.08 Million tons by 2031, growing at a CAGR of 3.86% over 2026-2031. Momentum stems from electric-vehicle (EV) tire formulations that demand higher-performance rubber grades, coupled with food regulators endorsing ultra-pure amorphous silica for clean-label products. Wet-process routes still contribute 75.21% of 2025 volume, yet dry-process output is expanding at 4.89% annually as producers seek lower energy intensity and niche battery-separator applications. Asia-Pacific commands a 50.24% share in 2025 and leads future growth at a 3.95% CAGR in 2026-2031, helped by rice-husk-ash valorization projects that trim raw-material costs by 15-20% against conventional sodium-silicate pathways. Competitive intensity remains moderate, with the five largest suppliers holding roughly half of installed capacity, while mid-tier players scale biomass-based lines and ultra-pure grades for lithium-ion batteries.
Key Report Takeaways
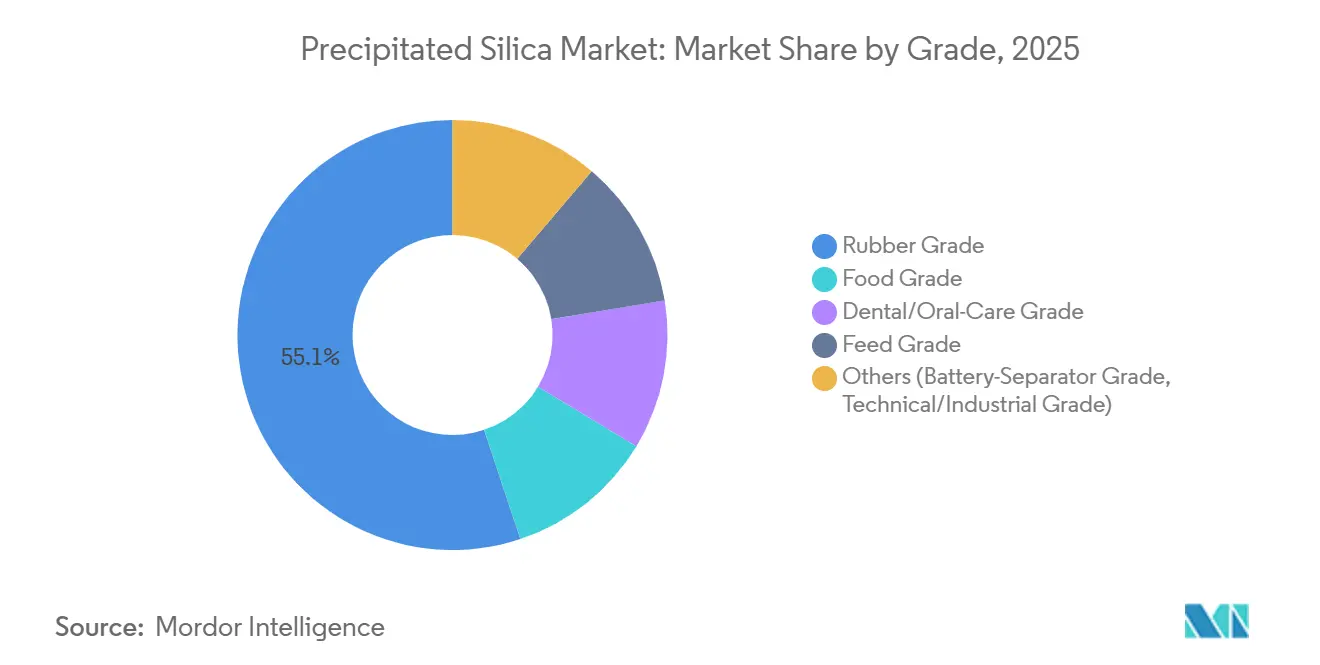
- By grade, rubber grade held 55.12% of the precipitated silica market share in 2025, while food grade is projected to post the fastest 4.56% CAGR through 2031.
- By form, powder dominated with 48.31% revenue share in 2025; beads are set to expand at a 6.34% CAGR to 2031.
- By production process, the wet route commanded 75.21% of the precipitated silica market in 2025, whereas the dry route is forecast to grow 4.89% annually during 2026-2031.
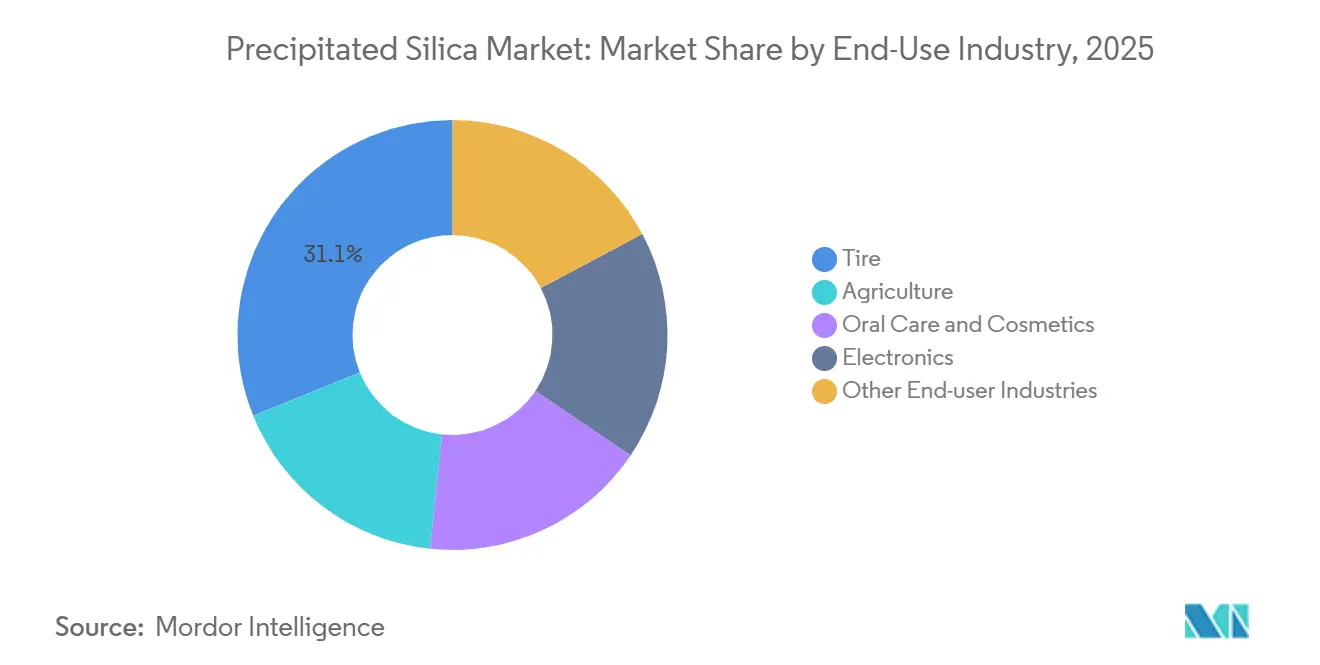
- By end-use industry, tires accounted for 31.12% of global volume in 2025; oral-care and cosmetics applications are advancing at a 4.20% CAGR through 2031.
- By geography, the Asia Pacific captured 50.24% of global demand in 2025 and leads growth at a 3.95% CAGR to 2031.
Note: Market size and forecast figures in this report are generated using Mordor Intelligence’s proprietary estimation framework, updated with the latest available data and insights as of January 2026.
Market Trends and Insights
Drivers Impact Analysis of Precipitated Silica Market*
| Driver | (~) % Impact on CAGR Forecast | Geographic Relevance | Impact Timeline |
|---|---|---|---|
| Electrification-driven demand for silica-enhanced EV tires | +0.9% | Global, concentrated in China, EU, North America | Medium term (2-4 years) |
| Regulatory push for low-rolling-resistance green tires | +0.7% | EU, North America, Japan, South Korea | Short term (≤ 2 years) |
| Food-grade silica uptake in clean-label formulations | +0.5% | North America, EU, urban Asia-Pacific | Medium term (2-4 years) |
| Rice-husk-ash circular-economy silica scale-up | +0.6% | China, India, Thailand, Vietnam | Long term (≥ 4 years) |
| High-purity silica for Li-ion battery separators | +0.4% | Asia-Pacific, North American EV hubs | Long term (≥ 4 years) |
| Source: Mordor Intelligence | |||
Electrification-Driven Demand for Silica-Enhanced EV Tires
Instant torque and heavier battery packs make EV tires wear faster, yet range targets force automakers to curb rolling resistance. Raising precipitated silica loadings from 10–15 phr to 20–30 phr cuts hysteresis by up to 25% while preserving grip[1]. China built 9.5 million battery-electric and plug-in hybrid vehicles in 2025, each consuming four to five tires with silica content 40–60% higher than combustion models, equating to roughly 50,000–70,000 t of incremental annual demand locally. Tightened EU tire-labeling thresholds that took effect mid-2024 reinforce the shift, and North American OEMs have adopted similar procurement specs, embedding silica into baseline tire designs irrespective of oil-price swings. The trend locks in structural growth for the precipitated silica market, encouraging producers to invest in dedicated EV-grade capacity across all regions.
Regulatory Push for Low-Rolling-Resistance Green Tires
Corporate Average Fuel Economy rules set 49 mpg targets for model-year 2026 passenger cars in the United States, compelling automakers to mandate low-rolling-resistance tires that can deliver 3–5% fuel savings[2]. ASTM F2493 test procedures and ISO 28580 harmonization let tire makers validate silica formulations consistently worldwide. Japan and South Korea award top tire-label grades only for rolling-resistance coefficients under 9.0, a level nearly unreachable without silica reinforcement, and both markets exceeded 70% silica penetration in passenger-car tires during 2025. These synchronized policies form a compliance floor that shields the precipitated silica market from short-term price cycles, thereby sustaining capacity-expansion pipelines.
Food-Grade Silica Uptake in Clean-Label Formulations
Retailers and consumers favor short ingredient lists, prompting food processors to replace synthetic anti-caking agents with amorphous precipitated silica. The U.S. FDA lists silicon dioxide as Generally Recognized as Safe up to 2 wt% in food powders. Its 150–200 m²/g surface area adsorbs ambient moisture efficiently, preventing caking in salt, beverage mixes, and spice blends even at tropical warehouse humidity. Innova Market Insights recorded an 8% rise in global clean-label launches during 2024, and 22% of new dry-mix items contained silicon dioxide. Suppliers now certify production lines under ISO 22000 and FSSC 22000, bolstering brand confidence. Consequently, food-grade volumes underpin part of the 4.56% CAGR forecast and broaden the geographic spread of the precipitated silica market beyond automotive hubs.
Rice-Husk-Ash Circular-Economy Silica Scale-Up
Asia burns roughly 200 million t of rice husk annually, yielding ash that contains 85–95% silica. Converting this biomass by-product avoids virgin quartz mining and lowers feedstock cost to USD 30–50 t⁻¹, against USD 150–180 t⁻¹ for sodium silicate and sulfuric acid. China’s ash-based silica revenue stood at CNY 430 million (USD 60 million) in 2024 and is expected to top CNY 1 billion (USD 140 million) by 2030. Evonik’s 2024 supply agreement with Phichit Bio Power in Thailand trims raw-material spend by 15–20% and cuts Scope-3 emissions, aligning with EU Carbon Border Adjustment mechanisms. The model scales readily across India, Vietnam, and Indonesia, giving local players a structural cost edge and nudging global producers to rethink feedstock portfolios. This resource efficiency adds resilience to the precipitated silica market over the long term.
Restraints Impact Analysis of Precipitated Silica Market*
| Restraint | (~) % Impact on CAGR Forecast | Geographic Relevance | Impact Timeline |
|---|---|---|---|
| Tight sulphuric-acid supply inflating costs | -0.60% | Global, acute in Asia-Pacific and North America | Short term (≤ 2 years) |
| Automotive OEM production-cycle volatility | -0.50% | Global, concentrated in North America, EU, China | Medium term (2-4 years) |
| Consumer backlash on silica micro-plastics (personal care) | -0.10% | EU, North America | Short term (≤ 2 years) |
| Source: Mordor Intelligence | |||
Tight Sulfuric-Acid Supply Inflating Costs
Precipitated silica synthesis needs 0.3–0.4 t of sulfuric acid per tonne of product. US elemental sulfur output slid 5% to 8.2 million t in 2024, driving Tampa contract acid prices from USD 69/t in Q1 2024 to USD 116/t by year-end, a 68% surge. Chinese spot prices climbed even faster due to smelter shutdowns and export curbs. Producers weigh backward integration into sulfur recovery, yet regeneration plants cost more than USD 50 million, and paybacks stretch past five years. These cost spikes compress gross margins, particularly for commodity powder grades, and temper near-term investment appetite in the precipitated silica market.
Automotive OEM Production-Cycle Volatility
Tires account for 31.12% of 2025 volumes, and original-equipment orders swing with light-vehicle output. Semiconductor shortages, labor actions, and fluctuating credit costs pushed global production down 3% in early 2025, whipsawing tire plant schedules. A 1-point decline in vehicle builds removes roughly 15,000–20,000 t of silica demand, pressuring capacity utilization below the 75% breakeven threshold. Suppliers diversified into food, oral care, and electronics weather shocks better, yet mono-product tire specialists feel more acute volatility. Persistent cyclicality caps upside potential for the precipitated silica market, even as long-term electrification trends remain favorable.
*Our forecasts treat driver/restraint impacts as directional, not additive. The impact forecasts reflect baseline growth, mix effects, and variable interactions.
Precipitated Silica Market Segment Analysis
By Grade:
Rubber Still Dominates While Food AcceleratesRubber-grade silica held 55.12% of volume in 2025, reflecting entrenched use in low-rolling-resistance tire tread. Food-grade volumes, though smaller, are growing at 4.56% CAGR through 2031, the fastest among all grades, as global brand owners adopt clean-label anti-caking agents. Dental-silica abrasives reached about USD 500 million in 2025, backed by rising toothpaste penetration in emerging economies. These dynamics keep rubber volumes high, yet incremental growth increasingly stems from food and oral-care niches, diversifying revenue streams inside the precipitated silica market.
Steady regulatory frameworks, the FDA’s GRAS rule 21 CFR 172.480, and EFSA’s 2018 opinion, lower reformulation risk for food processors, underpinning the grade’s expansion. Meanwhile, rice-husk-ash feedstock demonstrates that biomass routes can deliver tire-grade surface areas, narrowing cost gaps with wet-process incumbents. By 2031, food and oral-care grades together could approach one-third of the precipitated silica market size for specialty applications, challenging the traditional dominance of rubber compounds.

By Form:
Powder Leads but Beads SurgePowder accounted for 48.31% of 2025 shipments because it disperses easily into rubber and plastics. Beads, however, are advancing at 6.34% CAGR on the back of toothpaste and cosmetic gel demand, where uniform spheres prevent grit and maintain flow. Spray-drying investments of USD 5–10 million per line have lifted bead capacity across Taiwan, Japan, and India, trimming supply-chain lead times. Powder will remain the workhorse, yet beads are set to carve a premium sub-segment of the precipitated silica market, bolstered by microplastics regulations that exclude inorganic silica from polymer restrictions.
Consistent particle morphology allows beads to meet European microbead replacements, and oral-care brands capitalize on marketing claims around faster dissolution. Granules continue serving agricultural blends, while micro-pearls hold niche cosmetic and coating positions. As a result, beads could exceed 20% of form sales by 2031, shifting revenue mix and raising average selling prices across the precipitated silica market.
By Production Process:
Wet Route Prevails While Dry Gains ShareWet processing generated 75.21% of 2025 volume thanks to its ability to hit surface areas of 150–250 m²/g, vital for premium tire and oral-care grades. Dry processing is catching up, growing at 4.89% CAGR, especially in coatings and plastics, where 80–100 m²/g suffices. Dry plants avoid acid entirely and can tap flue-gas CO₂, fitting circular-economy narratives in Europe and China. Capital costs run 20% lower than wet plants, yet product versatility remains narrower. Still, lower energy intensity positions dry processing as a credible alternative for commodity applications within the precipitated silica market.
Wet plants face variable-cost exposure to sulfuric acid and must manage sodium-sulfate by-product, sometimes incurring USD 20–30/t in disposal or logistics. Hybrid biomass-wet routes under pilot in China seek 15–20% energy cuts, hinting at convergence. Over the long run, dry technologies could rise above 30% share of the precipitated silica market size as sustainability metrics tighten.
By End-Use Industry:
Tires Anchor, Oral Care OutpacesTires absorbed 31.12% of 2025 demand, cementing the sector’s anchor role. Yet oral-care and cosmetics are climbing at 4.20% CAGR through 2031 as toothpaste penetration widens in Asia and Latin America. Electronics, chiefly battery-separator coatings using mesoporous silica, offer small but fast-growing volumes, while agriculture and industrial coatings scale in line with GDP. If EV adoption meets policy targets, tire silica intensity may climb another 10–15 phr, keeping absolute tire tonnage growing despite mature vehicle markets. Meanwhile, oral-care demand dispersion across geographies balances cyclical automotive swings, stabilizing the precipitated silica market revenue mix.
Regulatory clarity helps; the FDA anticaries monograph permits up to 10 wt% silicon dioxide in toothpaste, and the EU Cosmetics Regulation lists it without concentration caps. These guardrails embolden formulators. Battery separator demand, although nascent, commands premium pricing and raises the technological barrier to entry, reinforcing competitive moats for incumbents with ultra-pure processing capabilities. This interplay sustains multi-segment growth avenues for the precipitated silica market.
Geography Analysis
APAC Precipitated Silica Market
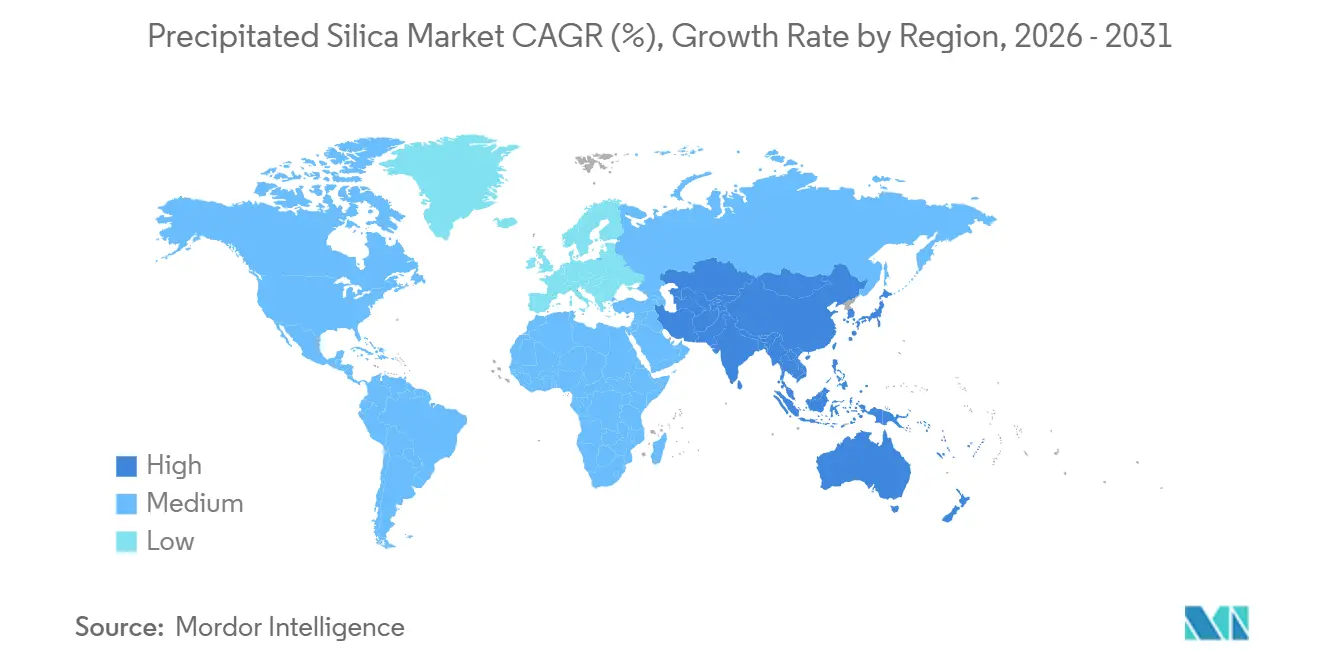
Asia-Pacific retained 50.24% of 2025 volume and is set for 3.95% CAGR through 2031. China’s 9.5 million EV output in 2025 underpins local tire-grade silica demand, while rice-husk-ash projects across China, India, and Thailand unlock low-cost supply. Japan and South Korea enforce stringent tire-label grades that require silica reinforcement, pushing regional penetration above 70%. Thai biomass tie-ups, such as Evonik’s Map Ta Phut venture, enhance feedstock security and carbon credentials. This momentum keeps Asia at the core of the precipitated silica market investment cycle.
North America and Europe Precipitated Silica Market
In North America and Europe, Evonik’s Charleston expansion, operational in January 2026, boosts wet-process capacity by 50% to serve rising EV-tire orders, while Qemetica’s purchase of PPG’s assets added 200,000 t pa across Lake Charles and Delfzijl. EU tire-label tightening and microplastics bans accelerate silica substitution in both automotive and personal-care channels. However, sulfuric-acid price inflation weighs on European and US producers, highlighting cost-structure disparities across the precipitated silica market.
South America and MEA Precipitated Silica Market
South America and the Middle East & Africa show selective growth pockets. Brazil’s tire industry recovered alongside 2.1 million vehicle sales in 2024, spurring local demand. Argentina’s fertilizer blenders employ silica as a flow agent, while Gulf Cooperation Council nations aim to backward-integrate specialty silica into downstream petrochemicals clusters. Logistics costs from Asia often add USD 100–150/t, protecting entrenched wet-process suppliers. These regions thus remain strategic second-tier opportunities within the precipitated silica market landscape.
Mordor Intelligence provides coverage of the precipitated silica market across other key regional markets. Detailed country-level analysis extends to India incorporating local coverage and market participation, as required.
Regulatory Landscape
Precipitated silica (silicon dioxide, including CAS 7631-86-9) falls under mainstream chemical-control frameworks such as EU REACH/CLP and the US Toxic Substances Control Act (TSCA). In Europe, ECHA has an active harmonised classification process for silicon dioxide, including a 2025 RAC opinion cited in public ECHA substance information. This provides a compliance driver for upstream producers and downstream users, including tires, cosmetics, and industrial formulations, if classification and labeling expectations change.
For food and other consumer uses, acceptance frameworks shape grade qualification and documentation requirements. In the United States, silicon dioxide remains on the active TSCA inventory, and the US EPA finalized new-chemicals procedural regulations published on December 18, 2024, effective January 17, 2025. The updated procedures tighten regulatory expectations under the amended TSCA, increasing the importance of current regulatory dossiers and product stewardship declarations for suppliers serving regulated end uses.
Value Chain Analysis
The precipitated silica value chain begins with feedstocks and utilities, then proceeds through wet or dry production before moving into highly specified downstream formulation markets. Upstream dependence is anchored in sodium silicate (from silica sand and soda ash) and mineral acids for the wet route, alongside substantial energy and water inputs. As a result, the chain is sensitive to sulfuric-acid availability and energy logistics. Industrialization of alternative feedstock routes is also starting to show up in supply strategies, including Solvay inaugurating a bio-circular silica facility in Livorno, Italy in January 2026 for highly dispersible silica targeted at tire compounds.
Midstream differentiation typically comes from surface area control, dispersibility, and purity, followed by distribution of bulk powder and specialty beads/micro-pearls to tire makers, oral-care formulators, food processors, and electronics supply chains. Regionalization is increasingly visible in production planning. Evonik brought expanded precipitated silica capacity online at Charleston, South Carolina in early 2026 (a 50% site-capacity increase) to support North American tire demand, while circular or mass-balance certification is being incorporated into customer qualification. For example, Evonik and Egesil Kimya achieved ISCC Plus certification for precipitated silica production in Adapazari, Turkey in June 2026.
Competitive Landscape
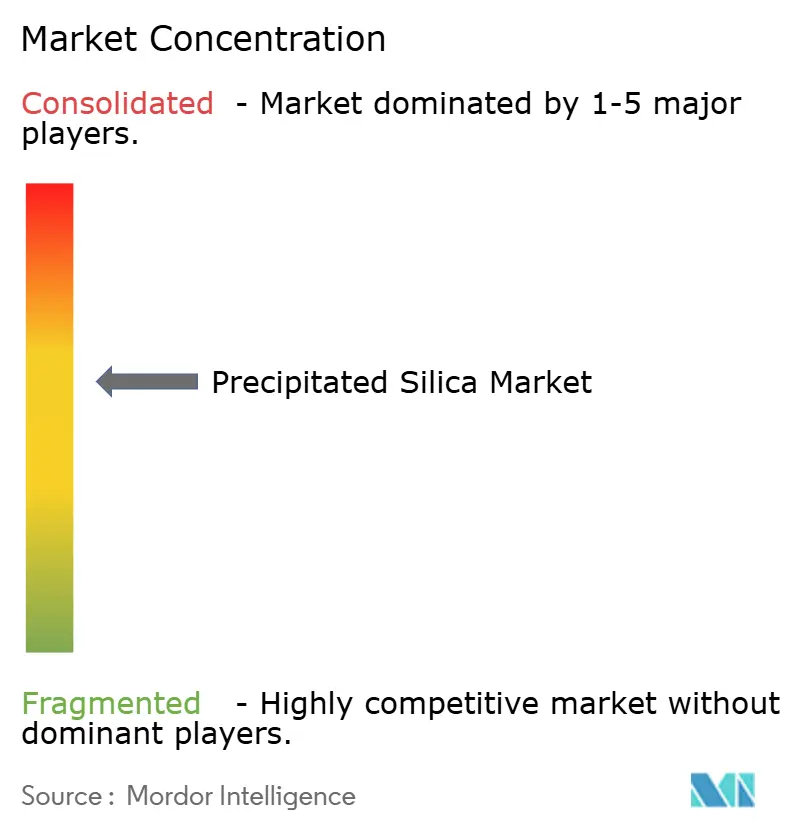
The precipitated silica market is moderately consolidated. Technology differentiation centers on surface modification and process efficiency. Evonik’s Weston, Michigan, plant produces more than 99.5% purity colloidal silica for battery separators, while Solvay’s bio-circular pathway in Livorno harvests rice-husk ash to shave off Scope-3 emissions. Patent filings around organosilane treatments climbed to 47 in 2024, signaling elevated R&D intensity. Chinese producers deploy machine-learning algorithms to trim batch variability below 3%, translating to USD 15–20/t savings and raising competitive bars. Such moves reinforce the dynamic, innovation-oriented profile of the precipitated silica market.
Precipitated Silica Industry Leaders
-
Cabot Corporation
-
Evonik Industries AG
-
Solvay
-
W. R. Grace & Co.
-
Quechen Silicon Chemical
- *Disclaimer: Major Players sorted in no particular order
Precipitated Silica Market Companies Covered in this Report
- Antenchem
- Cabot Corporation
- Denka Company Limited
- Evonik Industries AG
- FUJI SILYSIA CHEMICAL LTD.
- Huber Engineered Materials
- Jinsha Precipitated Silica Manufacturing Co., Ltd.
- Kadvani Chemicals Pvt. Ltd.
- Madhu Silica Pvt. Ltd.
- Oriental Silicas Corporation
- Qemetica
- Quechen Silicon Chemical
- Solvay
- Sunshine Industries
- Tata Chemicals Ltd.
- Tokuyama Corporation
- Tosoh Silica Corporation
- W. R. Grace & Co.
Market Opportunities and Future Outlook
Sustainability-qualified grades create tangible opportunities in tire reinforcement and specialty applications, particularly where buyers require verified circular inputs or lower-footprint materials. In 2026, several large suppliers advanced circular pathways at commercial scale. Solvay inaugurated its first bio-circular silica facility in Livorno, Italy (rice husk ash-derived sodium silicate) and Evonik began commercial production of ULTRASIL eCO after ISCC Plus certification at its Adapazari, Turkey plant. These steps translate into new qualification opportunities for tire manufacturers and compounders seeking certified material solutions rather than conventional sodium-silicate routes.
Local capacity and asset reconfiguration are also shaping where producers can win business in consumption hubs. Evonik expanded precipitated silica capacity at its Charleston, South Carolina site to support local tire demand, and it also announced planned closures in its North American silica network, including Havre de Grace, Maryland, by mid-2026, to optimize the footprint. In parallel, fast-growing end uses that can justify tighter specifications, such as highly dispersible silica for low-rolling-resistance tires, certified circular silica for sustainability targets, and ultra-pure grades for electronics-related applications, offer entry points for producers that can document compliance, maintain supply security, and meet narrow performance windows.
Recent Industry Developments in Precipitated Silica Market
- June 2026: Evonik enabled commercial production of ULTRASIL eCO at its Adapazari, Turkey precipitated silica plant after achieving ISCC Plus certification. The milestone supports mass-balance and circular value chains for customers that need auditable sustainability claims, especially in tire applications where highly dispersible silica is performance-critical.
- January 2026: Solvay inaugurated its first bio-circular silica facility in Livorno, Italy, using rice husk ash-derived bio-based sodium silicate to make highly dispersible silica. The industrial-scale plant strengthens circular feedstock sourcing in Europe and adds a lower-carbon option for tire makers tightening material-sustainability requirements.
- January 2025: Evonik announced plans to close its precipitated silica production facility in Havre de Grace, Maryland by mid-2026 as part of a North American asset network optimization. The decision signals a shift away from legacy capacity toward a more consolidated footprint, influencing regional supply availability and customer requalification timelines.
Precipitated Silica Market Report Scope and Research Methodology
Market Definition and Coverage
For this study, the precipitated silica market covers manufactured, synthetic amorphous silica produced through precipitation, and sold as a functional additive across rubber, tires, oral care, food, agriculture, and other industrial uses.
Scope exclusions: We exclude fumed silica, silica gel, crystalline silica (quartz), and natural silica sand, along with downstream compounded mixes where precipitated silica is not priced as a separate input.
Segments Covered in This Report
- By Grade
- Rubber Grade
- Food Grade
- Dental/Oral-Care Grade
- Feed Grade
- Others (Battery-Separator Grade and Technical/Industrial Grade)
- By Form
- Powder
- Beads
- Micro-pearls
- Granules
- By Production Process
- Wet Process
- Dry Process
- By End-use Industry
- Agriculture
- Oral Care and Cosmetics
- Tire
- Electronics
- Other End-user Industries
- By Geography
- Asia-Pacific
- China
- India
- Japan
- South Korea
- Rest of Asia-Pacific
- North America
- United States
- Canada
- Mexico
- Europe
- Germany
- United Kingdom
- Italy
- France
- Rest of Europe
- South America
- Brazil
- Argentina
- Rest of South America
- Middle-East and Africa
- Saudi Arabia
- South Africa
- Rest of Middle-East and Africa
- Asia-Pacific
Data Sources, Market Sizing, and Validation
Desk Research
Desk work starts by mapping where demand is created and where volume is produced, because precipitated silica is typically discussed through end uses such as tires, technical rubber, and oral care. We used public sources including USGS mineral materials releases, UN Comtrade trade statistics, OECD and World Bank macro indicators, and standards or guidance from ISO and the US FDA for food and oral-care grade context. Patent databases were also reviewed to track process improvements and application shifts that can alter the grade mix over time.
On the supply side, we used company annual reports, investor presentations, and plant announcements to confirm capacity, expansions, and operating footprints, then cross-checked these against trade flows and known regional consumption centers. Paid subscriptions were used selectively for company financials and news screening, along with shipment-level import and export datasets where disclosure was limited. This list is illustrative only, and we also relied on other public and paid sources for data collection, validation, and clarification during analysis.
Primary Interviews and Surveys
Primary checks were run through expert interviews and structured surveys with manufacturers, distributors, compounders, and large end users across tires, rubber goods, toothpaste, and agrochemical formulations. These discussions were used to validate the practical definition of precipitated silica sold into each use case, and to confirm typical grade mix, price ranges, and substitution boundaries by region.
Distribution of primary research fieldwork respondents
| Company type | Respondent position | Region |
|---|---|---|
| Top tier: 26% | CXOs: 13% | APAC: 52% |
| Mid tier: 57% | Functional/Unit leaders: 41% | EMEA: 29% |
| Smaller Players: 17% | Managers: 46% | Americas: 19% |
Market-Sizing & Forecasting
Sizing is built mainly through a top-down demand pool approach, where tire and rubber production indicators, toothpaste and oral-care consumption signals, and agrochemical formulation activity are used to reconstruct likely consumption of precipitated silica by major region. Those demand pools are then translated into market totals using application-level intensity factors and realistic grade splits, before being converted into value using region- and grade-sensitive pricing ranges.
We then corroborate outputs with selective bottom-up approximations, such as capacity and utilization roll-ups by region, supplier shipment direction checks through trade flows, and sampled price-times-volume sanity checks for key applications. The model includes green-tire adoption and low rolling resistance tire trends, tire output and replacement demand, oral-care consumption and toothpaste formulation patterns, crop protection usage intensity for carriers, and energy and feedstock related cost pass-through that influences pricing. Forecasts are developed using scenario analysis, where a base case is anchored to end-market growth expectations and then adjusted with interview inputs on expansion timing, ramp-up rates, and changes in specialty grade penetration. When bottom-up detail is missing for smaller plants, gaps are handled through conservative utilization ranges and regional benchmarking, which are reviewed again in interviews.
Data Validation & Update Cycle
Validation is handled through multiple checks that compare the model against independent signals, such as regional production patterns, trade balances, and known capacity additions coming online. Large variances are flagged for analyst review, and assumptions are re-tested by re-contacting industry participants when a mismatch cannot be explained by grade mix or pricing differences. Before sign-off, we review the full calculation set in steps so the logic from demand indicators to volumes and pricing remains traceable.
Reports are refreshed annually, and interim updates are made when material events occur, such as major plant start-ups, prolonged shutdowns, or sharp shifts in energy and feedstock costs. Right before delivery, a final pass is performed so the latest public releases and news flow are reflected in the numbers and the narrative.
Mordor Intelligence's Precipitated Silica Market Sizing Compared With Other Published Estimates
Published market values for precipitated silica often do not match because each publisher uses different market boundaries, and then applies its own pricing and grade mix assumptions. Differences also show up from the chosen base year, currency timing, and whether the estimate is built as volume first or value first.
Trade flows for synthetic amorphous silica, announced capacity additions, and end-use demand indicators like tire output and oral-care consumption are used as checks to keep Mordor Intelligence anchored to a volume-defined precipitated silica pool, which is then priced by grade and region rather than by a single blended average.
Benchmark comparison
| Source | Market Size | Gaps in Research Methodology |
|---|---|---|
| Mordor Intelligence | USD 3.38 M (2026) | |
| Industry Publisher A | USD 3.92 B (2024) | This estimate appears value-led and can overstate totals if it applies one global average price and broad application buckets that may include downstream formulated products, not just precipitated silica sold as an input. |
| Industry Publisher B | USD 4.27 B (2025) | The figure likely assumes a higher blended price progression and a wider scope across specialty silica adjacencies, which can push the market size up when grade premiums and regional mix are not separately modeled. |
The spread in published numbers is mostly explained by scope boundaries and how pricing is translated from volumes, especially when premium beads and micro-pearls are mixed with standard rubber grades. By keeping the demand pool anchored to end-use consumption signals and then layering realistic grade and regional pricing, the estimate stays easier to replicate and to stress-test when new capacity or trade shifts occur.
Key Questions Answered in the Report
What is the current size of the precipitated silica market?
The precipitated silica market size reached 3.38 million tons in 2026 and is projected to hit 4.08 million tons by 2031.
Which region leads demand for precipitated silica?
Asia-Pacific holds 50.24% of global volume and is forecast to grow at 3.95% CAGR through 2031, driven by EV tire production and rice-husk-ash projects.
How fast is food-grade precipitated silica growing?
Food-grade volume is expanding at a 4.56% CAGR as brands pursue clean-label anti-caking alternatives approved by the FDA and EFSA.
What factor most impacts silica production costs today?
Tight sulfuric-acid supply has lifted variable costs by up to 68% in North America, pressuring wet-process margins.
Who are the top players in precipitated silica?
Evonik, Solvay, Quechen Silicon Chemical, W.R. Grace, and Cabot collectively hold about 47% of global capacity.