
Precious Metal Catalysts Market Size and Share
Market Overview
| Study Period | 2021 - 2031 |
|---|---|
| Market Volume (2026) | 449.12 tons |
| Market Volume (2031) | 467.14 tons |
| Growth Rate (2026 - 2031) | 0.79 % |
| Fastest Growing Market | Asia Pacific |
| Largest Market | Asia Pacific |
| Market Concentration | Medium |
Major Players *Disclaimer: Major Players sorted in no particular order Image © Mordor Intelligence. Reuse requires attribution under CC BY 4.0. | |
Precious Metal Catalysts Market Analysis by Mordor Intelligence
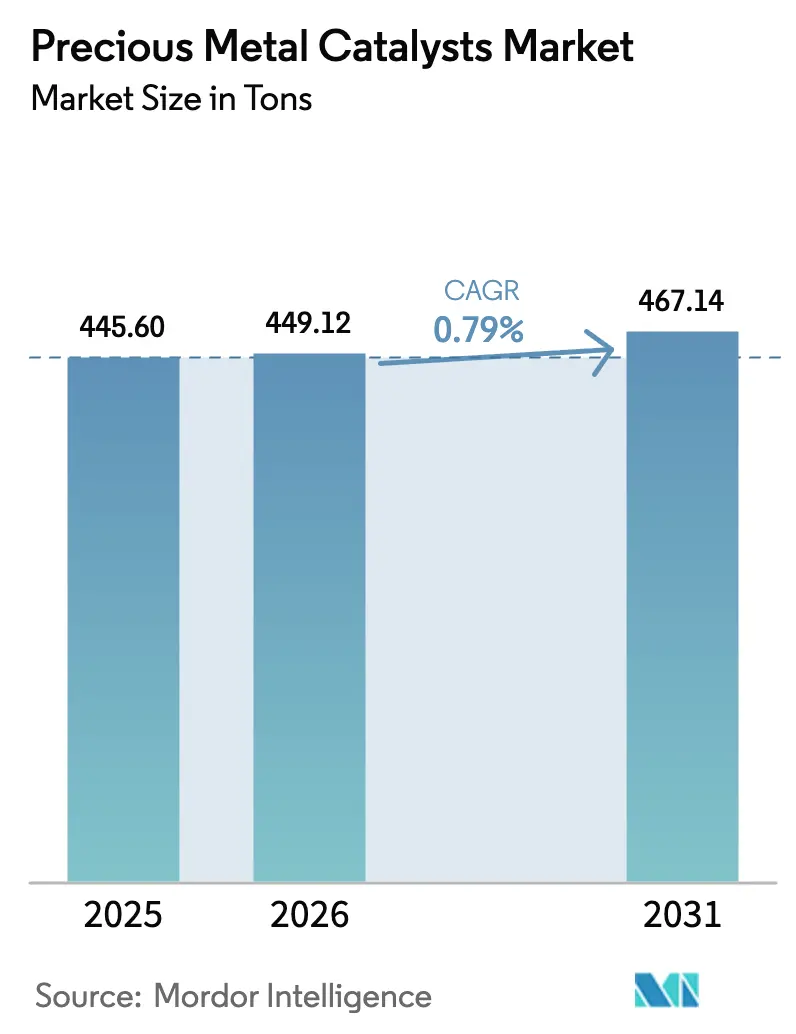
The Precious Metal Catalysts Market size was valued at 445.60 tons in 2025 and is estimated to grow from 449.12 tons in 2026 to reach 467.14 tons by 2031, at a CAGR of 0.79% during the forecast period (2026-2031). Modest headline growth co-exists with pronounced shifts in demand mix, most notably the gradual erosion of autocatalyst volumes, the rapid scale-up of green-hydrogen electrolyzers, and rising precision requirements in pharmaceutical synthesis. Intensifying Euro 7, China VI-b, and Bharat Stage VII regulations are lifting per-vehicle platinum-group-metal (PGM) loadings even as battery-electric vehicles (BEVs) temper unit shipments. Simultaneously, PEM electrolyzer build-outs are pulling iridium and platinum into double-digit expansion corridors, encouraging suppliers to widen recycling loops and deploy AI-assisted formulation platforms. Strategic hedges—platinum substitution for palladium, angstrom-level atomic-layer deposition (ALD), and digital-twin process optimization—are defending margins against volatile PGM spot prices. Portfolio rebalancing toward fuel-cell, refinery, and pharmaceutical catalysts is becoming a central competitive lever as incumbents confront a bifurcated growth landscape.
Key Report Takeaways
- By metal type, platinum commanded 40.92% of the precious metal catalysts market share in 2025, while iridium is advancing at a 3.01% CAGR through 2031.
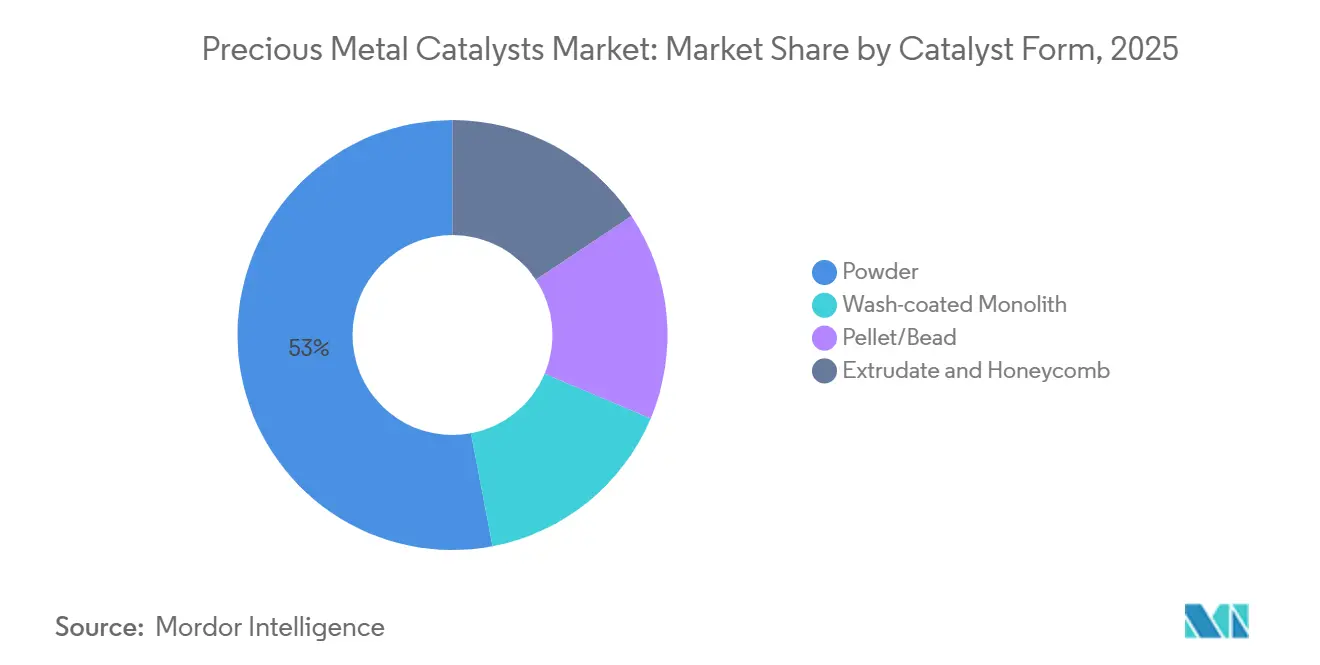
- By catalyst form, powder variants accounted for 52.98% of the precious metal catalysts market in 2025, while wash-coated monoliths are anticipated to grow with a 1.66% CAGR through 2031.
- By manufacturing process, incipient-wetness impregnation held 47.18% share of the precious metal catalysts market size in 2025; chemical vapour/atomic layer deposition is recording the highest projected CAGR at a 2.93% CAGR through 2031.
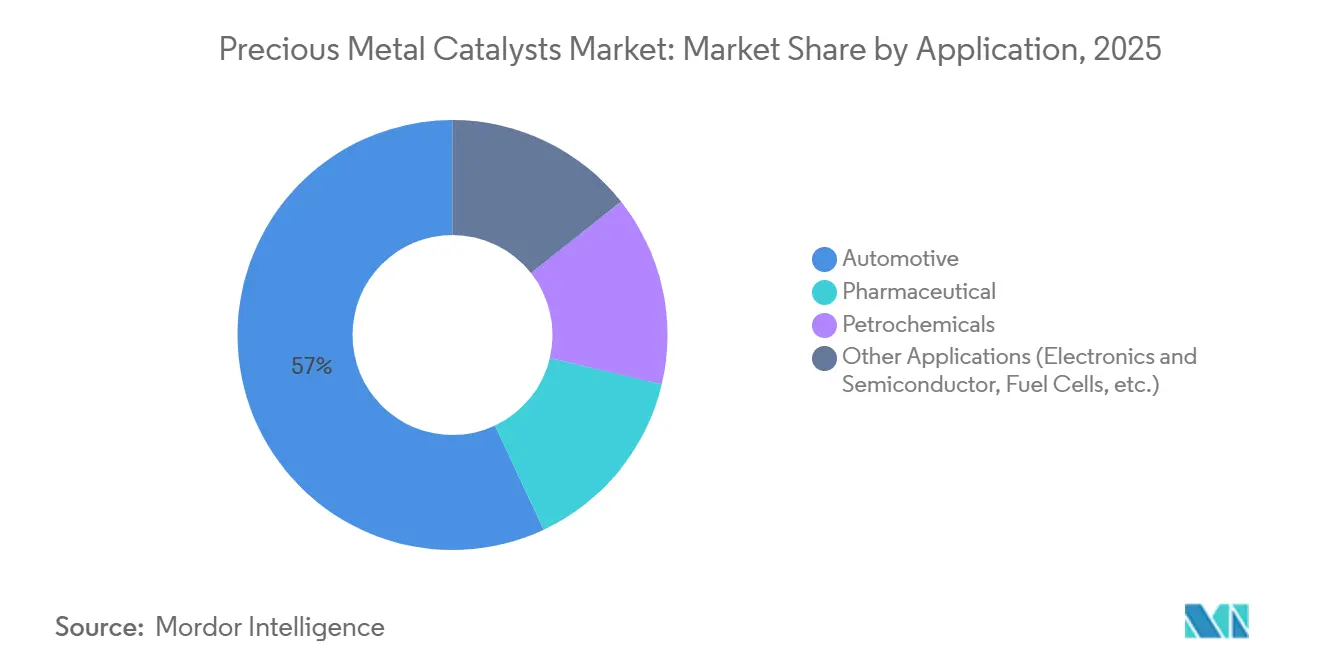
- By application, automotive maintained a 56.98% revenue share in 2025; the other applications segment, including fuel cells, electronics, and green hydrogen, is forecast to expand at a 2.78% CAGR to 2031.
- By geography, Asia-Pacific accounted for 39.82% of the precious metal catalysts market size in 2025 and is projected to grow at a 1.22% CAGR between 2026-2031.
Note: Market size and forecast figures in this report are generated using Mordor Intelligence’s proprietary estimation framework, updated with the latest available data and insights as of January 2026.
Global Precious Metal Catalysts Market Trends and Insights
Drivers Impact Analysis*
| Drivers | (~)% Impact on CAGR Forecast | Geographic Relevance | Impact Timeline |
|---|---|---|---|
| Stricter tail-pipe and stationary-emission standards | +0.3% | Global, with peak enforcement in EU, China, and India | Medium term (2-4 years) |
| Petro-refinery shift to higher-octane clean fuels | +0.2% | North America, Middle East, APAC refining hubs | Long term (≥ 4 years) |
| Platinum substitution for palladium in tri-metal autocatalysts | +0.1% | Europe, North America | Short term (≤ 2 years) |
| Green-hydrogen build-out spurring Ir/Pt catalyst demand | +0.4% | Europe, Japan, South Korea, early APAC adopters | Long term (≥ 4 years) |
| AI-designed reaction pathways trimming PGM loadings | +0.3% | Global, with peak enforcement in EU, North America and the Asia-Pacific | Long term (≥ 4 years) |
| Source: Mordor Intelligence | |||
Stricter Tail-Pipe and Stationary-Emission Standards
The European Commission finalized Euro 7 in late 2025 for 2027 implementation, forcing OEMs to raise rhodium and palladium loadings by 15-20% per vehicle. China’s National VI-b, effective July 2024, triggered a 12% increase in PGM catalyst demand among domestic automakers in 2025. India’s Bharat Stage VII (April 2028) will extend real-driving-emission caps to two-wheelers, creating a fresh addressable segment. U.S. EPA Tier 4 Final standards are simultaneously boosting platinum-based oxidation catalysts for non-road diesel engines. The net result is a value-accretive mix enrichment that partially offsets stagnant ICE volumes.
Petro-Refinery Shift to Higher-Octane Clean Fuels
International Maritime Organization sulfur caps and regional low-sulfur gasoline mandates are driving refinery upgrades that favor platinum-on-alumina catalysts for hydroprocessing[1]. Saudi Aramco’s Jazan refinery, commissioned in 2024, deployed more than 200 tons of precious-metal catalysts across its hydrocracking trains. Reliance Industries earmarked USD 1.2 billion in 2025 for BS-VII compliance at Jamnagar, anchoring incremental demand for platinum-rhenium catalysts. These investments underpin a parallel growth avenue that balances BEV-driven autocatalyst attrition.
Platinum Substitution for Palladium in Tri-Metal Autocatalysts
With palladium averaging USD 2,100/oz versus platinum at USD 950/oz in 2025, OEMs reformulated three-way catalysts, lifting platinum content from roughly 15% to near 30% of PGM mass. Stellantis raised platinum share to 28% of its Euro 6d catalyst systems, trimming palladium usage by 600 kg annually across European plants. Advances in washcoat chemistry mitigate platinum’s historical light-off limitations, stabilizing aggregate PGM demand even as palladium volumes soften.
Green-Hydrogen Build-Out Spurring Ir/Pt Catalyst Demand
Germany’s H2Global allocated EUR 4.5 billion in 2025, catalyzing orders for 2 GW of PEM electrolyzers that will require 18-22 tons of iridium by 2027. Japan’s 2026 hydrogen roadmap funnels JPY 300 billion into electrolyzer manufacturing, prioritizing iridium recycling to ease supply bottlenecks. PEM cathodes also absorb platinum, while ruthenium-platinum alloys are gaining share for enhanced corrosion resistance.
Restraints Impact Analysis*
| Restraints | (~)% Impact on CAGR Forecast | Geographic Relevance | Impact Timeline |
|---|---|---|---|
| Persistent PGM price volatility and supply shocks | -0.2% | Global, acute in APAC and Europe reliant on South African/Russian supply | Short term (≤ 2 years) |
| EV penetration shrinking ICE autocatalyst demand | -0.3% | China, Europe, North America | Medium term (2-4 years) |
| Rising recycling rates denting primary demand | -0.1% | Global, concentrated in regions with mature collection infrastructure | Long term (≥ 4 years) |
| Source: Mordor Intelligence | |||
Persistent PGM Price Volatility and Supply Shocks
Rhodium vacillated between USD 9,200 and USD 14,000/oz in 2025 after South African mine outages cut supply by 18%[2]. Russian palladium exports fell 40 tons under sanctions, forcing European formulators to buy higher-priced recycled metal. Iridium jumped 35% on electrolyzer orders, deferring several PEM projects. Tier 2 suppliers without integrated recycling absorbed a 400-600 bp margin compression under fixed-price contracts.
EV Penetration Shrinking ICE Autocatalyst Demand
China’s BEV share hit 38% of 2025 passenger-car sales, removing roughly 12,000 autocatalyst replacement cycles in Beijing and Shanghai ride-hailing fleets. Europe reached 22% BEV penetration in 2025 as targeted subsidies continued. The U.S. IRA tax credit doubled BEV share to 11%, prompting catalyst firms to accelerate diversification into fuel-cell and pharmaceutical segments.
*Our forecasts treat driver/restraint impacts as directional, not additive. The impact forecasts reflect baseline growth, mix effects, and variable interactions.
Segment Analysis
By Metal Type: Iridium Scales Fastest Despite Platinum Dominance
Platinum retained a 40.92% share in 2025, anchored by its versatility across autocatalyst, refinery, and pharmaceutical platforms. Iridium, though small in absolute terms, is expanding at a 3.01% CAGR on the back of PEM electrolyzer deployment. Ruthenium is carving a niche in chlor-alkali and ammonia catalysts for process-economic gains. AI-optimized nanoparticles are halving iridium intensity in 1-MW electrolyzers, reinforcing a value-over-volume trajectory.
Atomic-layer deposition is crucial here: Johnson Matthey demonstrated 50% higher oxygen-evolution rates with iridium dots on titanium oxide, cutting metal intensity per MW in half. For platinum, narrowing discounts to palladium are opening price headroom that sustains formulation experimentation.
By Catalyst Form: Powder Leads, Monoliths Gain on Integration Efficiencies
Powder catalysts accounted for 52.98% of 2025 demand, dominating pharmaceutical batch reactors and refinery fixed beds thanks to easy regeneration. Wash-coated monoliths are growing at a 1.66% CAGR, as automotive and stationary emission systems prize low pressure drop. Umicore’s 2025 rhodium-free monolith meets Euro VI limits with 30% less total PGM. Pellet forms target hydrogenation reactors where mechanical strength offsets costs. Integration efficiencies place monoliths at the forefront of emission-control research and development, while powders retain primacy where batch flexibility prevails.

By Manufacturing Process: ALD Scales as Precision Demands Rise
Incipient-wetness impregnation held a 47.18% share in 2025 owing to its low cost and scalability for automotive catalysts. Chemical vapour or atomic layer deposition (ALD) is advancing at a 2.93% CAGR as fuel-cell and fine-chemical producers demand sub-nanometer precision. Heraeus’ new ALD line delivers platinum mass activity 40% above impregnation benchmarks. Impregnation remains optimal for refinery catalysts where 0.3-0.5 wt% platinum loadings suffice. Electrochemical deposition is making headway in electrolyzers, producing iridium coats with superior adhesion.
By Application: Automotive Holds Majority, Fuel Cells Emerge
Automotive catalysts still held a 56.98% share in 2025, yet BEV substitution trims absolute volume even as per-vehicle PGM intensity rises. Pharmaceutical catalysts enable over 60% of global generic hydrogenations. Petrochemical catalysts underpin gasoline and aromatics production, especially in Middle Eastern and Asian refineries. Fuel cells and electrolyzers sit in the “other applications” bucket and are growing with the fastest CAGR of 2.78%. Iridium and platinum tonnage are on a steep up-curve as regional hydrogen roadmaps solidify. Toyota’s plan to triple Mirai output implies an extra 1.2 tons of platinum cathode demand by 2027.
Geography Analysis
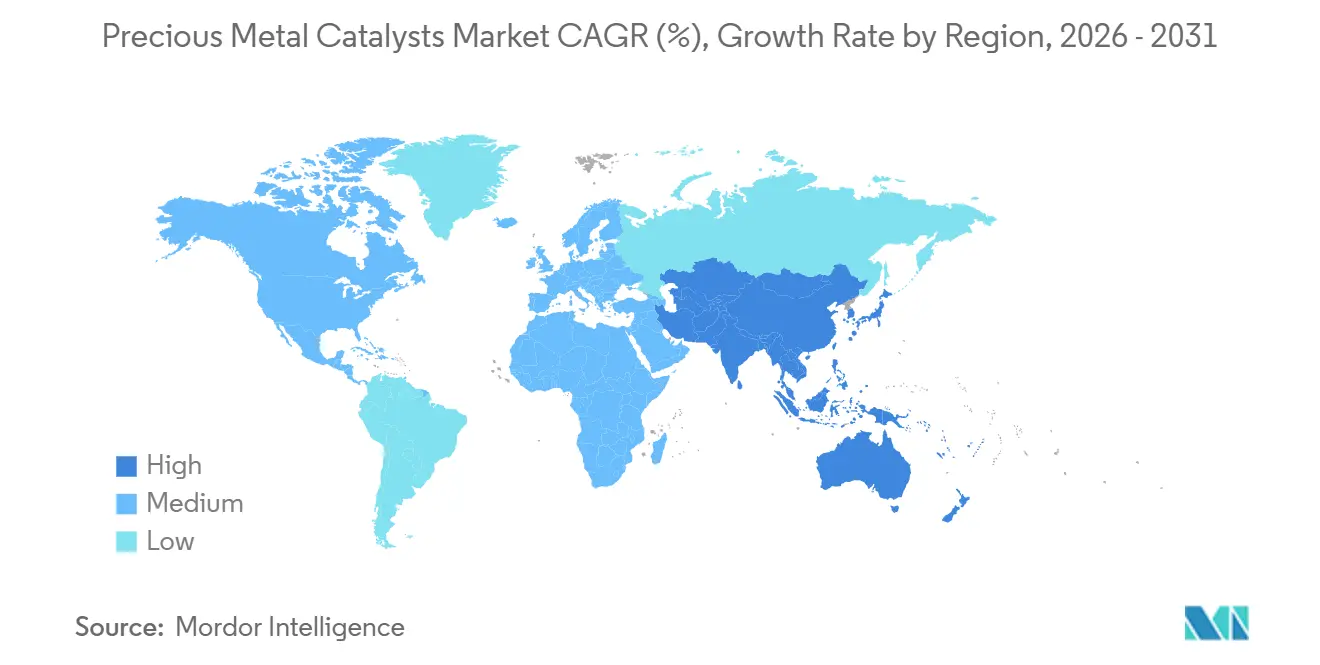
Asia-Pacific controlled 39.82% of the 2025 volume and is set to grow at a 1.22% CAGR despite China’s NEV policy headwinds. China’s National VI-b raised PGM loadings per ICE by 14% in 2025, cushioning catalyst volume decline. Japan’s JPY 300 billion electrolyzer subsidy is pivoting the supply chain toward iridium recycling, with TANAKA tripling PEM catalyst capacity. India’s Bharat Stage VII will boost two-wheeler catalyst penetration from below 40% today, adding significant upside. South Korea’s 12,000 NEXO deliveries in 2025 kept platinum cathode volumes buoyant.
North America remains value-dense: U.S. refiners installed 8 tons of platinum catalysts to meet Tier 3 sulfur requirements in 2025. Europe’s EUR 3 billion electrolyzer funding is funneling iridium demand into Germany, Spain, and the Netherlands. South America leans on Brazil’s ethanol blend mandate, driving platinum-rhenium reforming catalyst purchases. The Middle East benefits from new hydrocracking trains at Jazan, while South Africa leverages domestic PGM mining for competitive recycling logistics.
Regulatory Landscape
Compliance requirements for precious metal catalysts are shaped by emissions rules and chemicals regulation, with Europe acting as a key anchor market for both. On the emissions side, the late-2025 finalization of Euro 7 for 2027 implementation, alongside China VI-b effective July 2024 and Bharat Stage VII in April 2028, is tightening tailpipe limits and reinforcing demand for higher-performance PGM catalyst formulations in mobile and certain stationary applications.
On the chemicals and circularity side, EU REACH obligations continue to affect registration, data requirements, and downstream communication for catalyst producers and importers. The European Critical Raw Materials Act (Regulation (EU) 2024/1252) also adds a supply-security lens with 2030 benchmarks that include 25% recycling of strategic raw materials. In May 2026, Commission Implementing Regulation (EU) 2026/1116 clarified product, component, and waste streams with critical raw material recovery potential, and in July 2026 ECHA updated REACH Annex XVII with nano-specific toxicology requirements for engineered-nanoparticle-containing specialty chemicals exported to the EU, effective October 1, 2026. This raises compliance needs for nano-enabled catalyst systems and strengthens the case for qualified testing and documentation.
Value Chain Analysis
The value chain starts with primary PGM supply (mining, refining, and separation of platinum, palladium, rhodium, ruthenium, and iridium), then moves through metal trading and inventory management, followed by catalyst manufacturing (precursor preparation, impregnation or deposition, coating on ceramic or metal substrates, extrusion or honeycomb forming, activation, and quality control). Downstream, catalysts are integrated by OEMs and system integrators into automotive exhaust aftertreatment, refinery and petrochemical units, pharmaceutical synthesis, and emerging hydrogen and fuel-cell components, where performance certification and lifetime testing increasingly factor into customer qualification.
End-of-life recovery is built into the system rather than treated as a terminal step: spent catalysts are collected, decanned where relevant, and refined back into reusable metal salts or sponge, supporting closed-loop supply. Integrated players such as Umicore, Heraeus, and Johnson Matthey cover trading, manufacturing, and recycling, which helps reduce customer exposure to PGM price volatility and secure inputs such as iridium for PEM electrolyzers. When supply tightness emerges, it can cascade into procurement delays and production scheduling constraints, while technology shifts such as higher-precision deposition (for fuel cells, fine chemicals, and electrolyzers) and greater use of recycled feedstock aim to stabilize availability and meet sustainability requirements.
Competitive Landscape
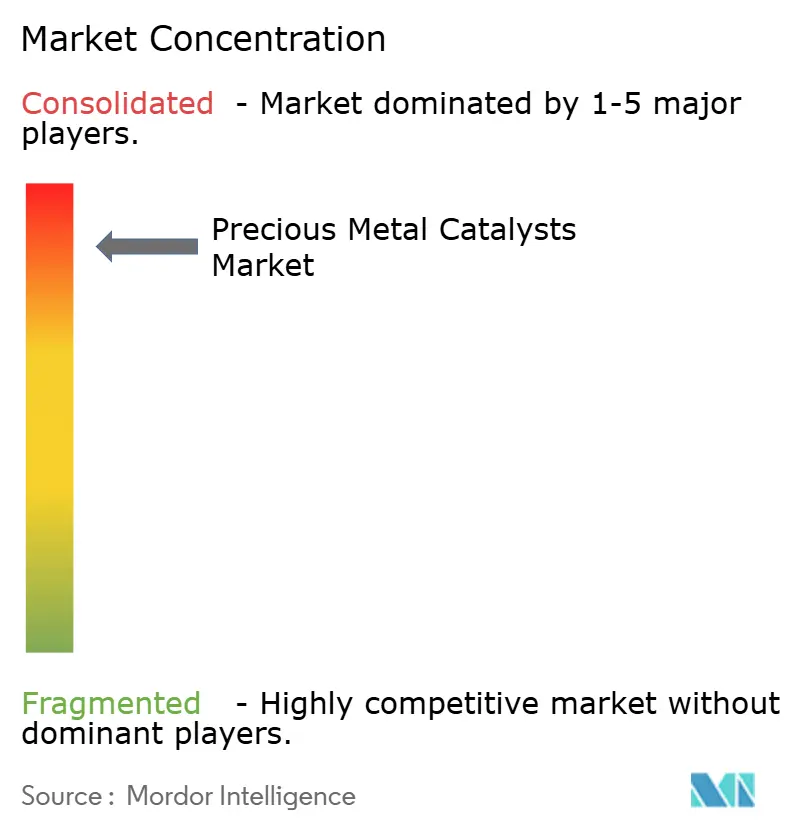
The precious metal catalysts market demonstrates moderate consolidation. Closed-loop recycling has become a critical differentiator. For example, Umicore sources 52% of its feedstock from secondary PGM recovery, achieving an 18% reduction in Scope 3 emissions. Patent filings for AI-designed catalysts have increased by 40% year-on-year, with leading players such as BASF and Clariant leveraging machine learning to optimize bimetallic synergies. Chinese competitors Kaili Catalyst and Shaanxi Kaida have achieved 22% growth by capitalizing on their proximity to OEMs under the China VI-b regulations. Tier 1 companies are allocating USD 50-100 million annually to ALD and AI technologies to maintain profitability in high-value segments like fuel cells and pharmaceuticals. Meanwhile, Tier 2 companies are concentrating on incremental improvements in impregnation efficiency. Additionally, white-space opportunities are emerging in iridium recycling for PEM membranes and ruthenium catalysts for chlor-alkali cells.
Precious Metal Catalysts Industry Leaders
-
BASF
-
Honeywell International, Inc.
-
Umicore
-
Heraeus Precious Metals
-
Clariant
- *Disclaimer: Major Players sorted in no particular order
Market Opportunities and Future Outlook
Recycling-led supply security and compliance-driven circularity remain central whitespace, particularly for iridium and other scarce PGMs used in PEM electrolyzers. Policy anchors such as the EU Critical Raw Materials Act (Regulation (EU) 2024/1252), together with its May 2026 implementing regulation that clarifies recovery-relevant waste streams, increases the incentive to build closed-loop networks for spent catalysts and process residues. This tends to favor companies that can bundle metal management, refining, and catalyst supply.
Technology-led metal-thrifting also opens room for product differentiation. Fraunhofer IAP reported in January 2026 that it developed iridium-reduced catalysts for PEM electrolysis that maintain performance at 7 mg of iridium per 25 square centimeters. In March 2026, Johnson Matthey commenced early-stage commissioning of a new PGM refinery in the UK, supporting local availability of refined metals and recycled content for catalyst manufacture. Beyond mobile emissions, stationary emissions control linked to expanding data center infrastructure provides an additional demand pocket for oxidation and related catalyst systems, broadening the addressable market beyond traditional ICE autocatalysts.
Recent Industry Developments
- May 2026: Heraeus Precious Metals signed an MoU with VSParticle to develop low-iridium porous transport electrodes for PEM water electrolysis using spark ablation technology. The collaboration targets catalyst-layer designs that cut iridium usage while keeping performance, directly addressing a key material constraint in PEM electrolyzer scale-up.
- November 2025: BASF Environmental Catalyst and Metal Solutions opened a new production facility in Budenheim, Germany for green hydrogen and fuel cell components, including gigawatt-scale production of low-PGM-loaded catalyst coated membranes. The site expansion strengthens regional manufacturing capacity for hydrogen value-chain components and supports faster industrial qualification cycles for next-generation precious metal catalyst systems.
- January 2024: BASF ECMS and Heraeus Precious Metals commenced operations of the BASF HERAEUS Metal Resource Co., Ltd. joint venture recycling facility in Pinghu, China, designed to recycle 10,000 tons of automotive catalysts annually. The start-up expanded secondary PGM supply in Asia and improved resilience against primary metal supply disruptions and price volatility.
Research Methodology Framework and Report Scope
Market Definition and Coverage
This market covers catalysts where a precious metal is the active catalytic component, and it is counted when the material is supplied for use in industrial and automotive chemical reactions.
Scope exclusions: We exclude mining, primary metal refining, and pure precious metal trading that is not sold as a catalyst material.
Segmentation Overview
- By Metal Type
- Platinum
- Palladium
- Rhodium
- Iridium
- Ruthenium
- Other Metal Types (Osmium, Gold, Silver)
- By Catalyst Form
- Powder
- Pellet / Bead
- Extrudate and Honeycomb
- Wash-coated Monolith
- By Manufacturing Process
- Incipient Wetness Impregnation
- Electroless and Electrochemical Deposition
- Chemical Vapour / Atomic Layer Deposition
- Sol-Gel / Precipitation
- Other Advanced Nano-structuring
- By Application
- Automotive
- Pharmaceutical
- Petrochemicals
- Other Applications (Electronics and Semiconductor, Fuel Cells, etc.)
- By Geography
- Asia-Pacific
- China
- Japan
- India
- South Korea
- ASEAN Countries
- Rest of Asia-Pacific
- North America
- United States
- Canada
- Mexico
- Europe
- Germany
- United Kingdom
- France
- Italy
- Rest of Europe
- South America
- Brazil
- Argentina
- Rest of South America
- Middle East and Africa
- Saudi Arabia
- South Africa
- Rest of Middle-East and Africa
- Asia-Pacific
Data Sources, Market Sizing, and Validation
Desk Research
Desk work started by mapping where precious metal catalysts are used, then linking those uses to measurable production and trade signals. Public sources such as the USGS, UN Comtrade, Eurostat, and national statistical agencies helped us understand metal availability, trade flows, and broad industrial output trends. We also used emissions and automotive outlook releases from agencies such as the International Energy Agency and the US EPA to frame demand direction where catalyst use is regulation-led.
To ground the model in company context, we reviewed annual reports, investor presentations, and technical product literature that describe catalyst forms and typical end uses. Where needed, we used paid subscriptions for company financials and intelligence, patent databases, and shipment-level trade datasets to cross-check product mix and validate import-export patterns. These examples are not exhaustive, and other public sources were also used during data collection, validation, and research clarification.
Primary Interviews and Surveys
Primary inputs were gathered through expert interviews and structured surveys across catalyst producers, distributors, recyclers, and downstream users serving automotive, petrochemicals, and pharmaceuticals. We covered APAC, EMEA, and the Americas, so assumptions such as metal loadings, recycling intensity, and demand pacing could be tested and revised when desk indicators did not fully explain market movement.
Distribution of primary research fieldwork respondents
| Company type | Respondent position | Region |
|---|---|---|
| Top tier: 26% | CXOs: 15% | APAC: 43% |
| Mid tier: 54% | Functional/Unit leaders: 26% | EMEA: 33% |
| Smaller Players: 20% | Managers: 59% | Americas: 24% |
Market-Sizing & Forecasting
Market sizing is built using a top-down approach where production and trade data reconstruct the demand pool for precious metal catalyst materials, and then we align that to end-use activity. Inputs that matter here include automotive production and emissions control intensity, refinery and petrochemical throughput, pharmaceutical intermediate output trends, and reported shifts in precious metal pricing that can change substitution behavior. Since catalyst performance also depends on metal selection, we track the balance between platinum, palladium, rhodium, and other precious metals to avoid overstating volume when value changes are mainly price-led.
Results are corroborated with selective bottom-up approximations, such as sampled supplier revenue-to-volume checks, channel discussions on average metal loading per application, and cross-checks against recycling availability that can constrain fresh catalyst demand. If a country has limited direct data, we fill gaps using proxy indicators like industrial output indices and trade partner flows, then re-test those proxies in interviews before finalizing totals. Forecasting uses scenario analysis supported by expert expectations on regulation timing, vehicle mix (ICE, hybrid), and capacity utilization in refining and chemicals, which are translated into volume outlook by year.
Data Validation & Update Cycle
Outputs are validated through multiple checks that compare model totals against independent signals such as metal supply availability, trade movement, and end-use production trends, before final sign-off. Variance is reviewed at country and application level, and when an outlier appears, we revisit the underlying assumption and re-contact relevant respondents to understand what changed. A second analyst review is completed to confirm that units, conversions, and time-series logic are consistent across regions.
The report is refreshed annually, and interim updates are triggered when material events occur, such as sharp precious metal price swings or major regulatory announcements that can shift catalyst demand quickly. Before delivery, a final pass is performed so the latest public releases and validated industry inputs are reflected in the published view.
Mordor Intelligence's Precious Metal Catalysts Market Size Measured Against Other Published Estimates
Different published market sizes for precious metal catalysts can look far apart, even when the end uses are similar, because counting rules are not always aligned. The biggest drivers are whether the estimate is built in USD value or physical volume, how recycling and metal price effects are treated, and how often the model is refreshed.
The main gap comes from the unit and scope choice, where Mordor Intelligence sizes this market in tons of catalyst material and keeps totals tied to metal loading and end-use throughput rather than pricing swings, which can inflate USD-based views in high-price years.
Benchmark comparison
| Source | Market Size | Gaps in Research Methodology |
|---|---|---|
| Mordor Intelligence | USD 449.12 M (2026) | |
| Global Consultancy A | USD 21.56 B (2025) | This figure is reported in USD value, so precious metal price cycles can materially change the total even if catalyst volume is steady, and the scope likely blends catalyst material with broader value components across end uses. |
| Industry Publisher B | USD 14.89 B (2025) | This estimate appears value-led with a long forecast window, which can embed stronger price and demand assumptions, and the published scope notes are lighter on how recycling offsets and metal loading changes are handled. |
The spread in published numbers mainly reflects whether the market is counted as a physical catalyst demand pool or as a revenue pool that moves with commodity pricing. By keeping the model traceable to end-use activity, metal mix, and realistic loading assumptions, we can explain year-to-year movement in simple steps that can be rechecked when conditions change.
Key Questions Answered in the Report
What is the current size of the precious metal catalysts market in 2026?
The market is estimated at 449.12 tons in 2026, with a 0.79% CAGR projected to 2031.
Which metal type holds the largest share in the precious metal catalysts space?
Platinum maintains leadership with 40.92% of 2025 volume.
How fast is iridium demand growing?
Iridium demand is advancing at a 3.01% CAGR, driven by PEM electrolyzer deployments.
Why are monolith catalysts gaining traction?
Wash-coated monoliths cut pressure drop and noble-metal inventory, growing at a 1.66% CAGR.
How significant is the Asia-Pacific region in global demand?
Asia-Pacific accounted for 39.82% of the 2025 volume and is the fastest-growing region at a 1.22% CAGR.
What strategic move are suppliers using to mitigate PGM price swings?
Expanded closed-loop recycling now supplies over half of Umicore’s feedstock, insulating margins.