
Power Strip Market Size and Share
Market Overview
| Study Period | 2020 - 2031 |
|---|---|
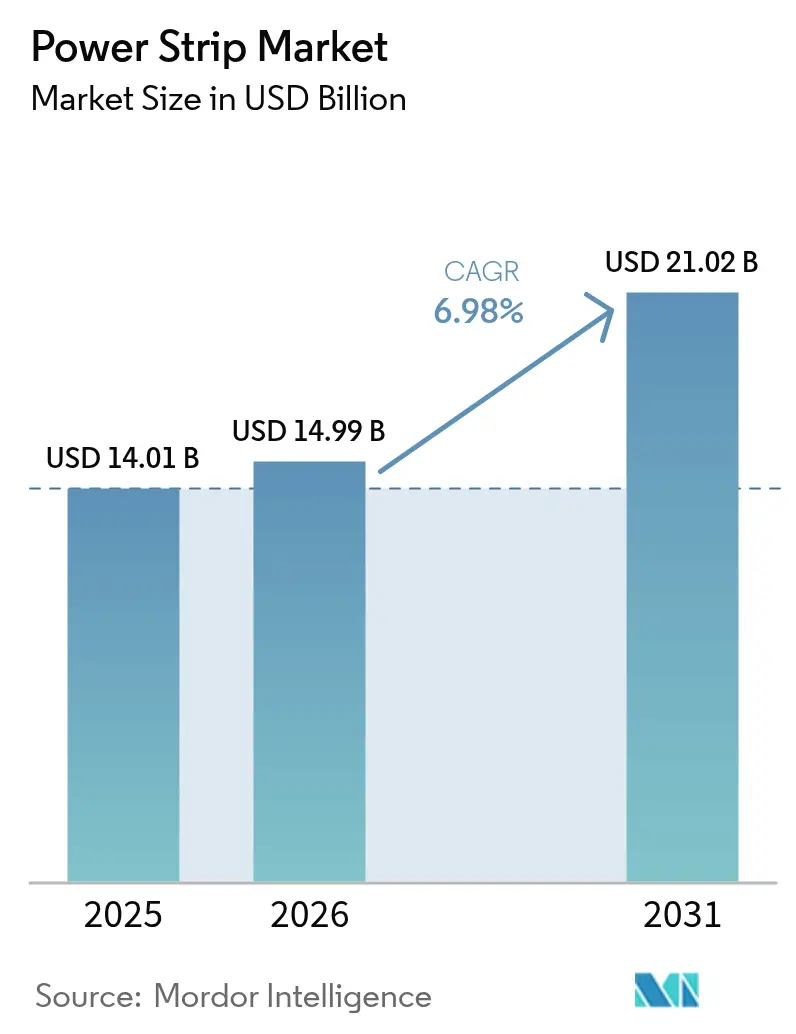
| Market Size (2026) | USD 14.99 Billion |
| Market Size (2031) | USD 21.02 Billion |
| Growth Rate (2026 - 2031) | 6.98 % |
| Fastest Growing Market | Asia Pacific |
| Largest Market | Asia Pacific |
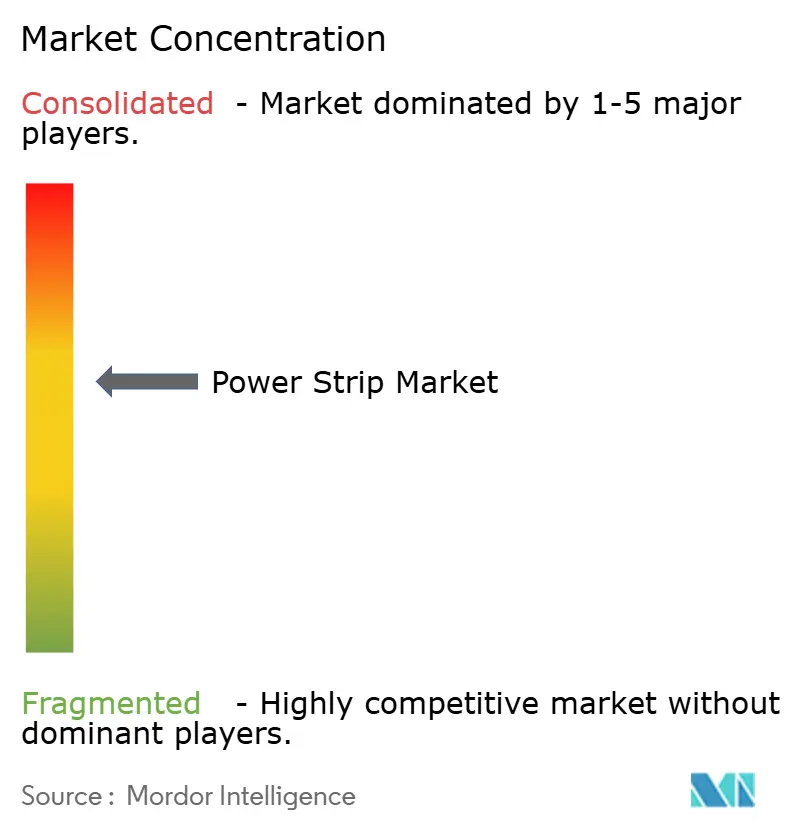
| Market Concentration | Medium |
Major Players *Disclaimer: Major Players sorted in no particular order Image © Mordor Intelligence. Reuse requires attribution under CC BY 4.0. | |
Power Strip Market Analysis by Mordor Intelligence
The power strip market size is expected to grow from USD 14.01 billion in 2025 to USD 14.99 billion in 2026 and is forecast to reach USD 21.02 billion by 2031 at 6.98% CAGR over 2026-2031. Growth is propelled by the convergence of data-center electrification, smart-home mandates, and industrial IoT roll-outs that collectively increase outlet density requirements and elevate functionality expectations. Operators of hyperscale data halls are demanding intelligent rack-mount power distribution units (PDUs) with outlet-level metering, while residential buyers seek WiFi-enabled models that can shed standby loads automatically. Rising automation across manufacturing lines, combined with government efficiency incentives, is widening the customer base and nudging average selling prices upward. Competition remains moderate as safety certification costs curb new-entrant expansion, yet profitability is supported by premium pricing for compliant, feature-rich SKUs.
Key Report Takeaways
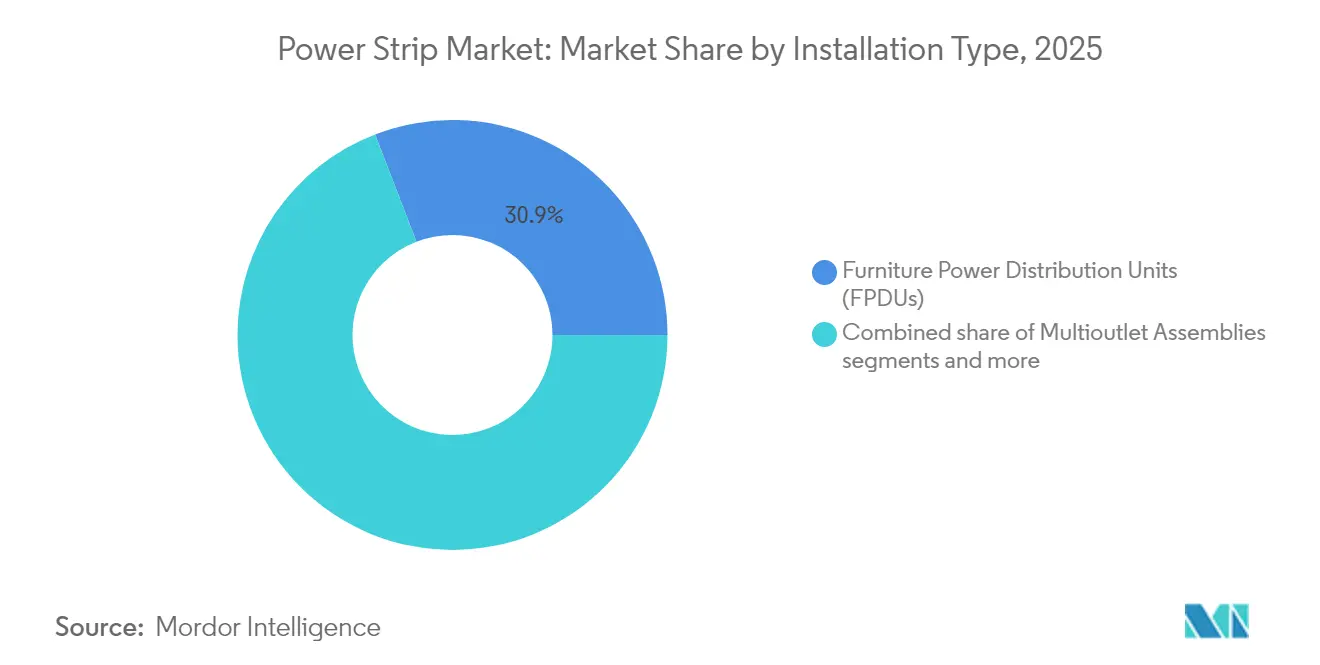
- By installation type, Furniture Power Distribution Units (FPDUs) led with 30.86% of power strip market share in 2025; Smart WiFi/Bluetooth models are projected to expand at a 7.45% CAGR through 2031.
- By protection feature, surge-protected units captured 37.05% revenue share of the power strip market in 2025, while energy-monitoring variants are advancing at an 7.78% CAGR to 2031.
- By application, general-purpose products accounted for 50.42% of the power strip market in 2025; smart applications post the fastest trajectory at 7.96% CAGR.
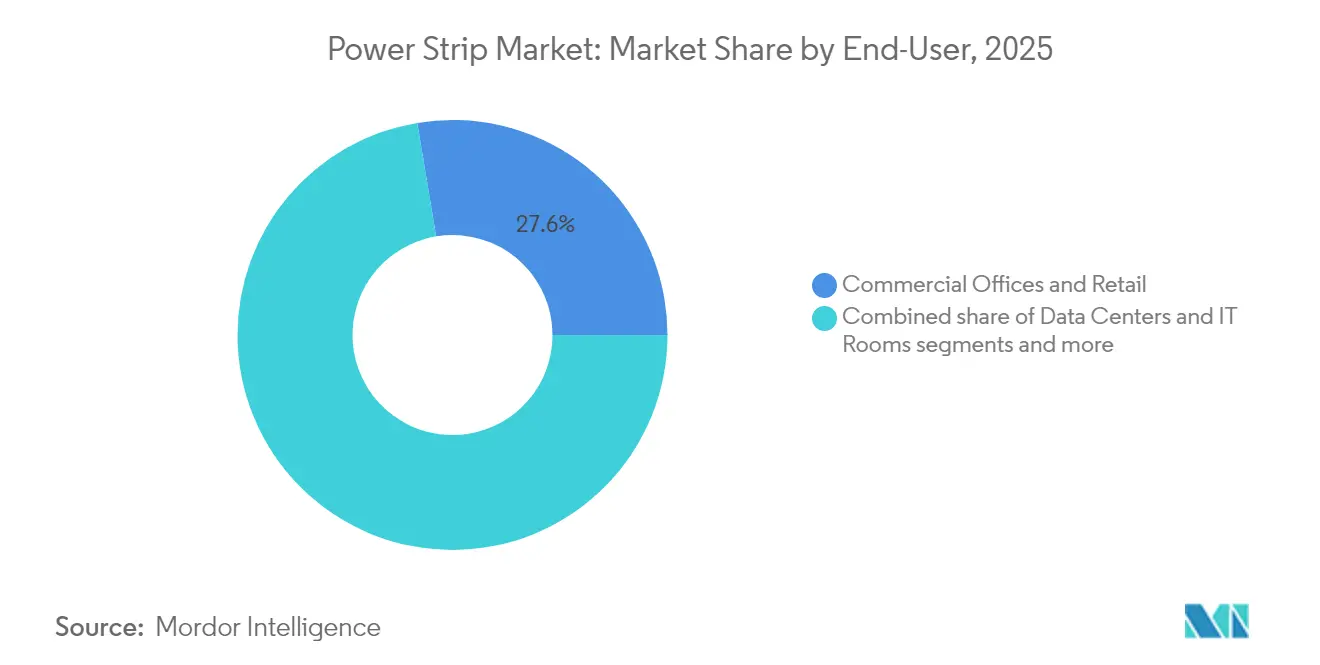
- By end user, commercial offices and retail spaces held 27.62% of the power strip market share in 2025, whereas the residential category is poised for a 7.46% CAGR to 2031.
- By distribution channel, offline outlets dominated with 66.85% revenue share in 2025; online platforms exhibit an 8.35% CAGR outlook to 2031.
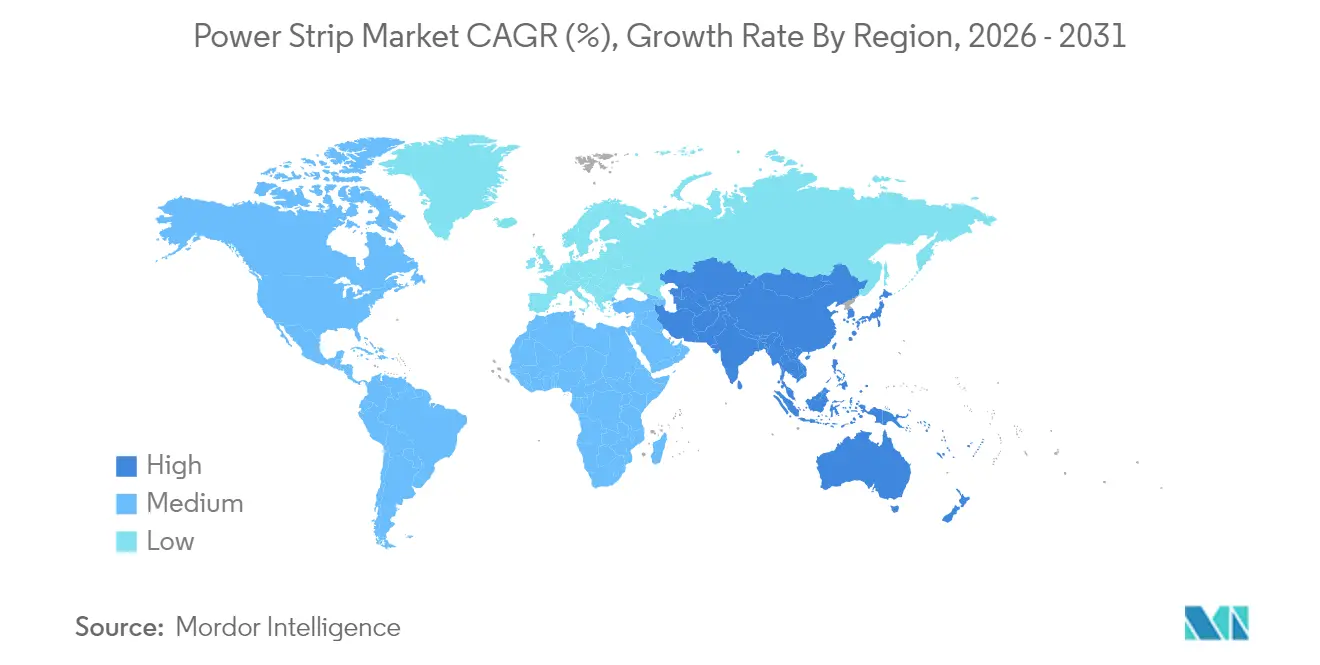
- By geography, Asia-Pacific commanded 45.05% revenue in 2025 and is on track for a 7.55% CAGR, driven by data-center buildouts and smart-city deployments.
Note: Market size and forecast figures in this report are generated using Mordor Intelligence’s proprietary estimation framework, updated with the latest available data and insights as of 2026.
Market Trends and Insights
Drivers Impact Analysis of Power Strip Market*
| Driver | (~) % Impact on CAGR Forecast | Geographic Relevance | Impact Timeline |
|---|---|---|---|
| Proliferation of electronic devices in households | +1.2% | Global – North America and APAC hot spots | Medium term (2-4 years) |
| Demand for energy-efficient smart-home power management | +1.0% | North America and EU lead, APAC follows | Medium term (2-4 years) |
| Data-center and IT-infrastructure expansion | +1.8% | Global – APAC and North America pivotal | Short term (≤ 2 years) |
| Surge in remote working worldwide | +0.9% | Global – higher in developed economies | Short term (≤ 2 years) |
| Utility rebates and building-code mandates for APS | +0.7% | North America and EU | Long term (≥ 4 years) |
| Industrial-IoT-driven networked PDU adoption | +0.8% | Core in APAC, expanding to MEA | Medium term (2-4 years) |
| Source: Mordor Intelligence | |||
Proliferation of Electronic Devices in Households
Average connected-device counts per home have surpassed 25 in the United States, stretching traditional outlet configurations and intensifying demand for multi-socket solutions with integrated surge protection. New York State research shows that intelligent advanced power strips can save 106.1 kWh and USD 78.81 per household each year by curbing standby losses[1]New York State Energy Research and Development Authority, “Standby Power Reduction with Tier 2 Advanced Power Strips,” nyserda.ny.gov. WiFi-enabled strips giving residents real-time visibility into consumption patterns are therefore gaining traction, especially in markets where energy codes actively discourage phantom load draw. Manufacturers are responding with slimmer form factors and voice-assistant compatibility to align with prevailing smart-home ecosystems.
Demand for Energy-Efficient Smart-Home Power Management
Utility rebate programs and revised building codes are converting smart strips from optional upgrades into baseline fixtures. California’s Emerging Technology Program validated marketing blueprints that drove widespread adoption of auto-switching models through retailer education and incentive alignment. Europe follows a similar arc, with Commission rules capping networked equipment standby to 0.5 watts and accelerating uptake of strips capable of full circuit isolation. As firmware now incorporates machine-learning algorithms that forecast load cycles, vendors seize recurring-revenue opportunities around cloud dashboards and remote firmware updates.
Data-Center and IT-Infrastructure Expansion
Artificial-intelligence clusters are boosting rack densities above 20 kW, requiring metered PDUs that combine thermal sensing, phase balancing, and secure remote outlets. Global data-center power demand is set to rise 50% by 2027, turning power strip market growth into a strategic imperative for suppliers aligned with hyperscale clients. Schneider Electric’s USD 700 million capacity build-out in the United States earmarks significant spend on next-generation PDU labs calibrated for AI power trains. Concurrently, edge-computing proliferation is fueling orders for compact PDUs suitable for space-constrained micro-sites.
Surge in Remote Working Worldwide
Hybrid work models are redistributing daytime electricity loads to residential circuits. Households now require professional-grade distribution capable of feeding dual monitors, VoIP phones, and broadband routers while safeguarding against grid disturbances. Smart strips integrating small-format UPS modules or lithium backup packs are selling briskly, spurred by the perceived cost of downtime in freelance and consultancy roles. Employers embracing at-home stipend programs often specify devices certified to UL 1449 and cybersecurity frameworks such as IEC 62443 to mitigate liability exposures.
Utility Rebates and Building-Code Mandates for APS
North American rebate schedules reimburse up to 100% of incremental costs for Tier 2 advanced power strips, hastening market conversion. New Jersey’s Technical Reference Manual codifies standardized kWh-savings algorithms, simplifying ROI calculations for facility managers[2]New Jersey Board of Public Utilities, “2023 Triennial Technical Reference Manual,” nj.gov. In parallel, European directives incentivize smart-meter integration, leading builders to pre-install energy-monitoring strips in new-construction flats.
Industrial-IoT-Driven Networked PDU Adoption
Smart factories outfitted with sensor networks require deterministic power sequencing during maintenance cycles. Ethernet-enabled PDUs supporting SNMP and Modbus protocols are becoming the default choices in automotive and semiconductor plants. Asian manufacturers in Japan, South Korea, and China spearhead deployments, encouraged by government grants that prioritize Industry 4.0 retrofits to lift productivity.
Restraints Impact Analysis of Power Strip Market*
| Restraint | (~) % Impact on CAGR Forecast | Geographic Relevance | Impact Timeline |
|---|---|---|---|
| Stringent safety-certification compliance costs | -0.8% | Global – higher burden in developed markets | Long term (≥ 4 years) |
| Counterfeit low-cost products pressure pricing | -0.6% | APAC epicenter, global distribution spill-over | Medium term (2-4 years) |
| PoE adoption reducing outlet demand | -0.4% | North America and EU early movers | Long term (≥ 4 years) |
| E-waste directives raising producer responsibility | -0.5% | EU leadership, expanding worldwide | Long term (≥ 4 years) |
| Source: Mordor Intelligence | |||
Stringent Safety-Certification Compliance Costs
Manufacturers must navigate UL 1363, UL 1449, and sector-specific rules such as UL 60601-1 for healthcare, each requiring exhaustive destructive testing that can exceed USD 250,000 per variant. Emerging cybersecurity add-ons further mandate penetration tests and secure-boot validations, stretching project cycles and engineering budgets. Smaller vendors consequently face longer payback horizons and often retreat to niche or price-led positions, allowing multinationals with compliance teams to widen competitive moats.
Counterfeit Low-Cost Products Pressure Pricing
Illicit channels funnel uncertified strips into online marketplaces where price-first buying behavior dominates. Counterfeits lack flame-retardant casings or thermal fuses, posing fire hazards that erode public trust and force legitimate brands to invest heavily in awareness campaigns. Semiconductor Industry Association reports frequent reclamation of salvaged sockets from e-waste streams, raising shock and short-circuit risks[3]Semiconductor Industry Association, “Counterfeit Electronics Supply Chain Risk Overview,” semiconductors.org.
*Our forecasts treat driver/restraint impacts as directional, not additive. The impact forecasts reflect baseline growth, mix effects, and variable interactions.
Power Strip Market Segment Analysis
By Installation Type:
FPDUs Lead While Smart Strips AccelerateFPDUs commanded 30.86% of 2025 revenue on the back of open-plan office refurbishments specifying under-desk trunking and soft-wiring. The power strip market size for FPDU deployments is projected to expand at 6.62% annually as mobility-first furniture gains momentum. Smart WiFi/Bluetooth strips, while only 14.72% of current volumes, post a 7.45% CAGR as households digitize lighting, security, and entertainment clusters. Relocatable Power Taps retain relevance in events and construction, but their share is trending down amid stricter site-safety enforcement. Rack-mount products in data halls are pivoting toward high-density form factors with hydraulic-magnetic breakers and color-coded phase identifiers to streamline installation. Manufacturers increasingly bundle in-line energy and environmental sensors, setting the stage for Software-as-a-Service add-ons focused on predictive maintenance.
Second-generation flat-head designs answer millwork constraints in hospitality and education builds, while wall-flush variants simplify compliance with aesthetics-oriented building codes. International furniture giants now embed USB-C PD outlets in workstations, embedding power management at the design phase and supplying incremental lift to the power strip market.


By Protection Feature:
Surge Protection Dominates, Energy Monitoring EmergesSurge-protected models held 37.05% revenue in 2025 because transient over-voltage mitigation remains a non-negotiable specification across geographies. The power strip market size linked to energy-monitoring SKUs will, however, outpace at 7.78% CAGR through 2031 as utilities tighten demand-response frameworks. Premium models integrate metering ICs accurate to ±1% and expose cloud APIs, enabling building-management systems to fine-tune loads. Overload protection remains table stakes, yet differentiation now revolves around algorithmic breaker reset that distinguishes inrush from genuine faults. IP-rated waterproof series secure share in agriculture, construction, and food-processing, while fire-retardant casings compliant with UL 94 V-0 escalate usage in hospitals.
By Application:
General Purpose Leads, Smart Applications AccelerateGeneral-purpose variants serve legacy sockets in residences, malls, and light industry, capturing 50.42% share in 2025. That slice will erode as smart categories extend connectivity into all tiers. The power strip market share for smart applications is forecast to climb alongside building digitization targets and IoT adoption in hospitality and education. Special-protection units, once confined to labs, are crossing into mission-critical public-safety infrastructure owing to growing cybersecurity scrutiny. Meanwhile, heavy-duty industrial lines bank on 600 V ratings and gasketed enclosures to tackle oil-and-gas and mining electrification.
By End-User:
Commercial Offices Lead, Residential Growth AcceleratesOpen offices and retail chains remained the power strip market’s largest buyers with a 27.62% share in 2025, deploying desk-grommet units and floor boxes to feed laptops and display panels. The residential rush, fueled by work-from-home norms, clocks 7.46% CAGR as consumers future-proof living spaces with USB-C PD and GaN chargers. Data-center operators demand metered PDUs with secure firmware updates, pushing vendors to certify ISO/IEC 27001 processes. Manufacturers are now counting on industrial clients now engineer rugged IP54 and IP65 lines to survive wash-downs and solvents. Health-care procurement, regulated by CMS, continues to require hospital-grade receptacles with locking plugs, ensuring a recurring replacement cycle.
By Distribution Channel:
Offline Dominates, Online AcceleratesElectrical wholesalers and big-box DIY stores collectively moved 66.85% of 2025 unit volume, a testament to contractor reliance on immediate availability and local inventory. The power strip market size flowing through e-commerce will expand fastest at 8.35% CAGR as product standardization reduces consultative selling needs. Manufacturers are piloting direct-to-consumer portals offering serialized authenticity checks to combat gray-market leakage. Some are layering subscription-based warranty extensions to sustain lifetime revenue.
Geography Analysis
APAC Power Strip Market
Asia-Pacific retained 45.05% of worldwide revenue in 2025, underpinned by new server farms in Singapore, Malaysia, and India. The region’s power strip market size is pegged for a 7.55% CAGR through 2031 as state energy-efficiency mandates and smart-city budgets gain steam. In China, Tier-2 urban centers are accelerating apartment retrofits with embedded wall outlets hosting Ethernet-based power strips. India’s production-linked incentive schemes for electronics amplify domestic demand and favor certified local manufacturing under BIS guidelines. Southeast Asian governments, meanwhile, bundle surge-protected strips into school modernization grants, alleviating import duties for compliant products.
North America Power Strip Market
North America remains a sizeable but maturing territory. Data-center expansions across Virginia’s “Data Alley” and Arizona’s solar-powered campuses buoy demand for intelligent rack PDUs. Smart-home penetration rates surpass 60% in Canada’s major provinces, lifting residential upgrade cycles. Utility rebate programs for Tier 2 advanced power strips underpin sustained household uptake.
EMEA and South America Power Strip Market
Europe’s prospects hinge on eco-design directives and electrification of heating loads; German and French building codes now earmark receptacle counts per square meter, indirectly driving aftermarket installations. South America and MEA represent opportunistic plays tied to infrastructure rollouts and tourism growth, though currency volatility often skews project timelines.

Regulatory Landscape
Global power strip compliance is anchored in safety and electrical-equipment rules that determine market access and listing costs. In the European Union, products in this category fall under the Low Voltage Directive 2014/35/EU, which ties market access to conformity assessment and the use of harmonized standards for electrical safety.
Standards updates and enforcement actions continue to raise expectations for design controls and documentation. In February 2025, the IEC published IEC 60884-2-7:2025 (Second Edition), updating requirements for cord extension sets and aligning with IEC 60884-1, which influences extension-set and cord-connected configurations sold in IEC-aligned markets. In the United States, common compliance routes include UL 1363 (and UL 1363A for healthcare applications), while U.S. Consumer Product Safety Commission market surveillance and recall mechanisms increase the financial risk of noncompliance, as reflected in the March 2026 recall of CCCEI-branded power strips sold by Middle Way Electronics, tied to fire risk from missing overcurrent protection.
Value Chain Analysis
The value chain begins with metals and polymers, notably copper for conductors and bus bars, then moves into electrical and electronic subassemblies such as plugs, receptacles, circuit breakers and fuses, MOV-based surge boards, and increasingly USB-C Power Delivery modules and metering ICs for smart strips and rack PDUs. Upstream capabilities, including tooling, injection molding, stamping, SMT assembly for control boards, and final assembly and testing, connect directly to compliance activities, where third-party testing and certification (UL, CE, VDE pathways) act as time and cost gates that influence product cadence and SKU rationalization.
Manufacturing and subassembly sourcing remain concentrated in East Asia, while downstream customization, including cord length, outlet orientation, mounting hardware, labeling, and regional plug types, and packaging are often localized for North America and Europe. Compliance-driven bottlenecks show up as long test and certification queues, with European CE and VDE-related lead times cited at 12 to 20 weeks for new or modified designs, which can delay channel launches. China-specific standardization also affects component selection and supplier qualification, including GB/T 2099.31-2025 for socket-outlets equipped with USB power supplies (issued April 2025, effective November 1, 2025) and the transition to GB 2099.7-2024 for household and similar power strip sockets (effective in 2025), pushing suppliers and OEMs to update designs, overcurrent protection approaches, and documentation before products flow through offline wholesalers and growing e-commerce channels.
Competitive Landscape
The power strip market hosts a mid-tier oligopoly where the top five brands collectively account for roughly 55% of global sales, yielding healthy yet contestable margins. Multinationals such as Eaton, Schneider Electric, and Legrand leverage entrenched distributor relationships and multi-vertical product suites to defend share. Their in-house testing labs streamline UL and IEC certifications, compressing time-to-market for AI-ready PDUs. Schneider Electric’s USD 700 million U.S. footprint expansion exemplifies the capital depth required to sustain latency-sensitive supply chains while integrating cybersecurity hardening into firmware[4]Schneider Electric, “Schneider Electric Expands U.S. Manufacturing Footprint,” se.com. Eaton deploys mass-configuration tooling so colocation operators can commission hundreds of racks within days.
Emerging challengers center offerings on software-defined load orchestration and predictive analytics. Many pursue direct-to-consumer webstores to bypass wholesale mark-ups, bundling mobile apps and cloud dashboards under freemium models. Patent filings show start-ups experimenting with silicon carbide (SiC) surge modules that slash clamping response times. Meanwhile, specialist vendors of healthcare-grade strips forge alliances with nurse-call platform providers to embed preventative alerting within patient rooms.
MandA activity is expected to intensify as incumbents close feature gaps and broaden geographic reach. Private-equity-backed roll-ups target niche Asian suppliers adept at low-cost manufacturing yet lacking certification muscle to penetrate Western markets. Vendors face rising stakes in counterfeit mitigation; serialization, blockchain traceability, and tamper-evident packaging are being piloted to protect brand equity. Pricing discipline is upheld by the cost and complexity of UL listings, conferring a defensive hurdle against commoditization even as raw-material prices fluctuate.
Power Strip Industry Leaders
Belkin International, Inc.
Leviton Manufacturing Co., Inc.
Panasonic Corporation
Legrand SA
Hubbell Incorporated
- *Disclaimer: Major Players sorted in no particular order
Power Strip Market Companies Covered in this Report
- Eaton (Tripp Lite)
- Legrand SA
- Schneider Electric (incl. APC)
- Koninklijke Philips N.V.
- ABB Ltd
- Hubbell Incorporated
- Belkin International
- Leviton Manufacturing
- Panasonic Corporation
- Delixi Electric
- Falconer Electronics
- Cyber Power Systems
- General Electric Co.
- Anker Innovations
- TP-Link Technologies
- Bestek Corp.
- Huntkey Enterprise Group
- Mersen S.A.
- Monster Inc.
- Accell Corporation
- Hama GmbH and Co KG
- UbiGear

Market Opportunities and Future Outlook
A key whitespace sits at the intersection of energy visibility and outlet density, where smart strips and rack PDUs add metering, controllability, and software hooks rather than functioning as passive accessories. Data center electrification provides a concrete pull-through for intelligent rack power ecosystems: Legrand highlighted in January 2026 that it is integrating UPS, switchgear, busway, and rack power distribution units into unified electrical ecosystems tailored for AI-ready deployments, while Schneider Electric has been advancing the APC NetShelter Rack PDU Advanced platform positioned for higher-density AI workloads and modular power deployment.
Policy and standards direction also supports opportunities in high-efficiency and interoperable power delivery, particularly USB-C Power Delivery and low-standby designs. Commission Regulation (EU) 2025/2052 introduces new ecodesign requirements covering external power supplies, wireless chargers, and USB Type-C cables, which supports migration toward more efficient charging architectures and encourages power-strip makers to incorporate compliant USB-C PD modules and higher-efficiency internal power conversion. In the United Kingdom, the Energy Smart Appliances Regulations 2026 creates a framework for demand-side-response capable devices, which supports connected power management hardware and advanced power strips that enable automated load control across broader smart energy ecosystems.
Recent Industry Developments in Power Strip Market
- April 2026: Leviton introduced the VerifEye Series 2500 Submeter for single, two, and three-phase applications. The product is aimed at higher-resolution energy monitoring deployments that track the market shift toward metering-enabled power distribution in commercial and industrial sites. It also supports attach potential where monitored circuits feed into facility energy management and compliance reporting workflows.
- January 2026: Belkin unveiled a new lineup of charging and power accessories at CES 2026, spanning next-generation consumer charging solutions. The refresh keeps competitive pressure on feature-rich, design-led power and charging form factors sold through high-velocity retail and e-commerce channels. It also reinforces the convergence of power strips with USB-C PD and multi-device charging expectations in residential and home-office settings.
- September 2025: Panasonic Industry Europe announced a technology partnership with FISEGO Holding GmbH to supply polarized DW-YL relays for FISEGO smart power strips that incorporate integrated fire protection technology. The relay capability targets high-inrush switching and safety performance, aligning with rising demand for premium safety and protection features in connected strips. VDE certification for the partner product line also points to how third-party approvals are being used to differentiate in Europe’s compliance-driven channels.


Power Strip Market Report Scope and Research Methodology
Market Definition and Coverage
The power strip market covers multi-outlet power distribution devices that expand a single wall outlet into multiple usable sockets, with or without added functions such as surge protection, USB charging, and basic monitoring. We size the market using products sold into residential, commercial, and industrial end use.
Scope exclusions: We exclude upstream copper cable and plug components sold as raw materials. We also exclude power supplies and chargers that are not sold as a multi-outlet strip product.
Segments Covered in This Report
- By Installation Type
- Furniture Power Distribution Units (FPDUs)
- Multioutlet Assemblies
- Relocatable Power Taps (RPTs)
- Rack-mount Power Distribution Strips
- Flat-head / Low-profile Power Strips
- Embedded / In-wall Power Strips
- Smart WiFi / Bluetooth Power Strips
- By Protection Feature
- Surge Protection
- Overload Protection
- Waterproof / Dust-proof (IP Rated)
- Fire-resistant Casing
- Energy Monitoring and Metering
- By Application
- Common / General Purpose
- Special Protection
- Smart Power Strips
- Heavy-duty Industrial
- By End-User
- Industrial Manufacturing Facilities
- Data Centers and IT Rooms
- Commercial Offices and Retail
- Healthcare Facilities
- Hospitality and Leisure
- Education and Public Institutions
- Residential
- By Distribution Channel
- Offline (Electrical Wholesalers and Retail)
- Online (E-commerce Platforms)
- By Geography
- North America
- United States
- Canada
- Mexico
- Europe
- Germany
- United Kingdom
- France
- Italy
- Spain
- Russia
- Rest of Europe
- Asia-Pacific
- China
- Japan
- India
- South Korea
- ASEAN
- Australia and New Zealand
- Rest of Asia-Pacific
- South America
- Brazil
- Argentina
- Rest of South America
- Middle East and Africa
- Middle East
- Saudi Arabia
- UAE
- Turkey
- Rest of Middle East
- Africa
- South Africa
- Nigeria
- Rest of Africa
- Middle East
- North America
Data Sources, Market Sizing, and Validation
Desk Research
Desk research starts with mapping the technical and regulatory meaning of a power strip, then linking it to measurable demand signals. For this, we refer to safety and performance standards and guidance (such as UL and IEC documents), along with public energy and electrification statistics from sources such as the International Energy Agency, the US Energy Information Administration, and national statistical offices.
We also use macro and sector indicators that connect to socket expansion needs, such as building and construction activity, data center capacity additions, and commercial floor space trends, supported by sources such as the US Census Bureau, Eurostat, and selected customs trade statistics where relevant. For company context, we review public filings, investor presentations, product catalogs, and trusted press coverage, and we selectively use paid subscriptions for company financials, news, and patent lookups to sanity check product innovation cycles. This list is not exhaustive, and we used many other public sources during the research for data collection, validation, and clarification.
Primary Interviews and Surveys
Primary work focuses on confirming how demand is converted into sales across channels, and how pricing shifts by feature set and end use. We interview manufacturers, distributors, retailers, and large buyers such as facility teams and IT room operators across the Americas, EMEA, and APAC, so the assumptions reflect regional wiring practices and certification requirements.
Distribution of primary research fieldwork respondents
| Company type | Respondent position | Region |
|---|---|---|
| Top tier: 32% | CXOs: 16% | APAC: 39% |
| Mid tier: 50% | Functional/Unit leaders: 40% | EMEA: 35% |
| Smaller Players: 18% | Managers: 44% | Americas: 26% |
Market-Sizing & Forecasting
Sizing is built using a combined top-down and bottom-up approach, where installation and equipment demand pools are reconstructed and then translated into power strip unit needs. We start from visible demand drivers such as electrified households, office and retail build-outs, data center rack additions, and industrial workstation expansion, then convert them into likely strip counts per site and replacement cycles.
We corroborate those totals with selective bottom-up approximations, mainly through supplier and channel checks that use sampled average selling prices (ASPs) by feature level and estimated unit mix across standard strips, surge-protected models, USB-enabled versions, and smart or monitored variants. Key inputs we track include ASP spreads between basic and surge-protected products, certification-driven price premiums, channel mix shifts toward online, changes in commercial and data center share, and observed replacement frequency linked to safety and wear. For forecasting, we use scenario analysis supported by simple time-series smoothing for volumes, then adjust ASP paths based on feature adoption and material cost expectations validated through expert feedback. Where gaps exist for smaller local brands, we bridge them using channel share ranges and import or retail proxy signals, followed by a re-check against implied per-building and per-rack penetration.
Data Validation & Update Cycle
We validate outputs by comparing modeled values against independent checks, such as implied units per household, units per commercial site, and consistency with data center build indicators in each major region. When results fall outside expected bands, we review conversion factors, currency timing, and feature mix, and then revisit assumptions with follow-up expert calls if the variance cannot be explained.
Before sign-off, the work goes through multi-step analyst reviews to keep arithmetic, logic, and scope alignment consistent across regions and years. Reports are refreshed annually, and interim updates are made when material events occur, such as large safety recalls, sudden tariff changes, or sharp swings in input costs. Right before delivery, an analyst runs a final update pass so clients receive the latest view.
Mordor Intelligence's Power Strip Market Sizing Compared With Other Published Estimates
Published market values for power strips can vary even when the product sounds straightforward, because the counted product set and the price basis are not always the same. Differences usually come from whether surge protection is treated as part of the core market, how smart and monitored strips are handled, and whether the estimate reflects factory-level revenue or downstream resale values.
Another common gap comes from how analysts convert demand signals into units and then into dollars, particularly when replacement cycles and channel mix are assumed rather than validated. Some models lean heavily on shipment proxies or keep ASPs flat, while others assume fast smart-feature penetration that raises the average price. In our approach, relocatable power taps and multi-outlet assemblies are counted as the core product, while adjacent PDUs and broader surge protection devices are not rolled into the total, which keeps the scope aligned with the definition used in this Mordor Intelligence market sizing.
Benchmark comparison
| Source | Market Size | Gaps in Research Methodology |
|---|---|---|
| Mordor Intelligence | USD 14.99 B (2026) | |
| Industry Association A | USD 13.60 B (2026) | Often relies on member-reported shipments and may undercount online-first sales and private label volumes, which can pull down both units and implied ASPs. |
| Global Consultancy B | USD 16.80 B (2026) | May fold rack PDUs and broader surge protection devices into the same bucket, and may apply faster smart-feature uptake that increases ASP progression. |
The spread across published figures mainly traces back to whether adjacent power distribution hardware is included, and how ASP uplift from surge and smart features is treated over time. By tying volumes to practical demand pools and then checking price and mix with channel and buyer feedback, our estimate stays traceable to clear assumptions that can be repeated year after year.


Key Questions Answered in the Report
What is the current size of the global power strip market?
The market stands at USD 14.99 billion in 2026 and is forecast to reach USD 21.02 billion by 2031.
What compound annual growth rate (CAGR) is projected for the power strip market?
The market is projected to advance at a 6.98% CAGR between 2026 and 2031.
Which region holds the largest share of the power strip market?
Asia-Pacific leads with 45.05% revenue share in 2025 and continues to post the fastest growth.
Which installation type currently dominates global demand?
Furniture Power Distribution Units (FPDUs) lead with 30.86% market share in 2025.
Which power-strip feature is expanding fastest?
Energy-monitoring and metering capabilities are expanding at an 7.78% CAGR between 2026 and 2031, reflecting rising demand for consumption visibility.
Why are smart power strips gaining rapid traction in homes?
Smart strips curb standby losses, integrate with WiFi networks, and qualify for utility rebates, making them attractive for energy-conscious households.
Page last updated on:


 Your data is secure and never sold or shared.


