
Power Quality Equipment Market Size and Share
Market Overview
| Study Period | 2021 - 2031 |
|---|---|
| Market Size (2026) | USD 20.3 Billion |
| Market Size (2031) | USD 28.26 Billion |
| Growth Rate (2026 - 2031) | 6.83 % |
| Fastest Growing Market | Asia-Pacific |
| Largest Market | Asia-Pacific |
| Market Concentration | Medium |
Major Players *Disclaimer: Major Players sorted in no particular order Image © Mordor Intelligence. Reuse requires attribution under CC BY 4.0. | |
Power Quality Equipment Market Analysis by Mordor Intelligence
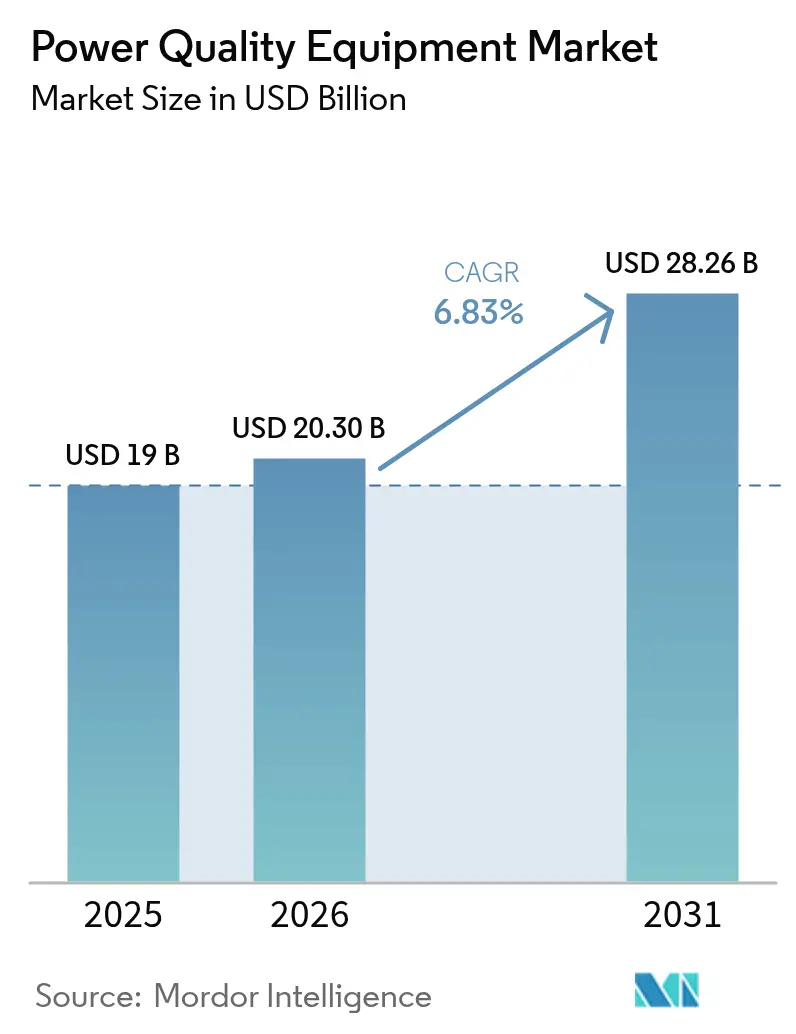
The Power Quality Equipment Market size was valued at USD 19 billion in 2025 and estimated to grow from USD 20.3 billion in 2026 to reach USD 28.26 billion by 2031, at a CAGR of 6.83% during the forecast period (2026-2031).
Rising digitalization of factories, expanding renewable capacity, and rapid data-center build-outs underscore why even microsecond power disturbances now translate into costly downtime across global industries. Utilities and manufacturers are shifting from reactive protection to predictive, software-driven systems that diagnose and correct issues in real time. Growing deployment of advanced power electronics, machine-learning algorithms, and bidirectional grid controls is redefining power quality from a niche maintenance task into a strategic enabler of electrification and sustainability. Asia-Pacific commands almost one-half of global demand, underpinned by record grid investments in China and India’s renewable surge.
Key Report Takeaways
- By equipment type, Uninterruptible Power Supply systems captured 37.18% of the power quality equipment market share in 2025. Voltage regulators and conditioners are advancing at a 9.62% CAGR through 2031, the fastest pace within the power quality equipment market.
- By phase, three-phase solutions led with 60.05% share of the power quality equipment market in 2025, while single-phase products are poised for a 7.12% CAGR to 2031.
- By voltage class, medium-voltage devices accounted for 52.15% share of the power quality equipment market size in 2025; low-voltage units are forecast to post the highest 8.01% CAGR through 2031.
- By application, renewable-integration and data-center projects jointly represented 32.45% of the power quality equipment market size in 2025, whereas EV fast-charging infrastructure is projected to expand at a 9.08% CAGR between 2026 and 2031.
- By end-user, commercial and industrial facilities held 62.35% market share in 2025; utilities constitute the fastest-growing user base at a 7.18% CAGR to 2031.
- By geography, Asia-Pacific accounted for the largest share, 48.05% in 2025, and is also likely to grow the fastest, at a CAGR of 8.22% through 2031.
Note: Market size and forecast figures in this report are generated using Mordor Intelligence’s proprietary estimation framework, updated with the latest available data and insights as of 2026.
Market Trends and Insights
Drivers Impact Analysis of Power Quality Equipment Market*
| Driver | (~) % Impact on CAGR Forecast | Geographic Relevance | Impact Timeline |
|---|---|---|---|
| Rapid growth of sensitive electronics in Industry 4.0 processes | +1.8% | Global, with early gains in Germany, China, Japan | Medium term (2-4 years) |
| Expansion of data centres requiring high-availability power | +1.5% | Global, concentrated in North America, APAC core | Short term (≤ 2 years) |
| Investments in smart grids & T&D modernisation | +1.2% | Global, spill-over to developing economies | Long term (≥ 4 years) |
| Stringent global power-quality standards (IEEE 519, EN 50160) | +0.9% | Global, with regulatory enforcement in EU & North America | Medium term (2-4 years) |
| Electrification of marine vessels driving harmonic-mitigation demand | +0.6% | Global, with early gains in Norway, Netherlands, Singapore | Long term (≥ 4 years) |
| On-site green-hydrogen electrolysers needing ultra-clean power | +0.4% | EU, Australia, Middle East, spill-over to APAC | Long term (≥ 4 years) |
| Source: Mordor Intelligence | |||


Rapid growth of sensitive electronics in Industry 4.0 processes
Precision manufacturing lines now rely on sub-microsecond timing and AI-driven controls that tolerate minimal voltage variation. The 2024 reapproval of SEMI F47 sag-immunity rules intensified demand for dynamic voltage restorers and active filters able to act within milliseconds [1]SEMI, “SEMI F47 Voltage Sag Immunity Standard Reapproved,” semi.org. Downtime risk in semiconductor fabs and automotive plants elevates power continuity from a maintenance cost to a competitive differentiator. As factories embed more machine-learning models, continuous clean power becomes essential for algorithmic accuracy, boosting the power quality equipment market.
Expansion of data centers requiring high-availability power
Rack densities trending toward 1 MW and liquid-cooled AI clusters impose tight ±1% voltage-regulation targets legacy UPS topologies struggle to meet. Hyperscale operators deploy modular architectures that distribute filtering and battery functions, eliminating single points of failure while cutting losses [2]Vertiv, “Data Center Trends 2025,” vertiv.com. Cooling pumps and in-row heat exchangers add harmonic distortion, heightening demand for active filters. With data centers now absorbing 3-4% of global electricity, intelligent power distribution that adapts to real-time workloads is reshaping the power quality equipment market.
Investments in smart grids and T&D modernisation
Utility distribution-system spending climbed to USD 50.9 billion in 2023, and storage outlays jumped sevenfold within a year, catalyzing the adoption of STATCOMs and advanced voltage regulators [3]U.S. Energy Information Administration, “Grid Infrastructure Investments Drive Increase in Utility Spending,” eia.gov. Dynamic line-rating and grid-forming inverters raise transfer capacity without new lines, but also demand precise harmonic control. Advanced metering infrastructure gives utilities visibility down to the customer meter, enabling targeted power-quality corrections that reinforce the long-term growth of the power quality equipment market.
Stringent global power-quality standards (IEEE 519, EN 50160)
IEEE 519’s 2022 update tightened current-distortion limits at the point of common coupling, pushing manufacturers and utilities to adopt real-time monitoring with automated corrective actions. Field studies show 37% of U.S. premises breaching harmonic thresholds, signaling latent retrofit demand. EN 50160 complements IEEE rules across Europe, ensuring equipment compatibility in cross-border grids and continuously driving procurement of instruments that verify compliance.
Restraints Impact Analysis of Power Quality Equipment Market*
| Restraint | (~) % Impact on CAGR Forecast | Geographic Relevance | Impact Timeline |
|---|---|---|---|
| High upfront cost of advanced PQ solutions | -1.1% | Global, particularly affecting emerging markets | Short term (≤ 2 years) |
| Shortage of skilled PQ analysis professionals | -0.8% | Global, acute in APAC and MEA regions | Medium term (2-4 years) |
| Emergence of solid-state transformers reducing stand-alone PQ demand | -0.5% | North America & EU, early adoption markets | Long term (≥ 4 years) |
| OEM active-front-end drives curbing aftermarket filter sales | -0.3% | Global, concentrated in industrial automation hubs | Medium term (2-4 years) |
| Source: Mordor Intelligence | |||
High upfront cost of advanced PQ solutions
Utility-scale STATCOMs command USD 1-3 million per unit and often require equal amounts for engineering and commissioning, stretching payback periods to five years in some regions. Currency swings and import duties inflate prices further for developing-country buyers. Vendors are countering by modularizing systems, allowing phased upgrades that match budget cycles, while service-based financing converts capital expense into predictable opex streams, yet near-term adoption in the power quality equipment market remains constrained.
Shortage of skilled PQ analysis professionals
Modern installations blend power electronics, controls, and data analytics, but university curricula lag, producing fewer technicians to configure and maintain such systems. Southeast Asian and Gulf firms frequently import expatriate engineers, raising project costs and elongating schedules. Industry certification schemes and vendor academies are expanding, yet the supply-demand gap is projected to persist through 2028, tempering the growth of the power quality equipment industry.
*Our forecasts treat driver/restraint impacts as directional, not additive. The impact forecasts reflect baseline growth, mix effects, and variable interactions.
Power Quality Equipment Market Segment Analysis
By Equipment Type:
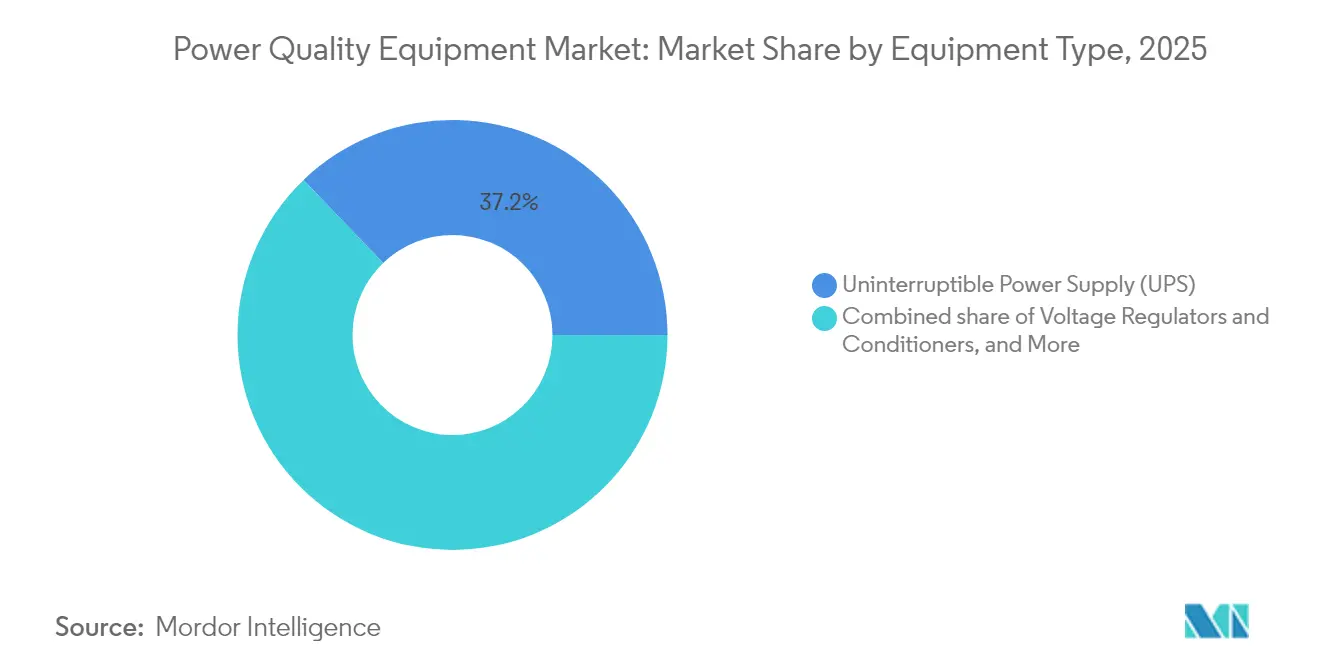
UPS Systems Drive Market LeadershipUninterruptible Power Supply systems held 37.18% of the power quality equipment market in 2025, demonstrating their critical role in safeguarding servers, medical devices, and industrial controllers. Voltage regulators and conditioners lead growth at a 9.62% CAGR to 2031, reflecting the rising sensitivity of electronics to even minor voltage excursions. Smart UPS models with predictive maintenance enhance uptime and cut lifecycle costs, further anchoring segment dominance. Harmonic filters enjoy steady demand amid broader adoption of variable-frequency drives in factories.
Static VAR compensators and STATCOM platforms are gaining traction as grids integrate greater renewable energy, creating opportunities for medium-voltage deployments that stabilize voltage and frequency in real time. Socomec’s 2025 launch of a high-density UPS hitting 99% efficiency underscores how vendors blend space savings with energy gains, reinforcing overall expansion of the power quality equipment market size. Surge-protection devices also benefit from the updated IEC 61643-01:2024 standard, while static transfer switches penetrate mission-critical campuses that cannot tolerate even millisecond disruptions.


By Phase:
Three-Phase Dominance in Industrial ApplicationsThree-phase architectures commanded 60.05% share of the power quality equipment market in 2025 as factories, refineries, and commercial towers favor their higher efficiency and inherent load balancing. Advanced controllers now measure and correct each phase independently, minimizing imbalance and reducing transformer stress. Single-phase units are projected to grow at a 7.12% CAGR, buoyed by home solar inverters and small retail sites where simplicity outweighs efficiency gains.
Residential EV chargers and rooftop PV arrays increasingly specify smart single-phase filters communicating with building-management platforms. Meanwhile, industrial users standardize on three-phase designs to exploit economies of scale in cabling and switchgear as global electrification accelerates, locking in long-term dominance within the power quality equipment market.
By Voltage Class:
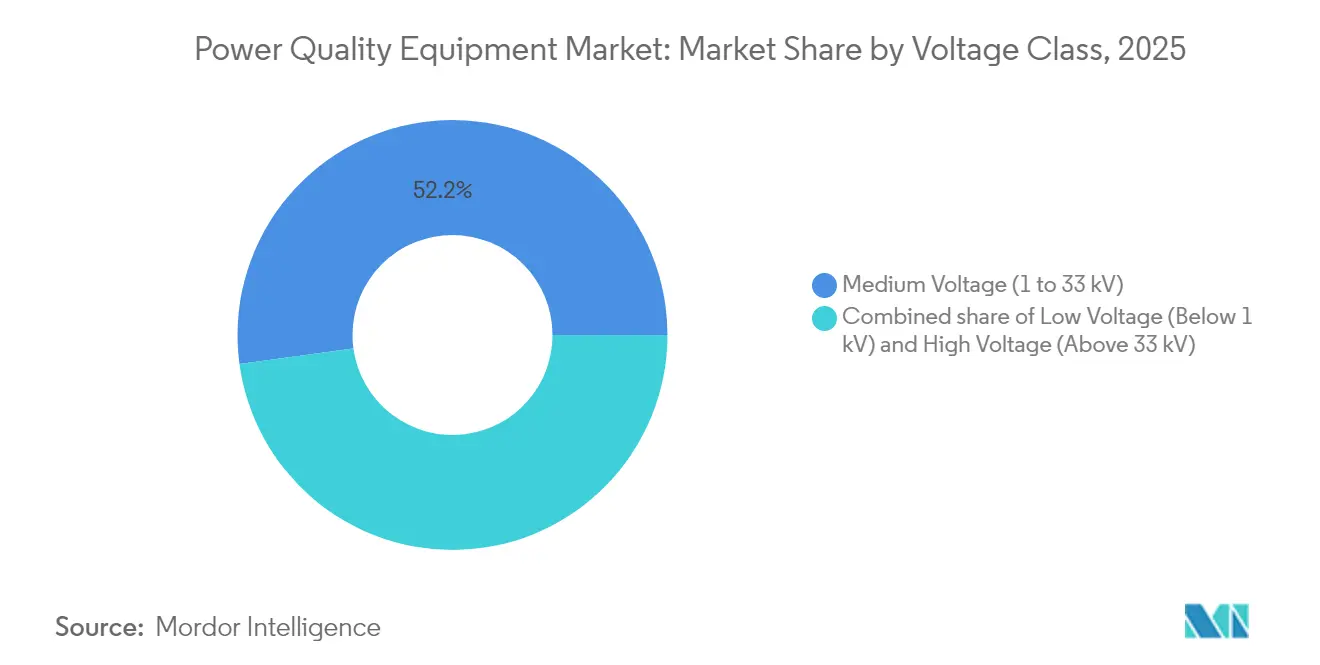
Medium-Voltage Leadership Reflects Infrastructure FocusMedium-voltage (1–33 kV) systems accounted for a 52.15% share of the power quality equipment market size in 2025, serving as the interface between high-voltage transmission and low-voltage end use. Distribution feeders experience diverse harmonic sources, prompting utilities to install dynamic VAR devices at substations. Low-voltage products will grow fastest at 8.01% CAGR to 2031 as homes and small businesses add smart loads that demand local conditioning.
High-voltage solutions sustain demand in export-oriented renewables such as offshore wind, illustrated by Hitachi Energy’s STATCOM deployment at Hornsea 4, which anchors voltage on subsea cables . Modular low-voltage gear also gains ground thanks to plug-and-play designs that retrofit into existing panels without shutdowns, sustaining momentum for the broader power quality equipment market.
By Application:
Renewable Integration Leads Market TransformationRenewable-integration and data-center projects jointly captured 32.45% power quality equipment market share in 2025 as grids absorb variable solar- and wind-output while cloud providers demand near-perfect uptime. Grid-forming battery energy-storage systems now deliver energy- and power-quality services, bridging intermittent generation with sensitive digital loads.
EV fast-charging infrastructure is forecast to post the highest 9.08% CAGR through 2031, necessitating real-time harmonic suppression to protect adjacent feeders. Oil-and-gas installations maintain resilient demand for rugged power conditioners in remote sites, while marine electrification introduces niche requirements for corrosion-resistant harmonic filters, adding diversity to the power quality equipment industry.
By End-User:
Commercial and Industrial DominanceCommercial and industrial users held a 62.35% share of the power quality equipment market 2025, as downtime in factories or hospitals can cost millions per incident. Utilities, however, are poised for a 7.18% CAGR to 2031, propelled by regulatory incentives to integrate distributed energy resources while guaranteeing voltage quality.
Electric cooperatives now pilot premium-power tariffs that bundle real-time harmonic monitoring, offering differentiated service to high-tech tenants. Residential customers adopt combo inverter-conditioners bundled with rooftop PV and battery packages, widening the user base for the power quality equipment market.

Geography Analysis
APAC Power Quality Equipment Market
Asia-Pacific retained 48.05% market share in 2025 and is set for an 8.22% CAGR through 2031, anchored by China’s USD 88.7 billion 2025 grid investment and India’s renewable expansion that together demand sophisticated conditioning. Regional innovators such as Huawei Digital Power deploy grid-forming storage that marries frequency control with energy arbitrage, accelerating adoption. Japan and South Korea add momentum via semiconductor-driven power-quality upgrades that meet stringent sag-immunity criteria.
North America Power Quality Equipment Market
North America ranks second, buoyed by hyperscale data-center builds and USD 1.42 billion utility modernization plans in Pennsylvania that emphasize advanced voltage regulation. Federal tax incentives for grid-hardening intensify spending on STATCOMs and harmonic filters, while Canada’s HVDC research investments cultivate indigenous expertise, thereby reinforcing regional demand in the power quality equipment market.
Europe Power Quality Equipment Market
Europe focuses on renewable integration and industrial decarbonization, exemplified by Germany’s first 300 MVAr grid-forming STATCOM that stabilizes a wind-heavy network. EN 50160 compliance pressures commercial sites to deploy permanent monitoring. The EU’s energy-independence agenda fosters procurement of efficient power-quality devices that squeeze losses from electrified industrial clusters, sustaining steady expansion of the power quality equipment market.


Regulatory Landscape
Power quality requirements are shaped by international measurement and compatibility standards, along with region-specific implementation rules that affect how meters, filters, and active correction devices are specified. IEC 61000-4-30:2025 (published October 2025) tightened standardization of power quality measurement methods for 50/60 Hz systems, while IEC TS 62749:2026 (published March 2026) updated assessment methods for public low-, medium-, and high-voltage networks up to 230 kV, supporting more consistent utility-side assessment and reporting.
On the equipment side, EN IEC 63497:2026 (published April 2026 by CENELEC) provides a product framework for shunt-connected active correction devices, including static VAR generators and active harmonic filters, shaping compliance testing and procurement in Europe. China implemented GB/T 19862-2025 in February 2026, updating general requirements for power quality monitoring equipment, alongside GB/Z 44118.1-2024 principles for power quality technical management (implemented September 2024). In the EU, Commission Regulation (EU) 2025/2052 (enacted October 2025) adds ecodesign requirements for external power supplies, which reinforces efficiency and interoperability considerations that flow into connected power-conditioning architectures used across commercial and industrial installations.
Competitive Landscape
The power quality equipment market exhibits moderate consolidation as Schneider Electric, ABB, Eaton, and Siemens collectively leverage global plants and broad portfolios to secure multinational projects. Incumbents increasingly bundle cloud analytics with hardware, transforming products into subscription-based platforms that predict failures and automate service dispatch.
Strategic alliances and selective acquisitions intensify: Eaton’s 2025 tie-up with Siemens Energy accelerates turnkey data-center deployments, while ABB’s purchase of SEAM Group extends lifecycle services across North American sites. Asian challengers exploit cost advantages and state backing to penetrate emerging markets, pressuring traditional margins and pushing incumbents toward higher-value software layers.
Component shortages since 2023 prompted heavy capital injections: Hitachi Energy committed an extra USD 250 million for transformer capacity, and HD Hyundai Electric announced USD 274 million to expand U.S. and Korean plants. These moves underscore a strategic race to localize production near high-growth demand centers, further shaping competition within the power quality equipment industry.
Power Quality Equipment Industry Leaders
Siemens AG
Schneider Electric SE
Eaton Corporation plc
ABB Ltd / Hitachi Energy (combined FACTS)
Vertiv Holdings Co.
- *Disclaimer: Major Players sorted in no particular order

Power Quality Equipment Market Companies Covered in this Report
- Hitachi Energy Ltd
- Siemens AG
- Eaton Corporation plc
- Emerson Electric Co.
- Schneider Electric SE
- General Electric Co.
- Toshiba Corp.
- Schaffner Holding AG
- MTE Corporation
- Active Power Inc.
- ABB Ltd
- Vertiv Holdings Co.
- Huawei Digital Power
- Mitsubishi Electric Corp.
- Delta Electronics Inc.
- Piller Power Systems
- Socomec SA
- Legrand SA
- K-Star
- Kehua Tech

Market Opportunities and Future Outlook
Standardization updates are creating near-term demand for compliance-ready monitoring and verification, particularly where utilities and large facilities need harmonized methods and device qualifications. IEC 61000-4-30:2025 and IEC TS 62749:2026 raise the bar for consistent measurement and network assessment up to 230 kV, while China's GB/T 19862-2025 implementation (February 2026) and GB/Z 44118.1-2024 technical management principles institutionalize power quality programs that favor modern meters, permanent monitors, and analytics-enabled platforms. On the corrective side, EN IEC 63497:2026 clarifies EMC, safety, and performance expectations for shunt-connected active correction devices (including active harmonic filters and static VAR generators), supporting more standardized product selection and qualification.
Supply chain localization and capacity expansion around data center and grid infrastructure are also creating an operational pull for power quality equipment integrated with switchgear, transformers, and modular power blocks. In April 2026, Eaton announced a USD 30 million investment for a 370,000-square-foot switchgear manufacturing facility in Bellevue, Nebraska, oriented to modular, scalable power systems for data centers. In June 2026, Hitachi Energy broke ground on a USD 457 million expansion in South Boston, Virginia, to create the nation's largest site for large power transformer production, and Siemens disclosed new investments tied to power infrastructure demand from AI and data centers (including a reported EUR 300 million plan to expand switchgear production in Frankfurt and Offenbach, Germany in July 2026). These moves expand upstream electrical infrastructure availability where harmonic mitigation, voltage regulation, and monitoring are increasingly specified as part of packaged, high-availability power architectures.
Recent Industry Developments in Power Quality Equipment Market
- July 2026: ABB announced the acquisition of French silicon carbide (SiC) power electronics specialist Advantics. The deal strengthens ABB's access to high-efficiency switching and higher power-density conversion building blocks, supporting next-generation power conversion architectures used in fast-charging and DC power systems where power quality performance is critical.
- March 2026: Eaton collaborated with NVIDIA to unveil its Beam Rubin DSX platform for AI data centers, centered on modular grid-to-chip power infrastructure. The launch reinforces a shift toward integrated, containerized power blocks that combine conversion, monitoring, and conditioning functions to shorten deployment timelines for high-density digital loads.
- July 2024: The IEC published IEC 61000-2-4:2024, defining compatibility levels for low-frequency conducted disturbances in industrial electrical environments. The update anchors stricter compatibility expectations at industrial sites and supports broader adoption of monitoring and mitigation equipment to validate and maintain compliant power conditions.


Power Quality Equipment Market Report Scope and Research Methodology
Market Definition and Coverage
For this study, the power quality equipment market is defined as revenue earned from devices used to monitor, correct, and maintain electrical power quality so end users and grid operators can reduce disturbances like harmonics, voltage sags, and transients.
Scope exclusions: We exclude routine electrical installation services and general switchgear that is not primarily sold for power quality monitoring or correction.
Segments Covered in This Report
- By Equipment Type
- Uninterruptible Power Supply (UPS)
- Harmonic Filters
- Static VAR Compensators (SVC/STATCOM)
- Power Quality Meters
- Surge Protection Devices
- Active Power Filters
- Static Transfer Switches
- Voltage Regulators and Conditioners
- Other Equipment Types
- By Phase
- Single-Phase
- Three-Phase
- By Voltage Class
- Low Voltage (Below 1 kV)
- Medium Voltage (1 to 33 kV)
- High Voltage (Above 33 kV)
- By Application
- Renewable Integration
- Automation and Robotics
- EV Fast-Charging Infrastructure
- Oil and Gas Operations
- Marine and Offshore Platforms
- Others
- By End-User
- Utilities
- Commercial and Industrial
- Residential
- By Geography
- North America
- United States
- Canada
- Mexico
- Europe
- Germany
- United Kingdom
- France
- Italy
- Spain
- Russia
- Rest of Europe
- Asia-Pacific
- China
- India
- Japan
- South Korea
- ASEAN Countries
- Australia
- Rest of Asia-Pacific
- South America
- Brazil
- Argentina
- Chile
- Rest of South America
- Middle East and Africa
- United Arab Emirates
- Saudi Arabia
- South Africa
- Egypt
- Rest of Middle East and Africa
- North America
Data Sources, Market Sizing, and Validation
Desk Research
Desk work started with mapping the product boundary and demand centers for power quality equipment, then linking them to electricity system signals that are published regularly. We used public sources such as the International Energy Agency (electricity demand and grid trends), the US Energy Information Administration (power consumption indicators), the US Department of Energy program material on grid reliability, and power-quality standards guidance from IEEE and IEC documents that clarify what specific problems these products address.
To keep the numbers grounded, we also reviewed company annual reports, investor presentations, and press coverage to understand typical end-user adoption patterns and pricing direction. In a few places, we used paid subscriptions only for company financial intelligence, shipment trade-line checks, and patent lookups, mainly to reduce gaps where public filings were not detailed enough. The sources listed here are not exhaustive, and many other public and industry references were also used for cross-checks and clarification.
Primary Interviews and Surveys
Primary work focused on validating how demand is actually triggered and how buyers decide between corrective hardware and monitoring tools, so our assumptions were not based only on published narratives. We spoke with a mix of manufacturers, channel partners, utilities and large industrial users across key regions, and then used their inputs to confirm adoption timing, typical replacement cycles, and the practical range of ASP movement by product family.
Distribution of primary research fieldwork respondents
| Company type | Respondent position | Region |
|---|---|---|
| Top tier: 29% | CXOs: 21% | APAC: 39% |
| Mid tier: 49% | Functional/Unit leaders: 20% | EMEA: 37% |
| Smaller Players: 22% | Managers: 59% | Americas: 24% |
Market-Sizing & Forecasting
Sizing began with a top-down build that reconstructs the addressable revenue pool from where power-quality stress is most visible, and where corrective spend is typically budgeted, and only then do totals get finalized. In practical terms, we anchored the model to electricity consumption growth and grid reliability focus areas, and then applied adoption and spend intensity assumptions across major end-user groups that commonly deploy these systems.
The main inputs used to shape the model included the pace of industrial load additions, renewables integration that increases voltage and harmonic volatility, data center and commercial critical-load expansion, typical correction needs linked to harmonic distortion and voltage sag events, and a realistic ASP progression by equipment category (including mix shifts toward monitoring and digital controls). After the top-line pool was formed, selective bottom-up checks were run using sampled supplier revenue cues, channel feedback on volumes, and ASP ranges to adjust any overstatement in early years. Where company disclosures were not cleanly attributable, revenue was allocated using product mix indications and interview-based split factors.
Forecasting used scenario analysis supported by expert consensus on how fast critical-load density and grid modernization spending will move, and then the scenarios were translated into a single base case that keeps growth rates consistent with observable electricity and infrastructure signals.
Data Validation & Update Cycle
Validation was done through multiple checkpoints so single-source bias did not dominate the final number. We compared model outputs against independent signals like electricity demand direction, public grid reliability initiatives, and the observed spread of adoption by end-user type shared in interviews, and then investigated any variance that looked out of line.
Before sign-off, assumptions and intermediate calculations were reviewed across analysts, followed by a final variance scan at region and equipment-family level. The report is refreshed annually, and interim updates are made when material events shift demand or pricing logic, such as major grid policy changes or a sharp move in industrial capex. Right before delivery, we perform a fresh pass to ensure the latest public releases and interview learnings are reflected.
Mordor Intelligence's Power Quality Equipment Market Size Versus Other Published Estimates
Published market values for power quality equipment can look far apart, and this usually happens because the boundary between monitoring, correction, and adjacent power equipment is treated differently by every publisher. Differences also show up when one estimate leans on broad electrical equipment totals, instead of tying the model to power-quality specific demand triggers.
Electricity reliability signals, end-user adoption checks from interviews, and product-level scope rules are the evidence that keeps Mordor Intelligence aligned to a repeatable demand pool, rather than counting nearby categories that do not directly address harmonics, voltage events, or power conditioning outcomes.
Benchmark comparison
| Source | Market Size | Gaps in Research Methodology |
|---|---|---|
| Mordor Intelligence | USD 20.30 B (2026) | |
| Industry Publication A | USD 33.23 B (2024) | This estimate appears to use a broader product set and an earlier base year, and it can also reflect different treatment of monitoring devices and grid-edge electronics that are not always purchased for corrective power quality use. |
| Newswire Brief B | USD 41.10 B (2024) | The gap is consistent with a wider definition that blends multiple power-conditioning and distribution-related equipment categories, plus differing currency timing and refresh cadence that can lift the stated 2024 value. |
The table shows that most of the spread is explained by scope and year alignment, rather than a disagreement on growth direction. By keeping inclusions tied to clear power-quality functions and validating adoption and ASP ranges with field inputs, the resulting market size stays transparent and easier to replicate when assumptions are updated.


Key Questions Answered in the Report
What is the current power quality equipment market size and projected growth?
The power quality equipment market size is USD 20.3 billion in 2026 and is forecast to reach USD 28.26 billion by 2031 at a 6.83% CAGR.
Which equipment category leads global revenues?
Uninterruptible Power Supply systems dominate with 37.18% market share in 2025, reflecting their central role in protecting digital infrastructure.
Which application area is expanding fastest?
EV fast-charging infrastructure is projected to grow at 9.08% CAGR between 2026 and 2031 as electric-vehicle adoption accelerates.
Why is Asia-Pacific the largest regional market?
Record grid investments in China and aggressive renewable build-outs in India push Asia-Pacific to 48.05% share and the highest 8.22% CAGR.
What major restraint could slow adoption?
High upfront costs of advanced solutions, especially STATCOMs and dynamic filters, limit near-term uptake among price-sensitive users.
How are vendors addressing the skills gap in power quality analysis?
Manufacturers have launched global training academies and certification programs to expand the pool of qualified engineers capable of deploying modern systems.
Page last updated on:


 Your data is secure and never sold or shared.


