
Power Generator Rental Market Size and Share
Market Overview
| Study Period | 2021 - 2031 |
|---|---|
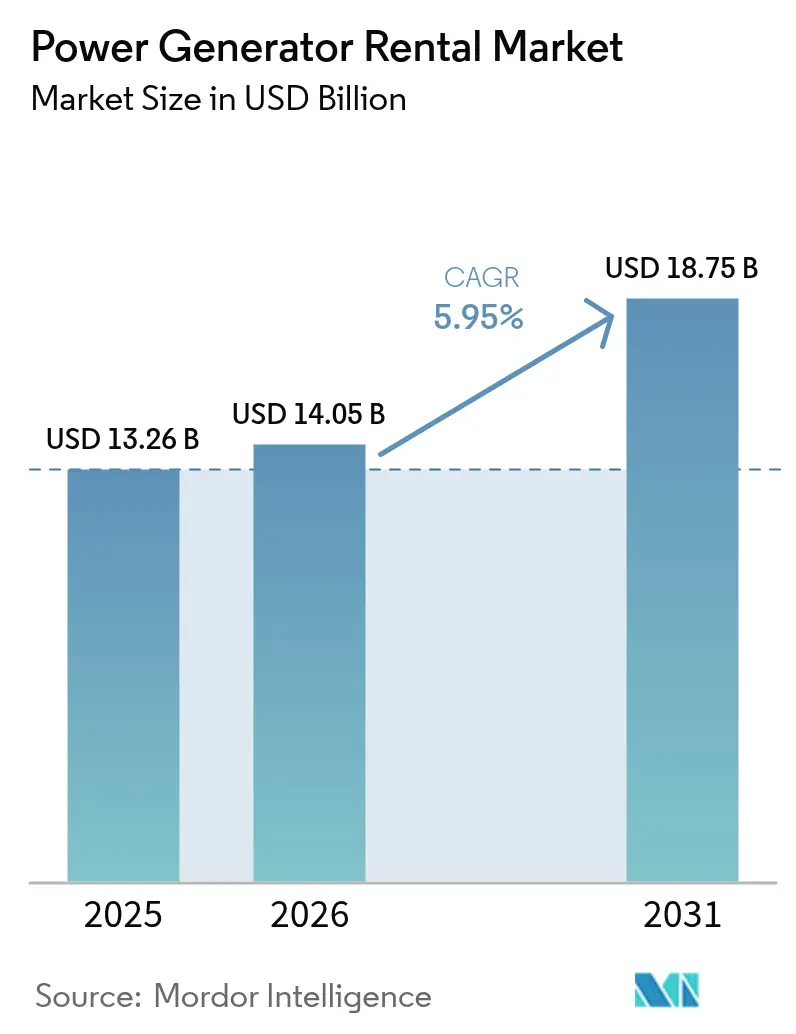
| Market Size (2026) | USD 14.05 Billion |
| Market Size (2031) | USD 18.75 Billion |
| Growth Rate (2026 - 2031) | 5.95 % |
| Fastest Growing Market | Asia Pacific |
| Largest Market | North America |
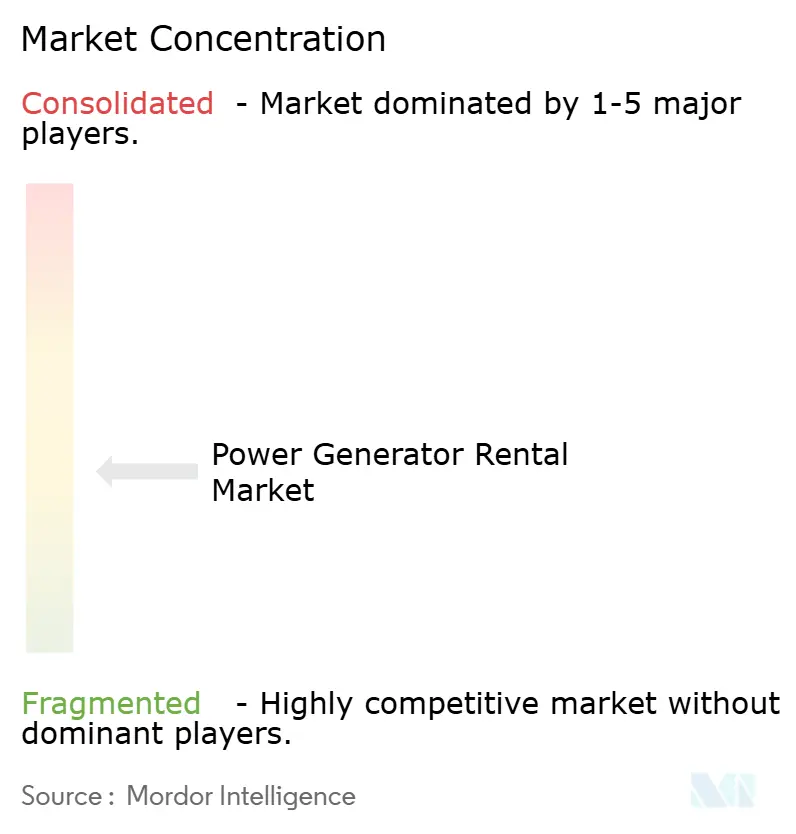
| Market Concentration | Medium |
Major Players *Disclaimer: Major Players sorted in no particular order Image © Mordor Intelligence. Reuse requires attribution under CC BY 4.0. | |
Power Generator Rental Market Analysis by Mordor Intelligence
Power Generator Rental Market size in 2026 is estimated at USD 14.05 billion, growing from 2025 value of USD 13.26 billion with 2031 projections showing USD 18.75 billion, growing at 5.95% CAGR over 2026-2031.
Demand is shifting from simple backup sets toward hybrid systems that merge diesel, battery storage, and renewable inputs, giving end-users intelligent load-balancing and carbon-reduction capabilities. Fleet rental remains a preferred strategy because it defers capital expenditure, aligns operating costs with project timelines, and provides immediate access to Stage V-compliant or Tier 4 Final-compliant machines when supply chains tighten. Data-center construction, rising outage frequency caused by climate-driven weather events, and large-scale infrastructure programs in the Asia-Pacific are the leading growth engines. Competitive intensity is rising as consolidating multinational lessors combine geographic reach with digital fleet-management platforms, while operators lacking hybrid offerings face margin pressure from volatile diesel prices and tightening emission rules.
Key Report Takeaways
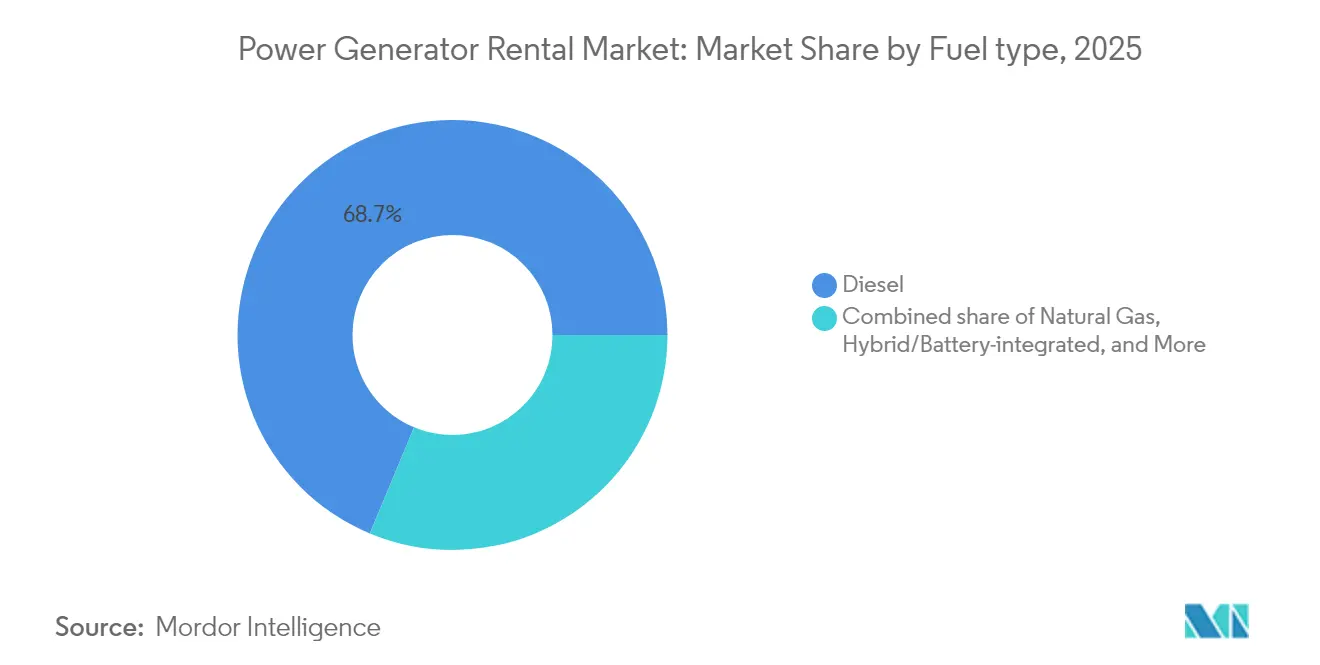
- By fuel type, diesel units held 68.72% of the power generator rental market share in 2025, while hybrid battery-integrated sets are projected to expand at a 9.35% CAGR through 2031.
- By power rating, 101–500 kVA units accounted for 38.12% of the power generator rental market size in 2025 and are forecast to grow at a 6.62% CAGR.
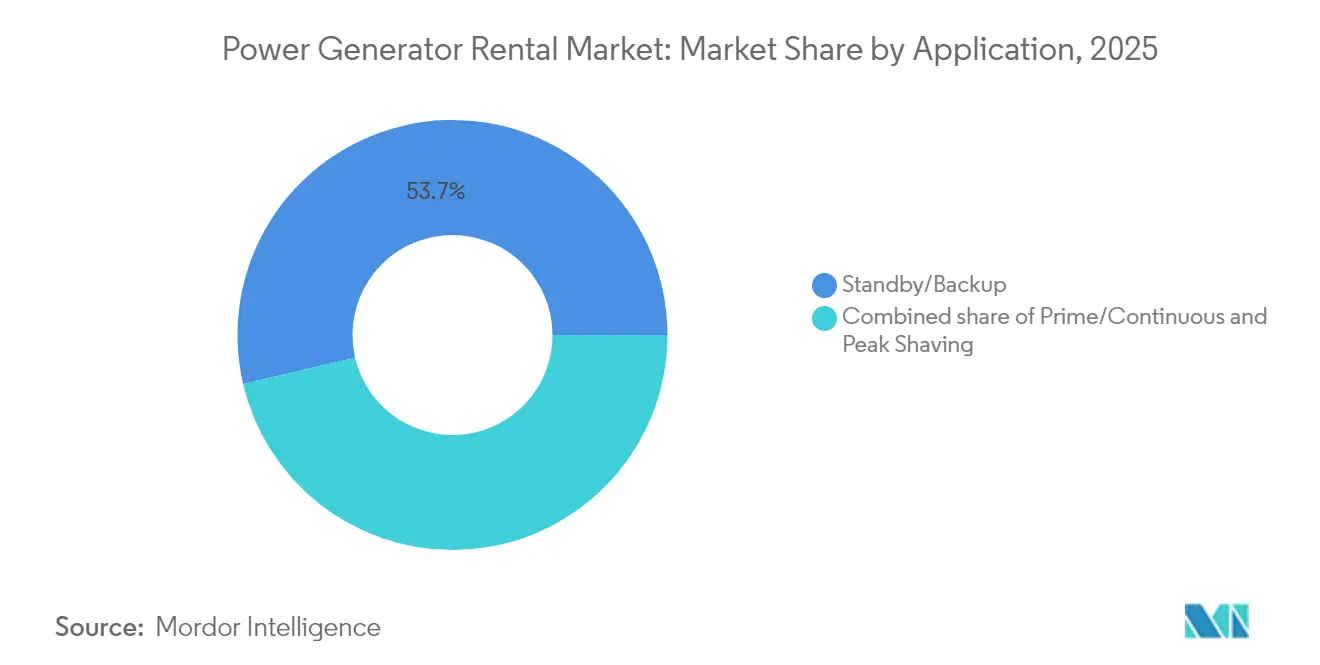
- By application, standby and backup solutions commanded 53.65% revenue share in 2025, whereas peak-shaving rentals are advancing at a 8.92% CAGR to 2031.
- By end user, construction led with 26.74% revenue share in 2025; data centers are set to record the highest 9.66% CAGR through 2031.
- By geography, Asia-Pacific captured a 32.48% share in 2025 and is forecast to grow at a market-leading 7.55% CAGR to 2031.
Note: Market size and forecast figures in this report are generated using Mordor Intelligence’s proprietary estimation framework, updated with the latest available data and insights as of 2026.
Global Power Generator Rental Market Trends and Insights
Drivers Impact Analysis*
| Driver | (~) % Impact on CAGR Forecast | Geographic Relevance | Impact Timeline |
|---|---|---|---|
| Aging grid infrastructure & outage frequency | +1.80% | Global, particularly North America & Europe | Medium term (2-4 years) |
| Infrastructure & construction boom in emerging economies | +1.20% | APAC core, spill-over to MEA | Long term (≥ 4 years) |
| Data-center capacity expansion & power-delay constraints | +0.90% | Global, concentrated in APAC & North America | Short term (≤ 2 years) |
| Oil & gas field maintenance / shutdown activities | +0.70% | Global, particularly Middle East, North America, North Sea | Medium term (2-4 years) |
| Hybrid solar-battery-diesel rental packages for micro-grids | +0.60% | Global, early adoption in Australia, California, Germany | Long term (≥ 4 years) |
| Pilot adoption of hydrogen-fueled rental generators | +0.50% | Europe & Japan leading, North America following | Long term (≥ 4 years) |
| Source: Mordor Intelligence | |||
Aging Grid Infrastructure & Outage Frequency
Utility assets in the United States and Western Europe average more than four decades in service, increasing vulnerability to severe weather-related outages that already account for nearly 80% of major service disruptions.(1)Source: T&D World Staff, “Storm Resilience Investments Accelerate,” tdworld.comPlanned hardening programs often require extended feeder shutdowns, during which mobile sets maintain customer supply and support crews working on energized sections. Rental demand intensifies when storms exceed restoration resources and utilities dispatch fleets of trailer-mounted gen-sets to hospitals, telecom towers, and community shelters. Predictive analytics adopted by grid operators shorten maintenance intervals, paradoxically increasing the frequency of scheduled outages and sustaining rental call-outs. The flexibility to scale power up or down without owning fixed assets positions the power generator rental market as a core resilience tool for utilities, strengthening transmission and distribution infrastructure.
Infrastructure & Construction Boom in Emerging Economies
A surge in sovereign and multilateral spending—illustrated by the USD 1.2 trillion Infrastructure Investment and Jobs Act and parallel megaproject pipelines across India, Indonesia, and Saudi Arabia—creates thousands of active job sites lacking stable grid access.(2)Source: American Rental Association, “2025 Rental Market Forecast,” ararental.org Construction firms prefer rentals to circumvent upfront equipment costs and to match power capacity with evolving site loads as projects move from earthwork to fit-out phases. Urbanization remains rapid; Asia-Pacific cities will add more than 90 million residents by 2030, accelerating demand for roads, metros, and wastewater plants that consume temporary electricity at each build stage. Beyond capital flexibility, renting allows contractors to comply instantly with local emission limits by swapping older engines for Stage V-rated models when authorities tighten air-quality rules. These factors will keep the power generator rental market on a steep growth curve in emerging zones over the long term.
Data-Center Capacity Expansion & Power-Delay Constraints
Hyperscale operators brought 2,996 MW of new capacity online in Asia-Pacific during Q1 2024, yet dozens of additional campuses await grid connections that can be delayed 18–36 months in congested corridors such as Sydney and Osaka. Bridge-power packages configured with diesel prime units plus battery storage allow commissioning to proceed while utilities upgrade substations. Electrical hardware represents roughly one-quarter of total data-center capex, and every month of delay can erode contracted colocation revenue; rental power bridges that gap and keeps projects on schedule. Requirements for concurrent maintainability and N+1 redundancy favor multi-module fleets in the 101–500 kVA range, which can be paralleled for load-following and load-shedding. Edge-computing nodes proliferating near 5G networks rely on containerized rentals that can be redeployed as latency hot-spots shift. Consequently, data-center growth directly underpins substantial incremental revenue entering the power generator rental market.
Oil & Gas Field Maintenance / Shutdown Activities
Downstream refiners, midstream pipelines, and offshore platforms operate under strict turnaround schedules lasting 20–60 days, during which permanent turbines are offline and portable units take over essential loads. Aggreko’s sector-specific service lines illustrate how diesel, LNG, and CNG gen-sets are tailored with explosion-proof enclosures and remote telemetry for hazardous zones. Rental power mitigates lost production by supporting electric pumps, emergency lighting, and accommodation barges at short notice. Mobility is critical because assets are frequently stationed hundreds of kilometers offshore or across arid deserts where grid access is nonexistent. Interest in mobile offshore wind and hybrid solar-battery-diesel microgrids is rising, which can trim fuel costs by more than 60% during planned outages. Heightened maintenance frequencies designed to maximize asset utilization will continue to feed rental demand in hydrocarbon basins worldwide.
Restraints Impact Analysis*
| Restraint | (~) % Impact on CAGR Forecast | Geographic Relevance | Impact Timeline |
|---|---|---|---|
| Battery energy-storage substitution | -0.80% | Global, accelerated in California, Germany, Australia | Short term (≤ 2 years) |
| Volatile diesel prices & rising carbon taxes | -0.60% | Global, particularly Europe with carbon pricing | Medium term (2-4 years) |
| Tier-4 Final engine supply shortages | -0.40% | North America & Europe primarily | Short term (≤ 2 years) |
| Shift to gas-turbine micro-grid rentals | -0.30% | Developed markets with gas infrastructure | Long term (≥ 4 years) |
| Source: Mordor Intelligence | |||
Battery Energy-Storage Substitution
Lithium-ion system costs have fallen 80% since 2013, allowing commercial sites to deploy 1–4 hour batteries that shave peak tariffs and supply zero-emission backup power. Modeling indicates that integrating battery storage with onsite solar can reduce diesel runtime by up to 80% in hybrid microgrids serving festivals, film sets, or telecom towers. In Brazil, microgrid owners cut annual electricity bills by 33% when batteries displaced gen-sets during peak-rate windows. Regulatory incentives such as California’s SGIP rebates accelerate adoption, squeezing short-duration rental hours in markets where silent, quick-response batteries satisfy reliability criteria. Nevertheless, batteries struggle to carry multi-day outages caused by hurricanes or transmission faults, which highlights a critical need for rental engines that can run indefinitely when refueled.
Volatile Diesel Prices & Rising Carbon Taxes
Distillate inventories remain thin across OECD nations, and the U.S. Energy Information Administration warns of fresh price spikes each hurricane season.(3)Source: Transport Topics, “Diesel Price Outlook 2024,” transporttopics.com Since rental contracts often exclude fuel, price jumps can force customers to curtail usage or negotiate rate adjustments, dampening utilization hours. Meanwhile, jurisdictions like Canada have fixed CO₂ thresholds at 65 t per GWh for 2035–2049, escalating to net-zero thereafter, compelling renters to absorb the cost of offset credits or transition toward renewable diesel blends. European carbon-pricing schemes add administrative complexity and can erode returns on long-term fleet investments. Hybrid sets, HVO fuel, and gas-powered engines partially insulate operators but may raise capital costs. Collectively, these factors shave growth points off the power generator rental market by discouraging extended diesel-only deployments in regulated regions.
*Our forecasts treat driver/restraint impacts as directional, not additive. The impact forecasts reflect baseline growth, mix effects, and variable interactions.
Segment Analysis
By Fuel Type: Hybrid Integration Disrupts Diesel Dominance
Diesel continued leading the power generator rental market with a USD 9.11 billion value in 2025; its extensive refueling infrastructure and proven reliability underpin 68.72% share. Yet hybrid battery-diesel packages are registering the fastest 9.35% CAGR to 2031 as renters chase fuel savings, lower noise, and immediate compliance with Stage V limits. Operators confirm that intelligent controllers can idle engines and let batteries shoulder variable loads, cutting consumption up to 80% and extending service intervals. Natural-gas units hold steady in municipalities with pipeline networks and stricter particulate regulations, while hydrogen pilots in Germany and Japan show early promise for zero-carbon festivals and event power.
Competitive positioning is shifting: United Rentals’ EHR Solar Battery Generator marries a 5 kW PV canopy, 45 kVA propane unit, and lithium pack into a containerized microgrid suited for ultra-low-noise urban refurbishments. Atlas Copco, Cummins, and Aggreko now bundle batteries across 10–100 kVA frames as standard. Hydrogen remains niche, but European subsidies fund field tests where PEM stacks replace diesel sets for remote telecom towers. Over the forecast horizon, hybrid deployments will erode diesel’s hold, though absolute diesel demand will still rise in megawatt-scale mines and refineries where battery economics remain challenging.


By Power Rating: Mid-Range Dominance Reflects Optimal Scalability
Units rated 101–500 kVA generated USD 5.06 billion in 2025, equal to a 38.12% share of the power generator rental market and poised for a 6.62% CAGR as customers favor their load-matching versatility. A single 250 kVA set can energize tower cranes, batch plants, or edge data halls, yet remains towable by standard trucks, minimizing logistics costs. Below-100 kVA rentals address mobile clinics and retail outlets but face competition from battery packs in noise-sensitive districts.
Demand for 501–1,000 kVA machines concentrates in petrochemical shutdowns and mega-events requiring aggregated capacity. Above-1 MVA packages, frequently containerized and parallellable, serve utility grid-support roles during transformer replacements. Rental fleets increasingly deploy clusters of mid-range units instead of single high-capacity frames, boosting redundancy and letting operators service equipment without a full site outage. Stage V engine introductions with SCR and DPF modules add cost; therefore, standardized mid-range blocks deliver economies of scale in procurement, maintenance, and telematics integration that underpin their ongoing leadership.
By Application: Peak-Shaving Emerges as Growth Engine
Standby and backup services still dominated the power generator rental market share at 53.65 % in 2025 as hospitals, banks, and manufacturing lines demand assured uptime during grid failures. However, demand-response programs from utilities in Brazil, Australia, and several U.S. ISOs are catalyzing a 8.92% CAGR for peak-shaving packages through 2031. These deployments dispatch gen-sets during high-tariff windows, capturing incentive payments and lowering site energy bills.
Prime and continuous rentals remain vital for remote mines, refugee camps, and island resorts, where poor grid reach makes diesel or gas engines the sole electricity source. Yet, even in prime power scenarios, hybridization is advancing; an LNG-diesel mix can drop fuel costs 25%, while onboard batteries curb nighttime noise for workforce accommodation camps. As smart meters proliferate, more industrial users will leverage peak-shaving rentals as a financial hedging tool, reinforcing the transition from mere contingency supply to proactive energy-cost optimization within the broader power generator rental market.
By End User: Data Centers Drive Transformation
Construction sites accounted for USD 3.55 billion of the power generator rental market size in 2025, equal to a 26.74% share, as high-rise, transit corridor, and industrial park developments remain power-intensive during early phases. Data centers, however, represent the fastest 9.66% CAGR segment, accelerating off the 2025 base of USD 1.58 billion amid surging AI workloads projected to raise U.S. data-center electricity use from 2% to 4% of national demand by 2030.
Oil and gas operators preserve steady spending, drawing on portable LNG, CNG, and diesel sets for pipeline hydrotests, offshore maintenance, and gas-processing turnarounds. Mining companies in sub-Saharan Africa continue renting multi-megawatt clusters that can be dismantled when ore bodies deplete, avoiding stranded assets. Manufacturing plants, film studios, and temporary healthcare facilities round out diversified demand, proving the wide sectoral relevance of rental power even as hyperscalers dominate headline growth.
Geography Analysis
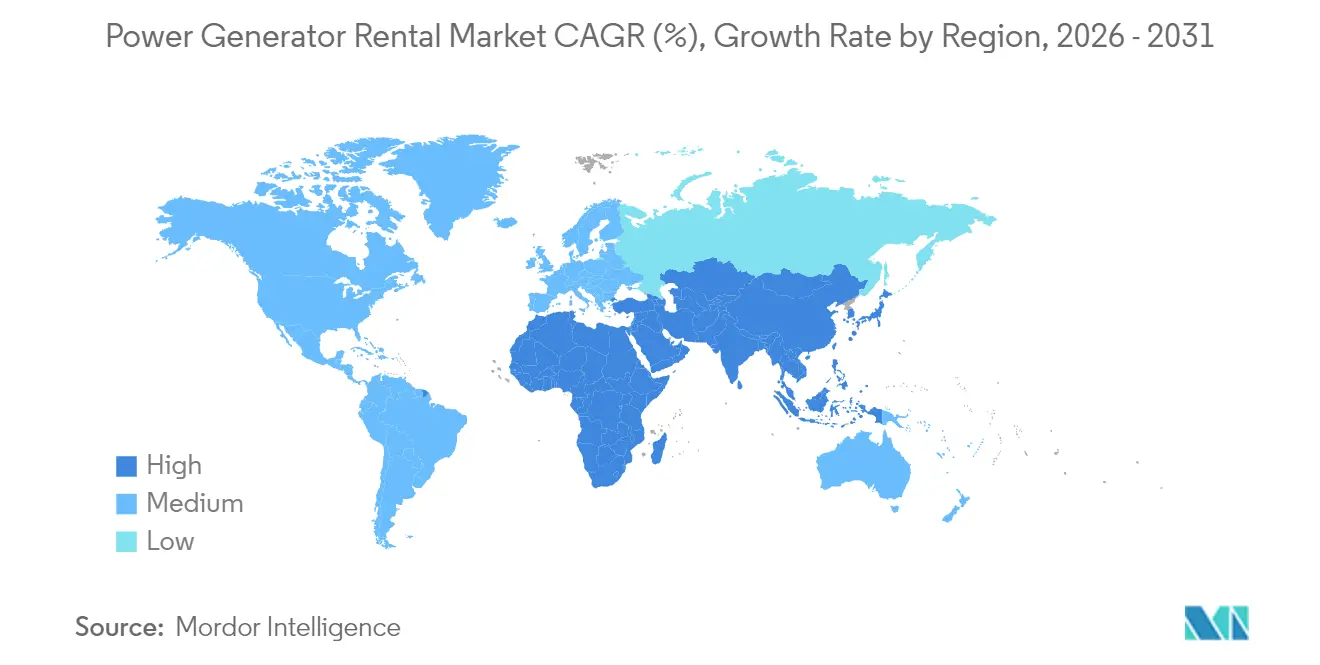
Asia-Pacific retained the largest regional stake in 2025, with USD 4.31 billion revenue translating into 32.48% of the power generator rental market share. Storm-damaged Philippine grids, India’s Smart Cities program, and Indonesia’s new capital construction funnel ongoing orders for trailer-mounted units, while regional hyperscale capacity added 2.996 MW in Q1 2024 alone. Hybrid rentals gain impetus in Australia, where subsidy schemes reward PV-battery-diesel microgrids on remote mine leases.
North America ranked second at USD 4.12 billion in 2025, and grid-hardening budgets combined with wildfire contingencies in California and Texas will underpin mid-single-digit growth. Stage 5/Tier 4 compliance is already baked into most rental fleets, allowing premium pricing for low-NOx inventory. Europe follows closely, with energy-price volatility since 2022 spurring factories to secure short-term rentals for peak-load shaving and emergency coverage. Emission-linked regulations, including non-road mobile machinery rules, create a replacement pulse favoring modern rental fleets over owned legacy stock.
South America, plus the Middle East & Africa, accounted for less than 15% of 2024 turnover but exhibits double-digit potential tied to resource extraction, petrochemical expansions, and national grid extensions. Brazilian peak-shaving incentives, Qatar’s LNG maintenance cycles, and Nigeria’s data-localization law all provide catalysts for rentals over outright purchase, hinting at accelerating uptake of hybrid and gas-fired sets as the decade advances.

Regulatory Landscape
Emission and conformity requirements for rental fleets are shaped by non-road rules in major regions. In Europe, Regulation (EU) 2016/1628 (NRMM) makes Stage V compliance the baseline for generator sets placed on the market, pushing rental operators toward newer, type-approved engines and aftertreatment configurations.
In the United States, EPA nonroad diesel engine standards (Tier 4 Final under 40 CFR Part 1039) cover towable and mobile rental generators, while stationary deployments typically require separate state and local air-permitting pathways. That dynamic increases the importance of correctly classifying equipment and maintaining compliance documentation. India also tightens product compliance with mandatory BIS certification for diesel generators under HS codes 8502 and 8503, effective September 1, 2026, which raises the value of certified inventory and compliant supply chains for rental and trading channels. In Nigeria, SONCAP remains a mandatory pre-shipment certification program for diesel generators, shaping procurement timing and lead times for rental firms and project contractors operating in the country.
Competitive Landscape
Consolidation has tightened leadership: United Rentals’ USD 4.8 billion acquisition of H&E Rentals added 64,000 fleet units and 160 branches, delivering an organization that can negotiate better engine deals, spread telematics overheads, and leverage cross-selling to industrial accounts. Ashtead Group, Aggreko, and Herc Holdings continue bolt-on buys to deepen geographic density and specialized offerings like temperature-control or battery storage. The market thus skews toward operators capable of simultaneous national deployments and integrated digital fleet management.
Technology still differentiates. United Rentals, Aggreko, and Atlas Copco release proprietary energy-storage platforms that integrate seamlessly with diesel and gas gen-sets, using AI-driven controllers to optimize dispatch. Manufacturers Generac, Cummins, and Wärtsilä court rental firms through factory-installed telematics, Stage V readiness, and fuel-flexible engines that can run on HVO or hydrogen blends. Players lacking hybrid or data-analytic capabilities struggle to match service-level agreements demanded by hyperscale clients and utilities.
Niche specialists remain, targeting micro-grid engineering or festival power with ultra-silent Stage V sets. Private-equity backed entrants such as Powering Srl, recently acquired by Arcus Infrastructure Partners, are scaling regionally by focusing on renewable-heavy micro-grids and peak-shaving-as-a-service. Competitive intensity is expected to sharpen as OEMs push direct-to-rental business models and as carbon-pricing compels fleets to upgrade sooner, reinforcing barriers to small, undercapitalized rivals.
Power Generator Rental Industry Leaders
Atlas Copco (India) Ltd
Herc Rentals Inc.
Cummins Inc.
Ashtead Group PLC
United Rentals Inc.
- *Disclaimer: Major Players sorted in no particular order

Market Opportunities and Future Outlook
Data center power constraints and behind-the-meter buildouts are creating whitespace for rental and rapidly deployable generation packages that combine delivery speed with compliance and monitoring. In July 2026, Kodiak Gas Services and Baker Hughes announced a multi-year agreement covering deployment of up to 1.8 GW of power generation capacity, including an initial award of about 1 GW of gas turbines and generators, explicitly linked to U.S. data center growth. This reinforces demand for modular, mission-critical power blocks that can complement rental fleets with longer-duration or prime-power solutions. A similar pattern is visible in July 2026, when Williams secured USD 5.34 billion of committed capital to develop five behind-the-meter power facilities in Ohio totaling about 2.6 GW, pointing to growing customer preference for non-utility pathways when grid interconnection timelines are tight.
On the product and service side, tightening on-site emissions constraints and fuel-cost volatility are creating room for rental providers to bundle hybrid diesel-battery systems, telematics, and fuel management into a single SLA-driven offer, rather than selling runtime alone. The shift toward Stage V and EPA Tier 4 Final-compliant fleets also raises utilization for providers that can swap compliant units quickly across urban construction, utility hardening work, and data-center commissioning. Pilot adoption of alternative fuels (natural gas and early hydrogen trials referenced in the market scope) provides an additional differentiation path for customers that prioritize lower local emissions, longer refueling intervals, or quieter operation.
Recent Industry Developments
- June 2026: Cummins expanded its high-horsepower generator portfolio to 50Hz markets using the QSK78 engine platform, scaling offerings up to 3,500 kVA for mission-critical and data center applications. The change broadens availability of high-capacity sets used in rental, temporary prime power, and bridge-power scenarios where large loads must be met quickly across multiple geographies.
- July 2025: Rolls-Royce committed USD 75 million to expand MTU engine manufacturing in Aiken, South Carolina, to increase Series 4000 production tied to rising data center prime power demand. Added engine output supports OEM and rental-channel availability for higher-duty-cycle applications where lead times and compliance-ready inventory are competitive levers.
- January 2024: Hyperscale operators added 2,996 MW of new data center capacity in Asia-Pacific, while many additional campuses faced grid-connection delays of 18 to 36 months in corridors such as Sydney and Osaka. These commissioning bottlenecks increased the use of temporary and bridge power packages, including paralleled mid-range generator fleets and hybrid configurations that keep construction and commissioning schedules moving.


Research Methodology Framework and Report Scope
Market Definition and Coverage
This market covers revenue earned from renting power generators that supply temporary electricity for planned or unplanned needs, where equipment is provided for a defined duration and returned after use. It includes the common rental setups used at sites that cannot fully rely on grid power.
Scope exclusions: We exclude outright sales of generator sets and permanent installed power systems, and we also exclude utility grid equipment that is not rented as a generator solution.
Segmentation Overview
- By Fuel Type
- Diesel
- Natural Gas
- Hybrid/Battery-integrated
- Hydrogen & Others
- By Power Rating
- Below 100 kVA
- 101 to 500 kVA
- 501 to 1,000 kVA
- Above 1,000 kVA
- By Application
- Standby/Backup
- Prime/Continuous
- Peak Shaving
- By End User
- Construction
- Oil and Gas
- Mining
- Manufacturing
- Data Centers
- Others
- By Geography
- North America
- United States
- Canada
- Mexico
- Europe
- Germany
- United Kingdom
- France
- Italy
- Russia
- Rest of Europe
- Asia-Pacific
- China
- India
- Japan
- South Korea
- ASEAN Countries
- Rest of Asia-Pacific
- South America
- Brazil
- Argentina
- Rest of South America
- Middle East and Africa
- Saudi Arabia
- United Arab Emirates
- South Africa
- Rest of Middle East and Africa
- North America
Data Sources, Market Sizing, and Validation
Desk Research
Desk work starts with building a fact base for where rental demand comes from and how fleets typically get used across regions. We referred to public sources such as the International Energy Agency (power access and reliability context), the World Bank (infrastructure indicators), and the US Energy Information Administration (fuel and power market direction).
To keep assumptions grounded, we also used sources such as the US Census Bureau construction spending series, UN Comtrade for trade flow direction on generator-related equipment, and published material from trade associations that track construction, mining, and industrial activity. Company filings, investor presentations, and reputable press were reviewed to map service footprints and typical contract structures, and then cross-checked with a paid subscription we use for company financials and another for shipment-level trade intelligence, where it helped clarify import reliance in some markets. These are illustrative sources and not exhaustive, since many other public documents were also used for data collection, validation, and clarification.
Primary Interviews and Surveys
Primary work focused on validating what gets rented, for how long, and under what pricing logic across construction, oil and gas, mining, manufacturing sites, and data center-related use cases. We spoke with a mix of rental fleet operators, equipment distributors, EPC contractors, and large end users across APAC, EMEA, and the Americas, so demand signals and utilization assumptions could be confirmed and adjusted when desk inputs were too broad.
Distribution of primary research fieldwork respondents
| Company type | Respondent position | Region |
|---|---|---|
| Top tier: 27% | CXOs: 14% | APAC: 47% |
| Mid tier: 51% | Functional/Unit leaders: 34% | EMEA: 30% |
| Smaller Players: 22% | Managers: 52% | Americas: 23% |
Market-Sizing & Forecasting
Sizing begins with a top-down build that reconstructs rental demand from end market activity, and then allocates it into generator rental use based on typical backup and prime power requirements across industries and regions. That structure is then stress-tested with selective bottom-up checks, where sampled fleet sizes, utilization ranges, and rental rate bands are used to see if the implied revenue fits realistic operating outcomes.
Key inputs used in the model include construction and infrastructure project activity, the frequency and duration of grid outages that trigger standby rental, fuel price direction that impacts diesel and gas rental choices, data center commissioning and testing cycles that pull temporary power, and the mix of applications such as standby, prime, and peak shaving, which changes run-hours and pricing. When local data was thin, gaps were handled by using regional proxy ratios, for example similar construction intensity and electrification profiles, and then narrowing the range through interview feedback.
Forecasting is done using scenario analysis, since demand can change quickly with infrastructure award cycles, weather events, and industrial shutdown schedules. The base case trend is anchored to macro indicators and sector activity, and the final trajectory is adjusted after primary feedback on expected utilization, pricing pass-through, and fleet expansion plans.
Data Validation & Update Cycle
Validation is done by triangulating the final totals against independent signals such as construction spending direction, industrial output trends, and observed movement in rental rates reported by market participants. Outliers are flagged when implied utilization or revenue per unit moves outside typical ranges, and those cells are reviewed again before numbers are signed off.
A second analyst review is applied to the model logic, assumptions, and calculations so any changes are explainable and consistent across regions. Reports are refreshed annually, and interim updates are made when material events occur, such as sharp fuel price shifts, major infrastructure slowdowns, or policy changes that affect diesel use. Before delivery, a final freshness check is completed so the latest public data and expert feedback are reflected in the published view.
Mordor Intelligence's Power Generator Rental Market Size Compared Against Other Published Estimates
Published market sizes for generator rental often do not align, even when they appear to describe the same activity. The main reasons usually come down to what is counted as rental revenue, what geographies are covered, and whether the estimate is anchored to activity indicators or primarily based on a broader revenue pool.
In this market, the spread is commonly driven by whether studies include wider temporary power packages, such as transformers, cables, load banks, and turnkey power plant rentals, how standby versus prime applications are converted into run-hours and pricing, and how currency timing is handled when fleets operate across countries. Counting generator-only rental revenue and keeping application-level utilization checks explicit, rather than bundling adjacent rental power services, is a key reason the 2026 figure comes out higher here than some older base-year estimates. This modeling choice is applied by Mordor Intelligence.
Benchmark comparison
| Source | Market Size | Gaps in Research Methodology |
|---|---|---|
| Mordor Intelligence | USD 14.05 B (2026) | |
| Global Consultancy A | USD 8.49 B (2024) | Uses an earlier base year and a broader power rental framing that can bundle non-generator equipment and turnkey temporary power plant services, which shifts the comparable revenue pool and timing. |
| Industry Research Group B | USD 8.50 B (2026) | Often anchored to narrower generator rental definitions and conservative utilization assumptions across standby use cases, with limited visibility on application mix shifts such as data center testing and peak shaving. |
Looking across the table, the biggest difference is not only the year used, but also what is treated as in-scope rental revenue and how utilization is converted into dollars. By keeping the demand drivers tied to construction activity, outage-driven standby needs, and application mix checks, the final number stays traceable to clear inputs and repeatable steps.


Key Questions Answered in the Report
What is the current value of the power generator rental market?
The power generator rental market size reached USD 14.05 billion in 2026 and is projected to hit USD 18.75 billion by 2031 at 5.95% CAGR.
Which region leads revenue generation?
Asia-Pacific captured 32.48% of global revenue in 2025 and is also the fastest-growing region at 7.55% CAGR.
Why are hybrid generator-battery rentals gaining popularity?
Hybrid sets cut diesel consumption up to 80%, lower emissions, and help renters comply with Stage V and Tier 4 Final rules, boosting demand especially in urban and data-center projects.
What end-user sector is expanding fastest?
Data centers are forecast to grow rental spending at 9.66% CAGR because grid-connection delays and AI-driven power densities require fast, flexible bridge power.
How will carbon taxes affect generator rentals?
Tighter carbon-pricing schemes increase fuel costs for diesel units, encouraging rental fleets to adopt HVO, natural-gas, and hybrid solutions to protect margins and meet customer sustainability targets.
Are battery energy-storage systems replacing rental gen-sets?
Batteries displace some short-duration loads, particularly peak-shaving in regulated markets, but multi-day outage resilience still depends on conventional or hybrid generator rentals.
Page last updated on:


 Your data is secure and never sold or shared.


