
Power Bank Market Size and Share
Market Overview
| Study Period | 2020 - 2031 |
|---|---|
| Market Size (2026) | USD 21.72 Billion |
| Market Size (2031) | USD 31.97 Billion |
| Growth Rate (2026 - 2031) | 8.04 % |
| Fastest Growing Market | Africa |
| Largest Market | Asia Pacific |
| Market Concentration | Medium |
Major Players *Disclaimer: Major Players sorted in no particular order Image © Mordor Intelligence. Reuse requires attribution under CC BY 4.0. | |
Power Bank Market Analysis by Mordor Intelligence
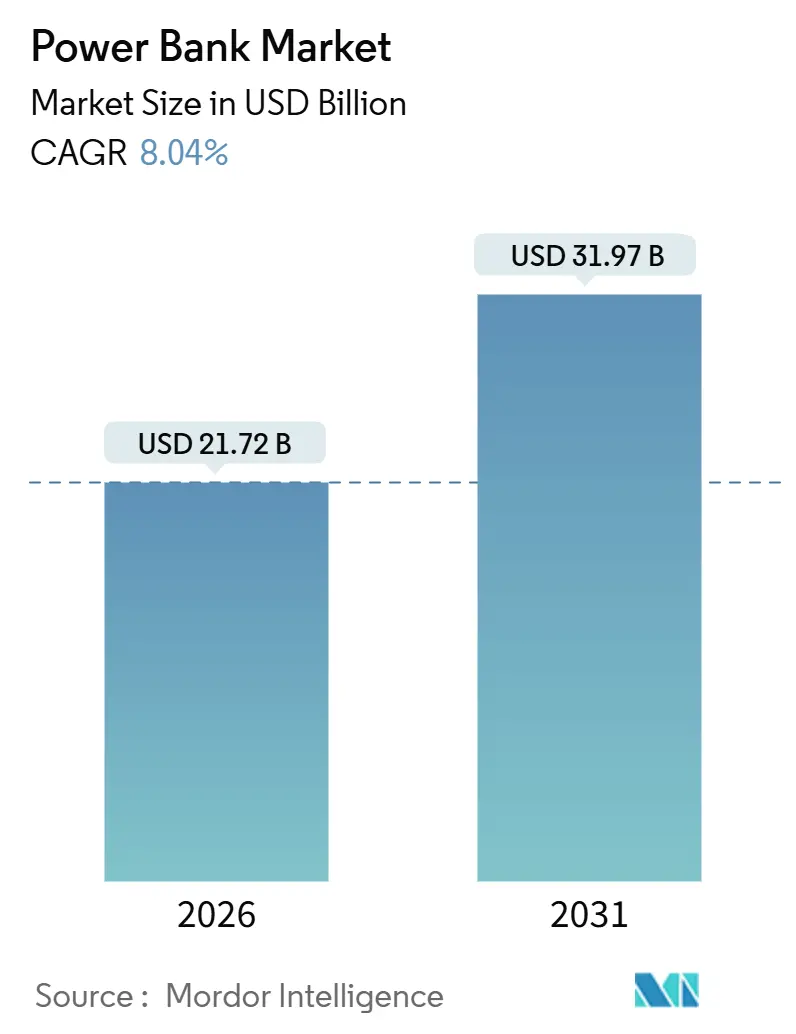
The power bank market size stood at USD 21.72 billion in 2026 and is projected to reach USD 31.97 billion by 2031, advancing at an 8.04% CAGR over the period. Consistent growth reflects surging adoption of 5G-enabled smartphones that draw 20% more power than 4G devices, rising laptop shipments that now expect USB-C Power Delivery outputs above 100 W, and the worldwide expansion of rental-kiosk networks inside airports and train stations that monetize on-the-go charging needs. Premium wireless units certified under the Qi2 standard deliver 15 W magnetic charging to the iPhone 16 family, doubling legacy Qi1 speeds and enabling 30% to 40% premium retail prices over wired-only models. Gallium nitride (GaN) chipsets embedded in flagship models let a 20,000 mAh pack refill in under 90 minutes through a 65 W USB-C input, aligning with consumer expectations that pocket-sized devices can power laptops as well as phones.
Key Report Takeaways
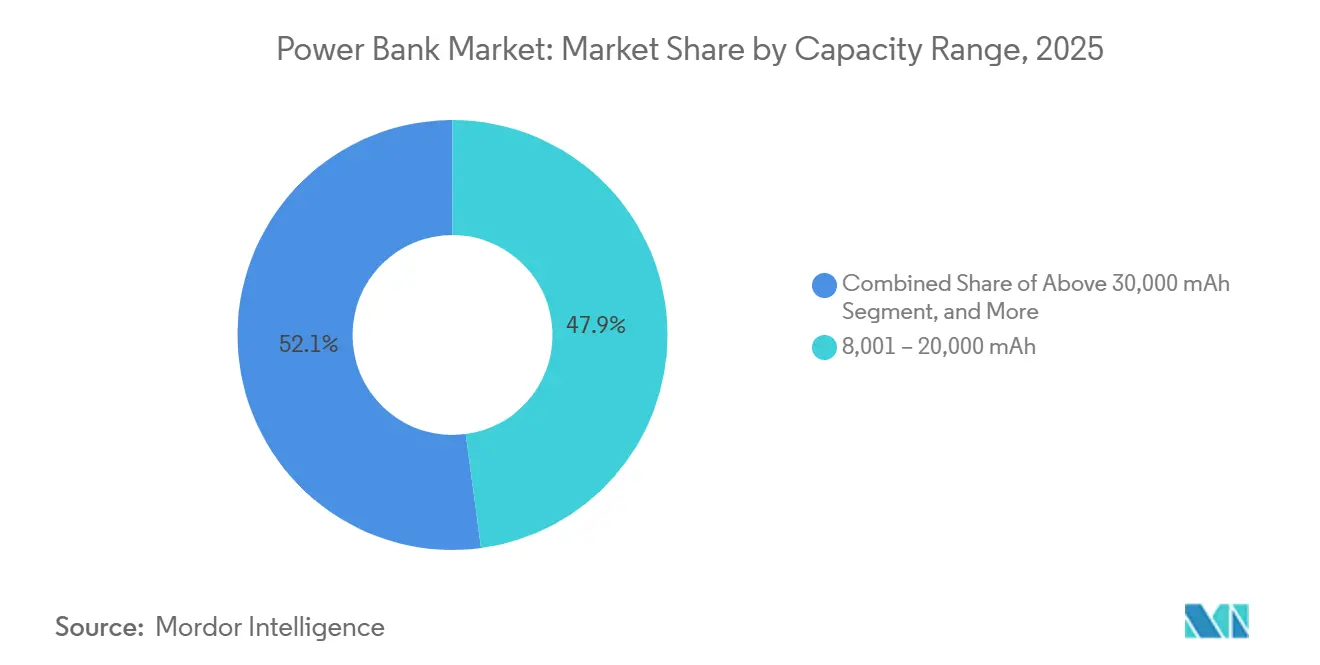
- By capacity range, the 8,001–20,000 mAh tier held 47.89% of the power bank market share in 2025, while units above 30,000 mAh are forecast to expand at 9.21% CAGR through 2031.
- By charging technology, wired models retained 82.17% of the revenue share in 2025, whereas wireless alternatives are projected to grow at an 8.47% CAGR to 2031.
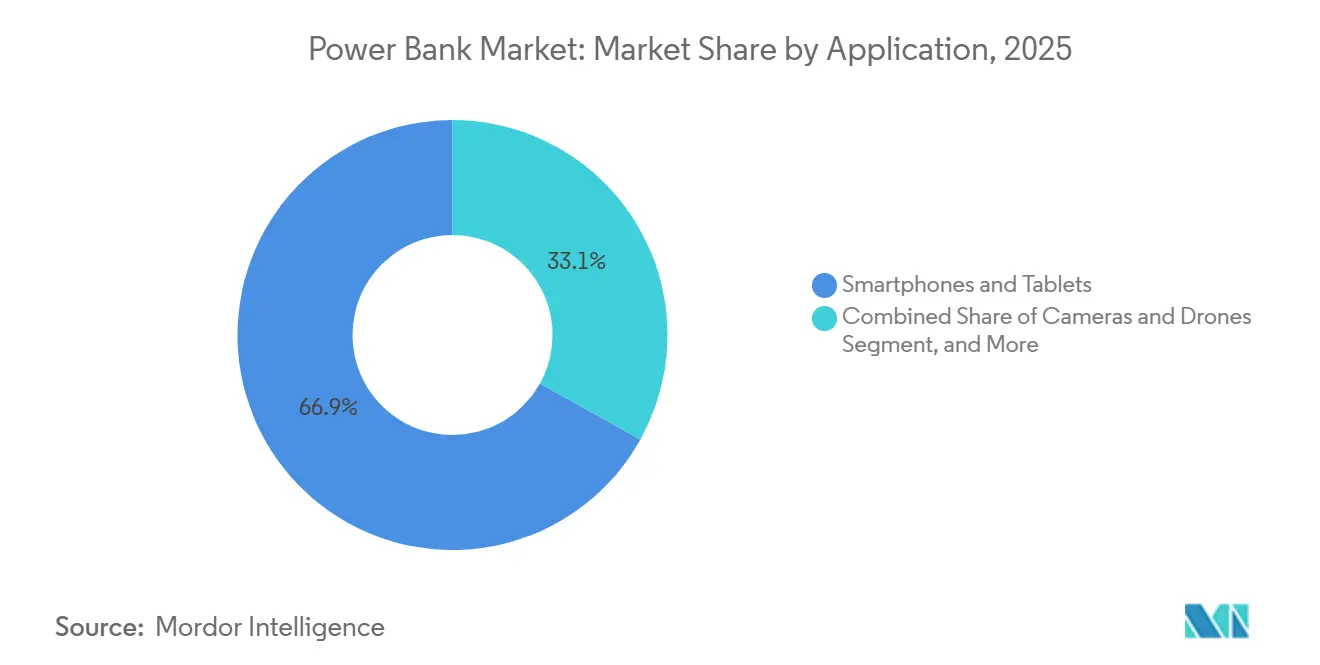
- By application, smartphones and tablets accounted for 66.92% of demand in 2025; cameras and drones are set to post the fastest 9.16% CAGR.
- By distribution channel, online platforms captured 62.19% of the market in 2025 and are expected to grow at an 8.43% CAGR, outpacing offline outlets.
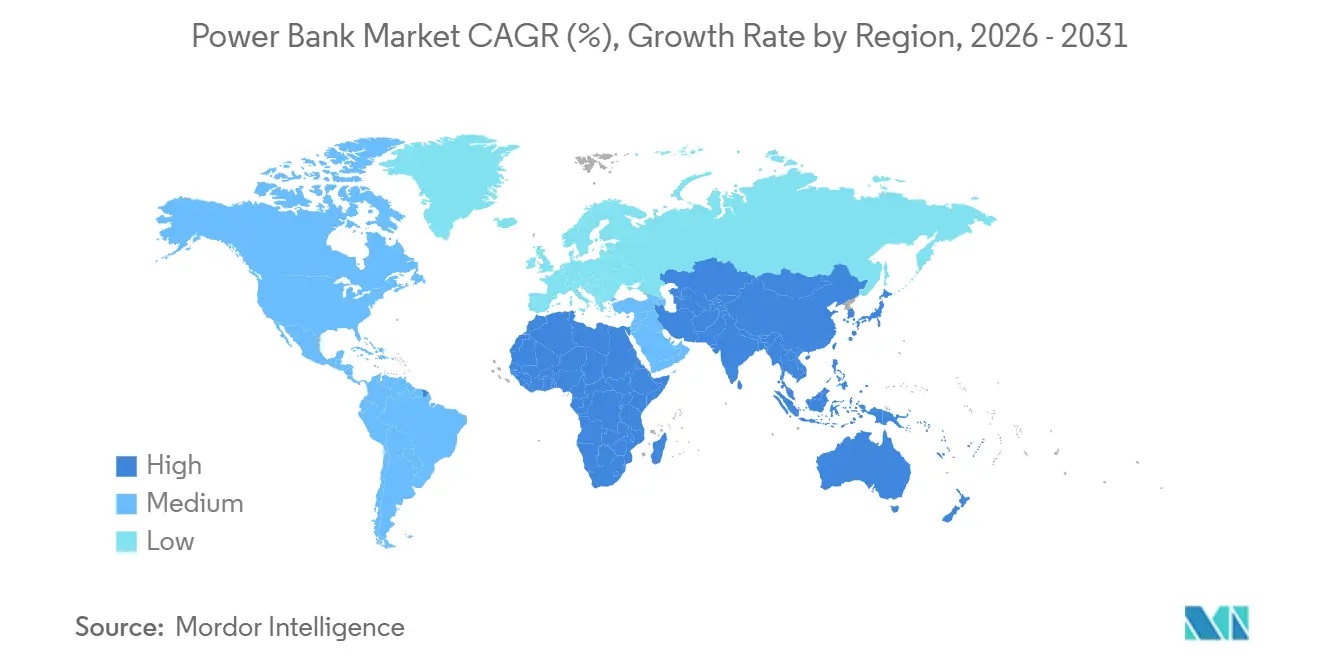
- By geography, Asia-Pacific accounted for 56.12% of 2025 revenue, while Africa is anticipated to register the highest CAGR of 9.11% through 2031.
Note: Market size and forecast figures in this report are generated using Mordor Intelligence’s proprietary estimation framework, updated with the latest available data and insights as of January 2026.
Market Trends and Insights
Drivers Impact Analysis of Power Bank Market*
| Driver | (~) % Impact on CAGR Forecast | Geographic Relevance | Impact Timeline |
|---|---|---|---|
| Surging Penetration of 5G-Enabled Smartphones | +1.8% | Global, with peak adoption in North America, China, South Korea, and Japan | Medium term (2-4 years) |
| Expanding E-Commerce for Consumer Electronics | +1.4% | Global, strongest in Asia-Pacific and North America | Short term (≤ 2 years) |
| Higher Penetration in Developing Economies With Unreliable Power Grids | +1.6% | Africa, South Asia, Latin America | Long term (≥ 4 years) |
| Rapid Adoption of High-Capacity Laptops and Gaming Consoles | +1.2% | North America, Europe, Asia-Pacific | Medium term (2-4 years) |
| Proliferation of Power-Bank Rental Kiosks at Transit Hubs | +0.9% | Asia-Pacific, Europe, select North American cities | Short term (≤ 2 years) |
| Integration of GaN Fast-Charging Chipsets in Premium Models | +1.1% | Global, led by North America and Europe | Medium term (2-4 years) |
| Source: Mordor Intelligence | |||
Surging Penetration of 5G-Enabled Smartphones
Fifth-generation networks consume 20% to 30% more energy than 4G because beamforming and continuous network scanning shorten daily battery life from 18 hours to 12 hours for heavy users.[1] Vivo’s X200 Pro with a 6,000 mAh cell still drained in 9.5 hours under sustained 5G video streaming, confirming that even larger batteries fail to cover an entire day for power users. Flagship silicon-carbon anodes remain limited to devices above USD 800, keeping mid-tier attachment rates for external batteries near 60%. Xiaomi shipped 21.6 million IoT peripherals in Q3-2025, each demanding routine charging and compounding portable-power needs. With Qi2 magnetic charging confined mainly to iPhones, most Android owners still rely on wired packs, reinforcing market breadth even as handset capacity inches upward.
Expanding E-Commerce for Consumer Electronics
China’s online retail sales rose 9.8% year on year in the first nine months of 2025, and digital products advanced 8.3%, propelled by algorithmic recommendations that surface power bank listings to recent smartphone or laptop buyers.[2] Alibaba’s Portable Power category booked USD 230.4 billion GMV in 2025, up 15.7%, with Anker’s 737 model capturing 31% of the 10,000–20,000 mAh tier. Flipkart ranked power banks among its five best-selling accessories during India’s 2025 festive season by bundling cashback and no-cost EMI offers. Amazon’s Prime Day 2025 discounted 10,000 mAh units to an average of USD 28, compressing margins but driving volume. Direct-to-consumer sites let brands bypass 25%-35% distributor markups, allowing 20,000 mAh, 65 W USB-C models at USD 50-60, a price once reserved for 10,000 mAh packs, broadening mass-market access.
Higher Penetration in Developing Economies With Unreliable Power Grids
Six hundred million Sub-Saharan Africans still lack reliable electricity, and South Africa imposed Stage 6 load shedding for 180 days in 2024, boosting power-bank sales in Johannesburg by 35% in 2025. Kenya’s M-Pesa handled USD 80 billion in 2025, yet 40% of rural users reported phone shutdowns during payment windows, spurring demand for 5,000–10,000 mAh packs priced below USD 15. Latin American operators plan USD 86-USD 90 billion in network upgrades through 2030, but rural uptime remains patchy, necessitating backup battery use. India’s BIS extended its new IS 302 Part 1:2024 hallmark to February 23, 2026, a rule likely to eliminate 30%-40% of uncertified imports and consolidate sales among domestic badge holders. Collectively, these gaps between device usage and grid reliability underwrite long-run adoption across emerging regions.
Integration of GaN Fast-Charging Chipsets in Premium Models
GaN transistors switch at frequencies above 1 MHz, 10 times faster than silicon MOSFETs, trimming thermal loss by 30% and enabling 65 W-140 W outputs in sub-500 g housings.[3] Anker’s 737 PowerCore 24K delivers 140 W through a single USB-C port, charging a 16-inch MacBook Pro to 50% in 28 minutes, a specification that redefines user expectations for mobile workstations. AUKEY’s Spark Mega PB-Y63 with 27,600 mAh and 140 W output targets field photographers who power laptops and mirrorless cameras concurrently. Baseus’ 20,000 mAh Blade series achieves a 15 mm profile while sustaining 100 W delivery at a USD 80 tag, undercutting rivals by 20%. Zendure’s SuperTank Pro adds a live wattage display, attracting technophiles who juggle phones, tablets, and drones on location.
Restraints Impact Analysis of Power Bank Market*
| Restraint | (~) % Impact on CAGR Forecast | Geographic Relevance | Impact Timeline |
|---|---|---|---|
| Inflated Counterfeit and Sub-Standard Products Eroding Trust | -1.3% | Asia-Pacific, Middle East, Africa | Short term (≤ 2 years) |
| Incremental Gains in Native Smartphone Battery Life | -0.9% | Global | Medium term (2-4 years) |
| Stricter UN 38.3 Air-Cargo Limits for Li-Ion Shipments | -0.6% | Global, with acute impact on cross-border e-commerce | Short term (≤ 2 years) |
| Early Traction of Solid-State Micro-Batteries Reducing Need for External Packs | -0.7% | North America, Europe, Japan, South Korea | Long term (≥ 4 years) |
| Source: Mordor Intelligence | |||
Inflated Counterfeit and Sub-Standard Products Eroding Trust
Samsung recalled 10,000 units in South Korea after 18 overheating incidents, slashing online sales for unbranded power banks under USD 10 by 15%. Indonesian customs seized 50,000 fake Anker packs labeled 20,000 mAh that tested at half capacity and lacked thermal cutoffs. India’s revised IS 302 standard will bar uncertified imports after February 2026, potentially eliminating one-third of gray-market shipments. UL 2056 certification costs up to USD 15,000 per SKU, discouraging small makers and concentrating share among brands that amortize compliance across large portfolios. As marketplaces tighten audits, consumer confidence shifts toward traceable, certified models.
Incremental Gains in Native Smartphone Battery Life
Silicon-carbon anodes lifted Vivo’s X200 Pro to 6,000 mAh and OnePlus 13 to 5,400 mAh without thickening cases. Samsung SDI aims to pilot 900 Wh/L solid-state cells in 2027, which could double handset capacity to 12,000 mAh. Toyota invested USD 1.5 billion in similar technology for electric vehicles with downstream potential in handsets post-2029. QuantumScape’s QSE-5 cell sustained 800 cycles with minimal fade, but smartphone formats remain three years away from mass production. Until costs fall below USD 100 per kWh, incremental gains slow but do not erase external-battery demand, especially among high-drain users.
*Our forecasts treat driver/restraint impacts as directional, not additive. The impact forecasts reflect baseline growth, mix effects, and variable interactions.
Power Bank Market Segment Analysis
By Capacity Range:
Mainstream Mid-Sizes Dominate, Ultra-High Packs AccelerateThe 8,001-20,000 mAh tranche captured 47.89% of 2025 revenue, underscoring its sweet-spot appeal for two to three full smartphone charges without bulk. Economies of scale in lithium-polymer procurement let brands price 10,000 mAh dual-port units between USD 25 and USD 35 while still protecting margins. Consumers gravitate toward this tier because it slides into backpacks and jackets yet offers a safety net for multiday trips. The segment anchors discount promotions on Tmall, JD, and Amazon, keeping the phrase 'power bank market' in frequent consumer searches. Above 30,000 mAh models are scaling at a 9.21% CAGR as photographers, drone pilots, and field engineers value capacities nearing the 100 Wh airline limit. AUKEY’s 27,600 mAh Spark Mega can refill a MacBook Pro twice, reducing downtime for creatives on location. Meanwhile, packs under 3,000 mAh service wearables but contribute negligible revenue, demonstrating how tail segments coexist within the broader power bank market.
Demand for 20,001–30,000 mAh products remains steady because they deliver three laptop recharges yet comply with cabin rules, preserving portability for frequent flyers. Zendure’s SuperTank Pro at 26,800 mAh integrates a digital readout, which differentiates it as a portable battery pack in a crowded middle band. Anker’s GaN-based 737 delivers 140 W through a single USB-C port, underscoring that wattage, not just capacity, shapes buyer decisions. The up to 3,000 mAh tier survives in convenience stores for emergency top-ups of earbuds and smartwatches. Although volumes are modest, their ubiquity maintains consumer familiarity, creating entry points that later up-sell higher-capacity products, sustaining the power bank market's trajectory.

By Charging Technology:
Wired Dominance Persists as Wireless Gains PrestigeWired models held 82.17% of 2025 revenue thanks to near-universal USB-C adoption and 85%-90% energy-conversion efficiency. USB-C PD 3.1 now supports 240 W, letting a single cable power laptops, tablets, and phones, a versatility prized in enterprise IT kits. Low bill-of-materials costs also allow wired units to command aggressive price tiers in the power bank market. Wireless packs, though only 17.83% in 2025, are projected to grow at an 8.47% CAGR on the back of Qi2 certification, which doubles inductive charging to 15 W for iPhone 12 and newer. Mophie’s Powerstation Wireless 10K Slim, priced at USD 79.95, targets early adopters who value MagSafe convenience.
Price differentials are narrowing as AUKEY’s MagFusion 10K retails at USD 39.99, undercutting peers by 50% while still offering Qi2 speeds. Anker’s MagGo 10K incorporates a fold-out stand and a smart display, showcasing how feature layering can justify 30%-40% premiums. Nevertheless, the inherent energy loss of inductive coupling keeps heavy users loyal to wired options, especially in regions where electricity costs discourage inefficiency. Brands therefore market wireless models as lifestyle accessories rather than primary workhorses, positioning them as complements rather than substitutes within the broader power bank market size narrative.
By Application:
Core Phone Demand Steady, Imaging Workflows SurgeSmartphones and tablets accounted for 66.92% of 2025 revenue, reflecting a five-billion-device install base and unified USB-C ports across both the Android and iPhone 15 lines. Lower entry prices, abundant SKUs, and constant mobile usage secure this anchor segment. Cameras and drones, although smaller, are advancing at a 9.16% CAGR as professional content creators operate high-draw equipment in off-grid environments. DJI’s Power 1000 with 1,024 Wh and a 140 W USB-C output illustrates the crossover between portable power stations and high-capacity banks, blurring category lines.
Laptops and gaming consoles account for roughly 15%-20% of demand, with Valve’s Steam Deck and ASUS ROG Ally propelling 65 W-100 W USB-C outputs into mainstream accessory talk tracks. Wearables and IoT devices remain niche, with under 5% share, but create volume opportunities in sub-USD 20 impulse units. Medical equipment such as portable ECG monitors requires IEC 60601-1 compliance, limiting competition and supporting higher margins. These use-case layers collectively drive breadth in the power bank market, ensuring that no single application monopolizes growth.
By Distribution Channel:
Online Algorithms Outperform Store AislesOnline platforms secured 62.19% of 2025 revenue and should widen their lead with an 8.43% CAGR through 2031. Algorithmic engines on Tmall, JD, Amazon, and Flipkart nudge users who purchase phones toward complementary charging accessories, boosting attach rates. Reviews, flash deals, and influencer videos build trust and accelerate purchase cycles. Offline channels at 37.81% still matter for impulse travel buys and warranty assurance. Best Buy allocates up to 15 linear feet for power banks, with premium SKUs at eye level and value brands lower, demonstrating that shelf architecture can still shape consumer choice.
Hybrid models are emerging: 7-Eleven Thailand partnered with ChargeSPOT to install rental kiosks in 2,500 stores, offering both hourly rentals and the sale of permanent units. Direct-to-consumer storefronts enable brands like Baseus to underprice offline tags by up to 30%, reinforcing online loyalty loops. Despite robust e-commerce, airport kiosks and convenience stores remain crucial last-minute channels, confirming that omnichannel strategies will remain central to overall power bank market growth.
Geography Analysis
APAC Power Bank Market
Asia-Pacific commanded 56.12% of 2025 sales, anchored by Shenzhen manufacturers that supply 70% of global lithium-polymer cells at cost bases 30% lower than Western peers. China’s dominance ensures localized supply chains and rapid SKU refresh cycles. India’s BIS hallmark deadline of February 2026 should weed out non-compliant imports, increase the share of certified domestic brands, and stabilize retail ASPs. Japan’s speedy adoption of Qi2 led MagSafe-compatible models to retail at JPY 8,000-12,000 (USD 55-82) in 2025, signaling a willingness to pay for convenience. South Korea tightened audits after Samsung’s 2024 recall, elevating UL 2056 labels as a prerequisite for big-box listings. Australia enforced UN 38.3 airline limits, capping carry-on capacity at 100 Wh and reshaping SKU launch strategies.
North America and Europe Power Bank Market
North America and Europe jointly contributed just over 30% of revenue, buoyed by hybrid work patterns and the EU common-charger mandate that nudged consumers toward new USB-C models. Mophie’s 140 W Powerstation Ultra 25K launched at USD 99.95 for MacBook users, reflecting high-spend consumer segments. Germany logged 18% year-on-year sales growth in Q1-2025 amid summer travel planning. France’s FNAC and Darty expanded power-bank shelf space by 25% and dedicated end-caps to Qi2 units. Russian market contraction following sanctions opened pockets for lower-priced Chinese brands like Xiaomi.
MEA and LATAM Power Bank Market
Africa, the fastest-growing region at 9.11% CAGR, depends on portable power to bridge unreliable grids. South Africa’s 2024 load shedding lifted sales 35% in major metros. Kenya’s rural M-Pesa users adopt USD 15 packs to avoid transaction disruptions. Egypt’s smartphone penetration reached 65% in 2025, yet daily summer outages average four hours, driving attachment rates above 70% in Cairo. Middle Eastern demand grows 7%-8% as tourists and expatriates carry multiple high-drain devices in hot climates. Latin America advances 6%-7% annually; despite USD 90 billion network investment plans, last-mile power deficiencies sustain long-run reliance on external batteries. These varied regional narratives together enlarge the global power bank market.
Regulatory Landscape
Safety, transport, and product-compliance rules are central to power bank commercialization, as products combine high-energy lithium-ion cells with consumer-facing enclosures. Globally, logistics compliance is anchored by the United Nations UN Manual of Tests and Criteria, Section 38.3 (UN 38.3), which is commonly required for air, sea, and rail movement of lithium batteries, and therefore shapes packaging, labeling, and cross-border e-commerce fulfillment for power banks. In North America, voluntary certification has become a practical listing requirement: ANSI/CAN/UL 2056 (Standard for Safety for Power Banks) received an updated American and Canadian National Standard designation in February 2025, and retailers and marketplaces increasingly screen for UL 2056 or IEC 62368-1 documentation to reduce safety incidents and counterfeit exposure.
In Europe, Regulation (EU) 2023/1542 is tightening requirements around batteries placed on the EU market, including sustainability and end-of-life provisions, influencing documentation and design-for-compliance even for external packs used with portable electronics. In July 2026, the European Commission published a Delegated Regulation amending Regulation (EU) 2023/1542 to introduce derogations tied to end-user removability and replaceability for certain portable-battery applications, underscoring the policy focus on repairability and user serviceability where applicable. Enforcement actions also reinforce the safety bar: in April 2026, the U.S. Consumer Product Safety Commission publicized a reannounced recall of Casely wireless portable power banks due to fire and burn hazards, including a reported fatality, reinforcing the commercial risk of inadequate thermal protection and traceability.
Value Chain Analysis
The power bank value chain starts with upstream battery materials and cell manufacturing (typically lithium-ion 18650 formats or pouch cells), then moves through battery management system components, power conversion and charging ICs (including USB-C Power Delivery controllers), enclosures, and final assembly, with quality assurance shaped by safety and transport test requirements such as UN 38.3. In cost structure terms, lithium-ion cells dominate the bill, while the rest of the chain drives differentiation through fast-charging capability (USB-C PD), safety features (thermal monitoring and protections), and industrial design for portability.
Compliance testing and certification throughput can act as a production bottleneck, particularly for exporters that must coordinate UN 38.3 documentation and safety certifications to access major online and offline channels. Much of global manufacturing is clustered in Asia, while brands compete through design, firmware, and safety engineering, then distribute through e-commerce, big-box retail, and transit-hub rental kiosks. Supply-chain diversification has become more visible at the brand level: in January 2025, Anker Innovations signed a supply agreement with Munoth Industries Limited to source lithium-ion cells from India, reducing reliance on Chinese suppliers and changing procurement and qualification workflows for a key input. Downstream, online marketplaces remain critical demand aggregators, but tightening audit requirements and certification screens contribute to channel consolidation and raise the advantage of manufacturers with strong traceability, stable cell sourcing, and faster certification cycles.
Competitive Landscape
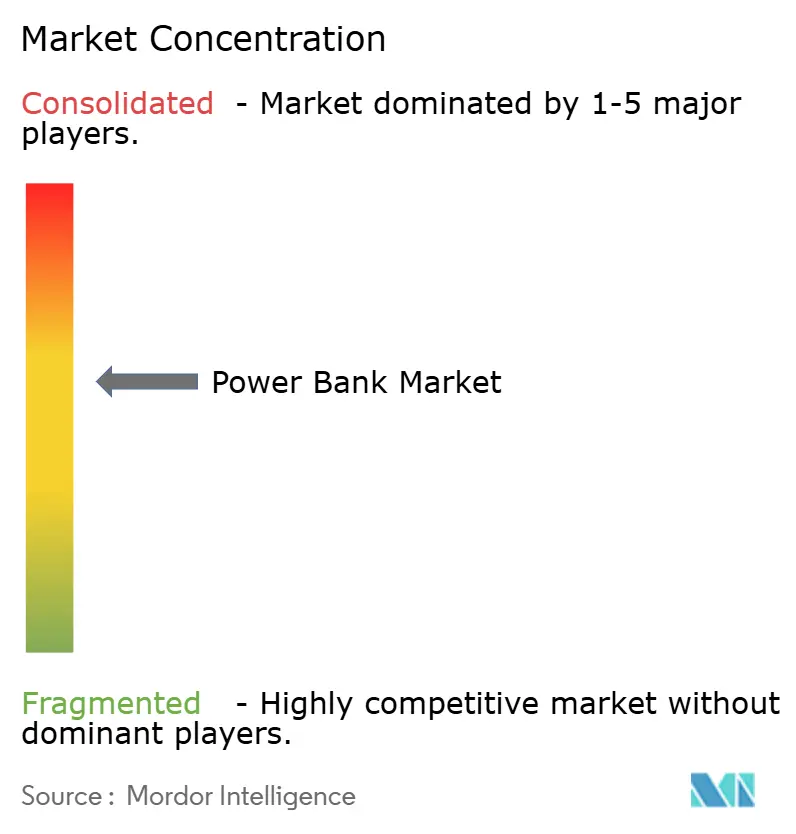
The top five brands accounted for an estimated 40%-45% of 2025 revenue, indicating moderate concentration in the power bank market. Anker leverages vertical integration from lithium-cell sourcing to GaN chipset design, cutting bill-of-materials costs by up to 20% versus contract assemblers and enabling sub-USD 60 pricing for 20,000 mAh-65 W packs that once cost USD 90. Xiaomi synergizes power-bank bundles with smartphone launches, capturing ecosystem lock-in as its IoT and lifestyle division generated CNY 27.6 billion (USD 3.8 billion) in Q3-2025. Baseus and UGREEN compete on price, offering 100 W-20,000 mAh units for USD 40-USD 50, winning share among cost-conscious prosumers in Southeast Asia and Latin America.
Technology differentiation centers on GaN fast-charging, Qi2 certification, and real-time wattage displays. Anker’s ActiveShield 2.0 monitors temperature 3 million times per day to preempt thermal runaway, adding a safety moat. Zendure and EcoFlow blur boundaries between power banks and portable stations, releasing rugged 1,000 Wh units with 2,400 W inverters and solar inputs for outdoor creators. Counterfeit risk remains a pressing issue; stringent audits by Amazon and Flipkart now require IEC 62368-1 or UL 2056 certificates before listing, pushing gray-market players offline. Compliance regimes such as India’s BIS hallmark, China’s CCC, and U.S. UL testing cost upwards of USD 15,000 per SKU, favoring incumbents with multi-SKU portfolios able to amortize these expenses. Consequently, the competitive field balances innovation against regulatory diligence to retain consumer trust.
Power Bank Industry Leaders
-
Anker Innovations Ltd.
-
Xiaomi Corporation
-
Sony Group Corporation
-
Koninklijke Philips N.V.
-
Huawei Technologies Co., Ltd.
- *Disclaimer: Major Players sorted in no particular order
Power Bank Market Companies Covered in this Report
- Anker Innovations Ltd.
- Xiaomi Corporation
- Samsung Electronics Co., Ltd.
- Shenzhen Haopai Electronics (RAVPower)
- Lenovo Group Ltd.
- Sony Group Corporation
- Koninklijke Philips N.V.
- ADATA Technology Co., Ltd.
- Panasonic Energy Co., Ltd.
- Huawei Technologies Co., Ltd.
- ZAGG Inc. (mophie)
- Belkin International
- UGREEN Group Ltd.
- Baseus Technology Co., Ltd.
- Syska Mobile Accessories
- Ambrane India Pvt. Ltd.
- Intex Technologies (India) Ltd.
- Aukey Technology Co., Ltd.
- Zendure USA Inc.
- EcoFlow Inc.
Market Opportunities and Future Outlook
Standardization and connector policy are creating product-refresh cycles that favor compliant, higher-value SKUs. The European Commission expanded the EU Common Charger requirements under the Radio Equipment Directive to include laptops effective April 28, 2026, reinforcing USB-C as the default interface across phones, tablets, and PCs and supporting bundling of USB-C PD power banks for multi-device charging. This aligns with consumer demand for laptop-capable outputs (USB-C PD 3.1) in compact form factors, opening whitespace for 20,000 mAh to 25,000 mAh designs that stay near common airline energy limits while delivering higher wattage for mobile work setups.
Safety-driven differentiation is also becoming an opportunity as regulators and channels pressure out uncertified products. In China, newer national safety requirements highlighted by industry coverage are pushing brands toward enhanced protection features and data/telemetry-style traceability, creating room for premium positioning around measurable safety and authenticity. In North America, evolving standards coverage for portable power packs, including ANSI/CAN/UL 2743 updates with an implementation date noted for September 24, 2027, signals broader certification scope (such as additional chemistries and feature sets), encouraging platforms and retailers to prefer vendors that can document compliance early. Across markets, these shifts elevate integrated power-management architectures and robust quality systems as ways to defend pricing while reducing recall and listing-risk for high-volume online channels.
Recent Industry Developments in Power Bank Market
- July 2026: Xiaomi introduced new power bank models positioned as compliant with China's updated national safety standard messaging in trade coverage, highlighting strengthened protection features. The launch reflects how safety-standard shifts in China are being used to differentiate products and accelerate SKU refresh cycles among large vendors.
- May 2026: Anker Innovations hosted Anker Day 2026 and outlined platform-level charging solutions and cross-brand technology positioning. The event signaled a strategic shift toward ecosystem-based offerings and scalable architecture beyond individual SKUs.
- June 2025: Anker rolled out the MagGo Power Bank 10K with Qi2 support, a foldable stand, and ActiveShield 2.0 safety features. The product strengthened Qi2-based offerings at the premium end of portable charging, supporting higher ASPs for magnetic wireless convenience while maintaining branded safety differentiation.
Power Bank Market Report Scope and Research Methodology
Market Definition and Coverage
This market covers revenue generated from power banks that store electricity and are used to charge portable electronic devices when a wall outlet is not available. It includes stand-alone rechargeable units sold through online and offline channels and used across common consumer charging needs.
Scope exclusions: Portable power stations above 100 Wh, phone cases with built-in batteries, and automotive jump-starters are excluded from this market sizing.
Segments Covered in This Report
- By Capacity Range
- Up to 3,000 mAh
- 3,001 - 8,000 mAh
- 8,001 - 20,000 mAh
- 20,001 - 30,000 mAh
- Above 30,000 mAh
- By Charging Technology
- Wired
- Wireless
- By Application
- Smartphones and Tablets
- Laptops and Gaming Consoles
- Wearables and IoT Devices
- Cameras and Drones
- Other Applications
- By Distribution Channel
- Online
- Offline
- By Geography
- North America
- United States
- Canada
- Mexico
- Europe
- Germany
- United Kingdom
- France
- Russia
- Rest of Europe
- Asia-Pacific
- China
- Japan
- India
- South Korea
- Australia
- Rest of Asia-Pacific
- Middle East and Africa
- Middle East
- Saudi Arabia
- United Arab Emirates
- Rest of Middle East
- Africa
- South Africa
- Egypt
- Rest of Africa
- Middle East
- South America
- Brazil
- Argentina
- Rest of South America
- North America
Data Sources, Market Sizing, and Validation
Desk Research
Desk research starts with building the demand backdrop for portable charging, then narrowing it to the power bank category in this study. We used public sources such as UN Comtrade for trade flows, U.S. International Trade Commission (USITC) data for customs classifications, and International Telecommunication Union (ITU) indicators for device and connectivity trends that influence usage.
We also cross-checked using sources such as U.S. Consumer Product Safety Commission (CPSC) recall notices for product compliance signals, IEC and USB-IF public documentation for charging standards context, and peer-reviewed battery and safety literature to understand typical specifications and constraints. Company filings, product announcements, retailer assortment signals, and reputable press were used to validate the timing of technology shifts, such as higher wattage charging and wireless compatibility. Select paid subscriptions for company financials, news intelligence, patent databases, and shipment-level trade analytics were used to fill gaps where public reporting is limited. The sources listed here are illustrative, and we used additional public and paid references for data collection, validation, and clarification.
Primary Interviews and Surveys
Primary work was used to pressure-test unit economics and adoption patterns across key buyer groups, then check how pricing and channel mix are shifting by region. We spoke with industry participants across manufacturing, brand, and channel roles, and also with informed buyers and distribution-side contacts to confirm assumptions on capacity preferences, fast-charging uptake, and replacement cycles across APAC, EMEA, and the Americas.
Distribution of primary research fieldwork respondents
| Company type | Respondent position | Region |
|---|---|---|
| Top tier: 36% | CXOs: 13% | APAC: 50% |
| Mid tier: 45% | Functional/Unit leaders: 42% | EMEA: 30% |
| Smaller Players: 19% | Managers: 45% | Americas: 20% |
Market-Sizing & Forecasting
Market sizing is built mainly through a top-down demand pool. We translate the device installed base and usage behavior into an addressable charging accessory spend, then filter it to power banks using category share and channel signals. To keep totals realistic, we corroborate the output with selective bottom-up approximations, such as sampled average selling price (ASP) by capacity band multiplied by estimated unit volumes, plus distributor-level sense checks in major countries.
Key model inputs include smartphone and tablet penetration trends, replacement and repurchase cycles for power banks, capacity mix (for example, 5,000 to 10,000 mAh versus 20,000 mAh and above), fast-charging wattage adoption, average ASP movement by technology features (wired, wireless, higher wattage), and import-export trends that indicate supply shifts. Where a bottom-up view is incomplete for smaller or private players, the gap is handled using channel share logic and conservative volume assumptions validated in interviews. Forecasting uses scenario analysis anchored to expected device growth, travel and mobility normalization, and technology-led ASP shifts, and then we adjust based on expert expectations on the pace of standards adoption and price pressure.
Data Validation & Update Cycle
Validation is done through multiple checks so the final number is not driven by a single assumption. We compare the modeled revenue trend against independent signals such as trade movement, category pricing ranges, and the timing of major specification shifts, then review outliers by region and by year before sign-off.
If the variance is material, analysts re-check the input series and, when needed, re-contact selected respondents to confirm whether the change reflects a real shift or a data timing issue. The report is refreshed annually, and interim updates are made when major events shift demand or supply conditions. Before delivery, a final review pass is completed so clients receive an updated view aligned with the latest available public information.
Mordor Intelligence's Power Bank Market Estimate Compared With Other Published Estimates
Published market numbers for power banks can differ widely even when the category label matches, since firms may count different product groups, use different base years, or apply different pricing logic. We present the comparison below so readers can see how scope and assumption choices typically move the final value.
Portable power stations above 100 Wh sit outside Mordor Intelligence's scope for power banks, and that exclusion can materially change totals in years when high-capacity portable energy products grow faster than standard phone charging packs. Differences also come from whether an estimate assumes aggressive ASP uplift from fast-charging and wireless features, how currency conversion timing is handled, and how often the model is updated when trade and channel signals shift.
Benchmark comparison
| Source | Market Size | Gaps in Research Methodology |
|---|---|---|
| Mordor Intelligence | USD 21.72 B (2026) | |
| Industry Publisher A | USD 15.70 B (2024) | Uses an earlier base year and a longer forecast window, and the scope description is broader at a segment level, which can mix capacity ranges and energy-source variants without clearly separating non-standard portable energy devices from typical phone charging packs. |
| Global Consultancy B | USD 12.50 B (2024) | Anchors the model to a shorter period and a lower starting value, and it appears to rely more on high-level growth application rather than reconciling category mix shifts such as fast-charging wattage adoption and ASP progression by feature set. |
Across the three values, much of the spread comes from what is counted as a power bank, the reference year used, and how feature-led pricing is carried forward. Keeping assumptions tied to observable device demand signals and repeatable checks makes the sizing easier for users to interpret and update as standards and channel mix evolve.
Key Questions Answered in the Report
What growth rate is predicted for the power bank market to 2031?
The market is forecast to expand at an 8.04% CAGR, climbing from USD 21.72 billion in 2026 to USD 31.97 billion by 2031.
Which capacity segment leads global sales?
Packs between 8,001 mAh and 20,000 mAh led with 47.89% revenue share in 2025 thanks to their balance of portability and runtime.
Why are wireless power banks gaining attention?
Qi2 certification doubled inductive charging speed to 15 W for iPhone users, creating a premium tier growing at an 8.47% CAGR despite higher energy losses.
Which region will post the fastest growth?
Africa is projected to grow at 9.11% CAGR as unreliable grids and high mobile penetration spur demand for portable charging.
How are GaN chipsets changing product design?
GaN transistors allow 65 W-140 W outputs in sub-500 g housings, cutting recharge times by up to half and enabling laptop-grade charging from pocket-sized packs.
What certifications matter most for market entry?
UL 2056, IEC 62368-1 and regional marks such as India’s BIS or China’s CCC are increasingly required by retailers and regulators to secure shelf or listing access.