
Potassium Permanganate Market Size and Share
Market Overview
| Study Period | 2021 - 2031 |
|---|---|
| Market Size (2026) | USD 0.97 Billion |
| Market Size (2031) | USD 1.19 Billion |
| Growth Rate (2026 - 2031) | 4.11 % |
| Fastest Growing Market | Middle East and Africa |
| Largest Market | Asia Pacific |
| Market Concentration | Medium |
Major Players *Disclaimer: Major Players sorted in no particular order Image © Mordor Intelligence. Reuse requires attribution under CC BY 4.0. | |
Potassium Permanganate Market Analysis by Mordor Intelligence
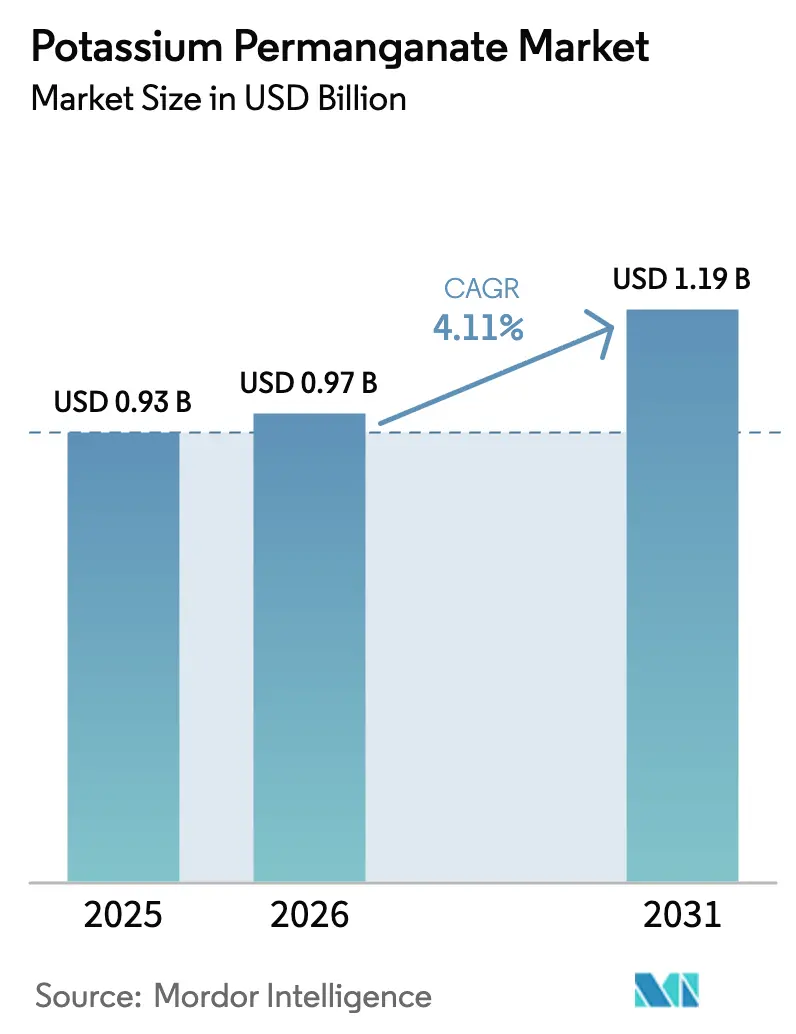
The Potassium Permanganate Market size is expected to increase from USD 0.93 billion in 2025 to USD 0.97 billion in 2026 and reach USD 1.19 billion by 2031, growing at a CAGR of 4.11% over 2026-2031. Municipal utilities in Asia-Pacific and the Middle-East are scaling permanganate dosing to meet tighter iron and manganese thresholds in drinking water, while pharmaceutical syntheses and biosecure aquaculture systems are opening fresh revenue streams that compensate for slower growth in mature North American segments. Gulf desalination operators favor permanganate because it removes trace metals and biofilms without forming regulated chlorinated by-products, and this preference is financially justified as membrane replacement costs have climbed to USD 500 per module. The January 2023 fire at Carus Corporation’s LaSalle facility exposed the vulnerability of North American buyers to single-point production failures, drove record imports from India, and accelerated trials of sodium permanganate as a more soluble substitute. Producers that control manganese-dioxide feedstock, maintain NSF/ANSI 60 certification, and invest in pneumatic fluidized-tower reactors retain a durable cost and compliance advantage even as new use cases emerge.
Key Report Takeaways
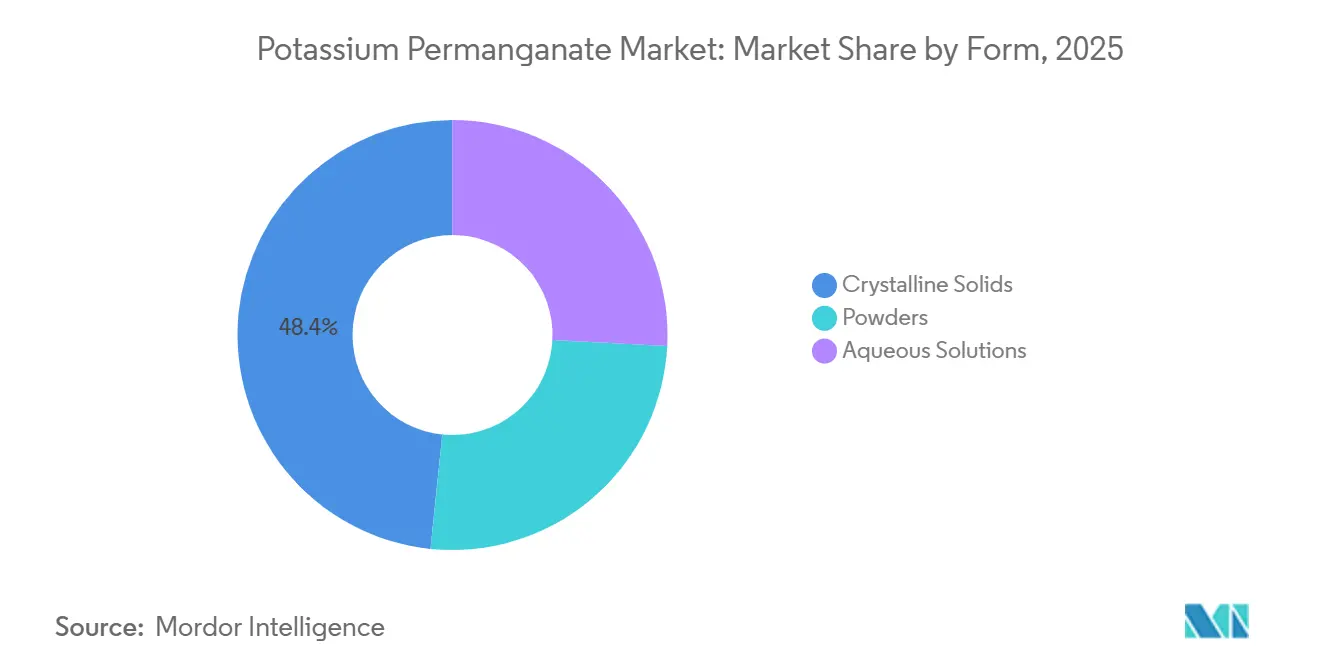
- By form, crystalline solids led with 48.37% of Potassium Permanganate Market market share in 2025, while aqueous solutions are projected to advance at a 5.64% CAGR through 2031.
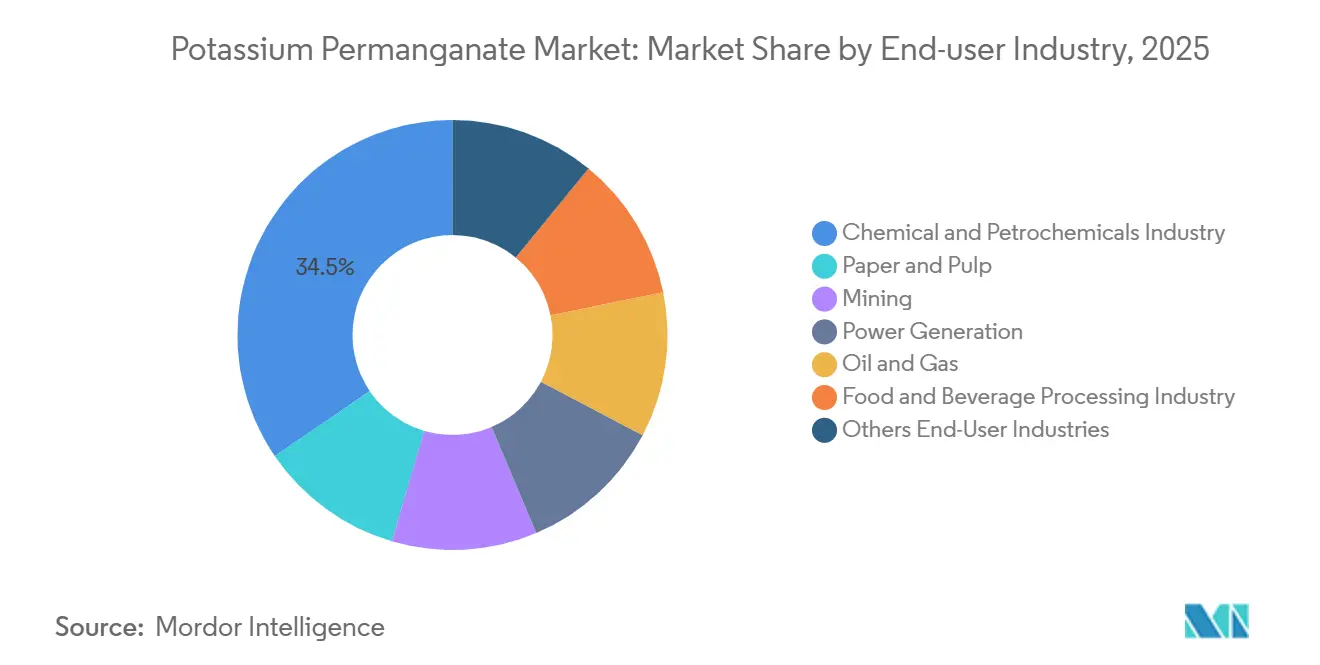
- By end-user industry, chemical and petrochemicals accounted for 34.52% share of the Potassium Permanganate Market market size in 2025; food and beverage processing is forecast to grow fastest at 5.77% CAGR to 2031.
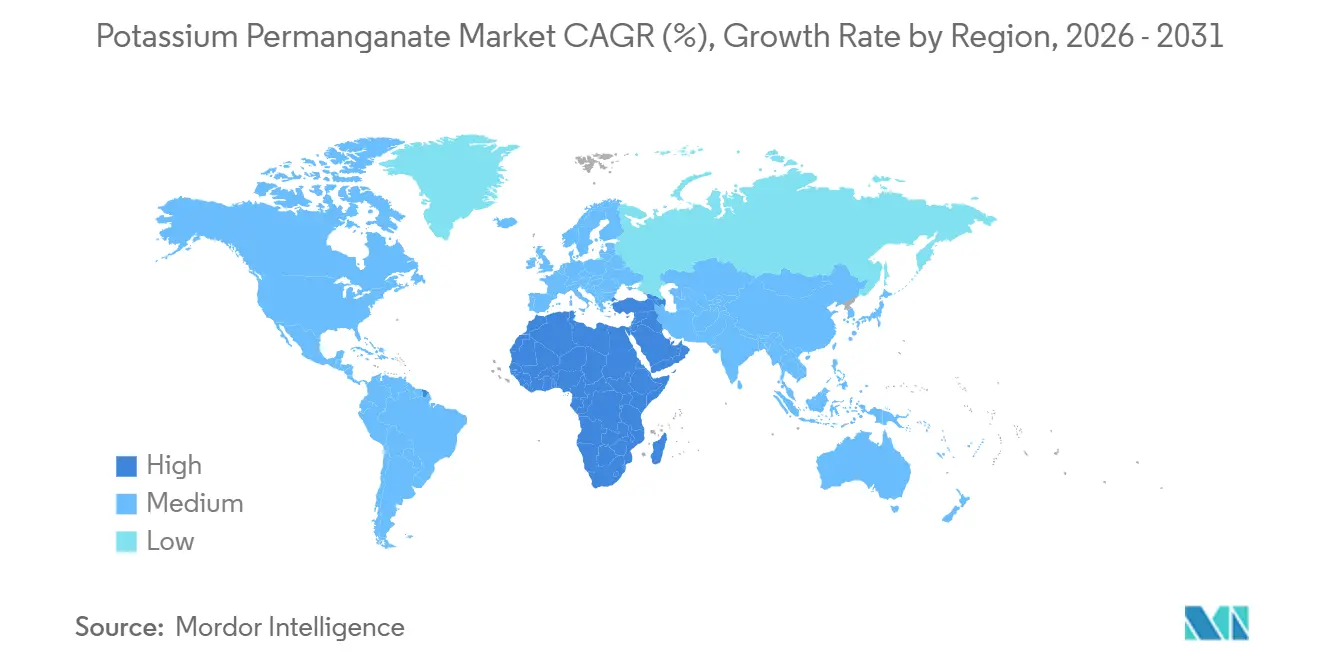
- By geography, Asia-Pacific captured 46.28% revenue share in 2025, whereas the Middle-East and Africa region is poised for the quickest expansion at a 5.43% CAGR through 2031.
Note: Market size and forecast figures in this report are generated using Mordor Intelligence’s proprietary estimation framework, updated with the latest available data and insights as of January 2026.
Market Trends and Insights
Drivers Impact Analysis of Potassium Permanganate Market*
| Driver | (~) % Impact on CAGR Forecast | Geographic Relevance | Impact Timeline |
|---|---|---|---|
| Growing Need for High-Quality Water Treatment | +1.2% | Global, with concentration in Asia-Pacific and Middle-East and Africa | Medium term (2-4 years) |
| Expanding Pharmaceutical Synthesis Applications | +0.6% | North America, Europe, India | Medium term (2-4 years) |
| Rapid Industrial Adoption in Aquaculture Biosecurity | +0.5% | Asia-Pacific (China, India, Southeast Asia), South America | Short term (≤ 2 years) |
| Emerging Demand for Permanganate-Based Battery Electrolyte Additives | +0.4% | Global, early adoption in North America and Asia-Pacific | Long term (≥ 4 years) |
| Advanced Odor-Control Solutions in Industrial Wastewater | +0.3% | North America (oil & gas), Asia-Pacific (petrochemicals) | Short term (≤ 2 years) |
| Source: Mordor Intelligence | |||
Growing Need for High-Quality Water Treatment
Water-scarce regions have tightened dissolved manganese limits to 0.05 mg/L, and utilities now prefer permanganate over chlorine because it oxidizes metals without producing trihalomethanes[1]World Health Organization, “Guidelines for Drinking-Water Quality 2022,” who.int . Desalination complexes in the United Arab Emirates dose 2–4 mg/L upstream of reverse-osmosis membranes, preventing biofouling and extending membrane life, which offsets chemical costs that average USD 300 per metric ton. The country’s 1,585 MIGD installed desalination capacity translates to more than 2,400 metric tons of annual demand, and national targets for 95% wastewater reuse will deepen consumption. Certification under NSF/ANSI 60 ensures only qualified formulations enter municipal pipelines, which limits supplier churn and favors incumbents that maintain audited production records.
Expanding Pharmaceutical Synthesis Applications
Manufacturers have shifted from chromium-based oxidants toward permanganate to avoid heavy-metal disposal liabilities. A 2% increase in oxidation selectivity saves about USD 0.5 million annually for a 100-metric-ton API line, making process economics compelling even at higher oxidizer prices. FDA rules under 21 CFR 250.108 restrict crystal sales to prescription status, yet dilute solutions below 0.04% remain available for topical antiseptics, a category that expanded during pandemic shortages of alcohol disinfectants. India’s export strategy includes REACH-compliant inorganic oxidizers, positioning local suppliers to win European orders as global majors rationalize their vendor lists.
Rapid Industrial Adoption in Aquaculture Biosecurity
Asia-Pacific produces over 70% of global farmed fish, and hatcheries now dose 2 mg/L permanganate for indefinite pond treatments that eliminate parasites without residual toxicity. University trials on Nile tilapia confirmed 4-hour exposures remove Dactylogyrus spp. and keep recurrence low, encouraging adoption in biosecured export farms. Production costs are competitive at roughly USD 80 to treat a one-acre pond at 5-foot depth, undercutting formaldehyde when labor and reporting costs are included.
Emerging Demand for Permanganate-Based Battery Electrolyte Additives
Flow-battery prototypes using permanganate redox couples deliver 99% coulombic efficiency over 400 cycles and aim for installed costs below USD 150 per kWh, which could unlock utility-scale storage below subsidy thresholds. Each 10 MWh pilot would require nearly 50 metric tons for initial fill, while annual top-ups create steady chemical offtake. Partnerships between cell developers and oxidation-chemistry suppliers are under way in California and South Korea, signaling a route to commercial scale if stability barriers are resolved.
Restraints Impact Analysis of Potassium Permanganate Market*
| Restraint | (~) % Impact on CAGR Forecast | Geographic Relevance | Impact Timeline |
|---|---|---|---|
| Health and Dermal-Toxicity Concerns | -0.5% | Global, particularly North America and Europe | Medium term (2-4 years) |
| Availability of Benign Competing Oxidizers (e.g., Sodium Hypochlorite) | -0.8% | Global, with stronger impact in North America | Short term (≤ 2 years) |
| Volatile Supply of High-Grade MnO2 Feedstock | -0.6% | Global, acute in North America | Short term (≤ 2 years) |
| Source: Mordor Intelligence | |||
Health and Dermal Toxicity Concerns
Occupational-safety rules require gloves, face shields, and spill-containment systems when permanganate concentration exceeds 0.04%, adding up to USD 15,000 in annual compliance costs for a mid-size water plant. WHO reports cited genotoxic effects in rodents, raising caution even though no guideline revision followed. Utilities therefore err on low dose rates, sometimes compromising oxidation effectiveness.
Availability of Benign Competing Oxidizers
Sodium hypochlorite sells for USD 0.50–1.00 per gallon while potassium permanganate costs USD 2.50–4.00 per kilogram, driving cost-sensitive facilities toward chlorine-based solutions[2]U.S. Environmental Protection Agency, “Chlorination Disinfection Fact Sheet,” epa.gov. Chlorine dioxide and hydrogen peroxide also displace permanganate in pulp bleaching, and growing acceptance of sodium permanganate, which is more soluble and generates less sludge, cannibalizes the traditional solid form.
*Our forecasts treat driver/restraint impacts as directional, not additive. The impact forecasts reflect baseline growth, mix effects, and variable interactions.
Potassium Permanganate Market Segment Analysis
By Form:
Aqueous Solutions Gain Traction in Automated SystemsCrystalline solids held 48.37% of Potassium Permanganate Market market share in 2025 on the strength of two-year shelf stability and lower freight cost per active kilogram. Utilities in India and sub-Saharan Africa rely on gravity dissolving tanks that suit bagged material, while aquaculture farms dissolve crystals pond-side to match parasite cycles. The shift toward automated dosing in Gulf desalination plants, however, favors liquid formats because workers avoid dust exposure and exothermic reactions. A single 100 MIGD desalination unit in the United Arab Emirates consumes roughly 300 metric tons annually, and bulk liquid delivery in intermediate bulk containers streamlines logistics in 45 °C heat. Chemical plants also prefer solutions that feed closed-loop oxidation tanks through PLC-controlled pumps, enabling tighter dose control and reducing manganese-sludge disposal.
Aqueous solutions are projected to grow at a 5.64% CAGR, making them the fastest form category through 2031. Real-time spectrophotometric sensors detect 0.45 µM permanganate in process streams, which allows operators to optimize dosing continuously and cut over-feed costs. Powders, while more soluble than crystals, face corrosion issues in long-term storage yet still find use in mining sites that value rapid dissolution for in-situ chemical oxidation. As a result, the Potassium Permanganate Market market continues to diversify across form factors, and suppliers that offer multi-format portfolios capture cross-selling opportunities when customers upgrade dosing infrastructure.


By End-User Industry:
Food Processing Outpaces Legacy SegmentsChemical and petrochemical companies consumed 34.52% of Potassium Permanganate Market market size in 2025, driven by oxidative desulfurization, wastewater polishing, and synthesis of adipic and terephthalic acid intermediates. Plants that refine sour-water streams dose 50–100 mg/L to oxidize hydrogen sulfide, which reduces corrosion and odor complaints. Food and beverage processors, however, are poised for the sharpest gains at a 5.77% CAGR. FDA Food Safety Modernization Act rules demand validated wash-water sanitation, and potassium-based chemicals avoid sodium build-up that degrades soil when spent solutions irrigate fields. Organic growers view the potassium ion as a nutrient rather than a soil contaminant, enhancing permanganate’s acceptance in high-value produce.
Paper mills still apply permanganate in kappa number tests to measure residual lignin in bleached pulp, while mining operators oxidize ferrous iron and manganese in acid-mine drainage to meet discharge permits. Power utilities dose cooling circuits to control zebra-mussel infestations in the Great Lakes, consuming 10–15 metric tons per 500 MW plant during spawning seasons. Oil and gas producers oxidize mercaptans and hydrogen sulfide in produced water, thereby eliminating pyrophoric iron sulfide that causes tank fires. Taken together, these niches stabilize baseline demand even as new revenue centers emerge in food processing and advanced battery materials.
Geography Analysis
APAC and North America Potassium Permanganate Market
Asia-Pacific generated 46.28% of Potassium Permanganate Market market revenue in 2025, anchored by China’s export-oriented supply base. Chongqing Changyuan Group operates vertically integrated sites in Rongchang and Baiyin that claim 60% of global output and 90% of Chinese exports. India became the primary supplier to North America after the 2023 Carus outage, shipping 161 metric tons in January 2025 alone. Japan and South Korea use permanganate in pharmaceutical syntheses and ultrapure water plants for semiconductor fabs, while Australia deploys it in municipal water and salmon aquaculture.
MEA Potassium Permanganate Market
The Middle-East and Africa region is forecast to post the swiftest growth at 5.43% CAGR. Gulf Cooperation Council utilities dose permanganate throughout desalination pretreatment and wastewater recycling to hit national water-security targets, and South African mines oxidize acid-mine drainage before discharge to the Vaal River. Saudi petrochemical complexes in Jubail and Yanbu employ permanganate to control cooling-water biofilms and reduce hydrogen sulfide emissions, aligning with Royal Commission discharge standards.
The Americas and Europe Potassium Permanganate Market
In North America, the Carus fire demonstrated regional supply fragility, prompting utilities to diversify sources and test sodium permanganate as an immediate substitute. Canada’s largest volumes come from Great Lakes surface-water plants that mitigate taste and odor, whereas Mexican demand is split between mining in Sonora and municipal upgrades supported by USMCA funds. Europe shows modest growth as chlorine dioxide dominates large plants, yet brownfield remediation projects in Germany and the Netherlands continue to specify permanganate for in-situ chemical oxidation of chlorinated solvent plumes. South America’s consumption is tied to Chilean salmon farms and Brazilian tilapia ponds that demand biosecure oxidants, while Argentine wineries sanitize barrels with permanganate to avoid sulfur residues.

Value Chain Analysis
The value chain begins with manganese feedstock (MnO2) and potassium inputs, followed by high-temperature fusion, leaching, crystallization and drying to produce crystalline permanganate, with dissolution, filtration and packaging for aqueous solutions. From production hubs, the chain moves through exporter channels into regional importer-distributors that handle strong-oxidizer transport constraints (UN 1490) and last-mile delivery to utilities and industrial users. North American buyers diversified sourcing after the January 2023 disruption at Carus Corporation, increasing imports (including from India) and accelerating evaluation of more soluble permanganate formats for automated dosing. Downstream, end users increasingly pair product supply with application support (dosing system design, monitoring, and sludge-handling guidance), tightening the link between chemical suppliers, water-treatment OEMs, and local distributors with broad branch networks. Compliance and plant-qualification requirements from authorities such as NSF/ANSI 60 and UN packaging standards shape supplier selection and audit cycles.
Competitive Landscape
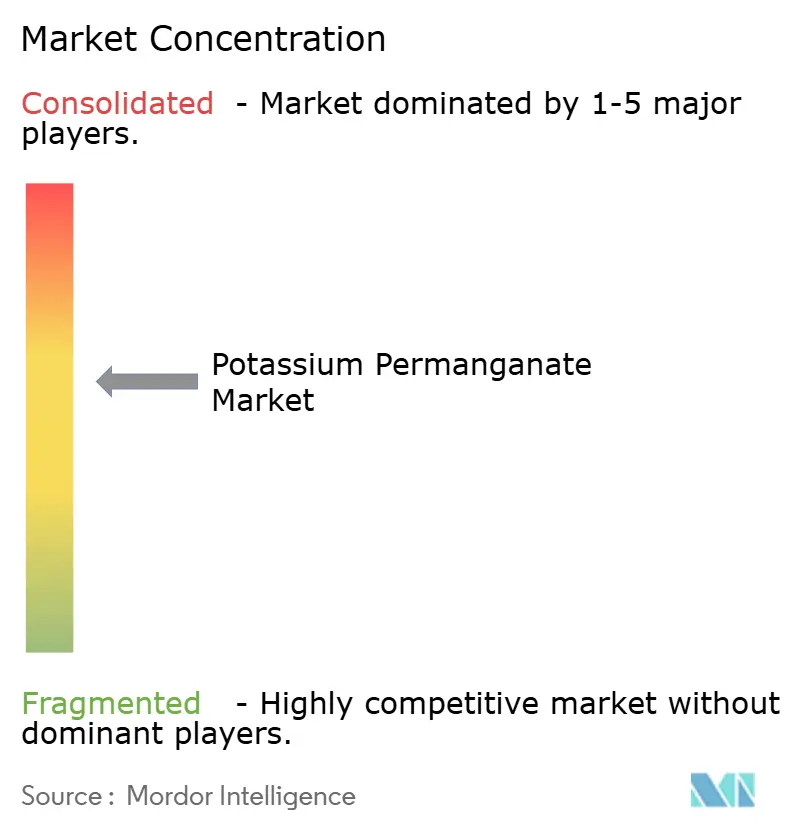
Global production is moderately concentrated, with Chongqing Changyuan Group and Carus Corporation collectively accounting for an estimated 70% capacity. Changyuan joined the International Manganese Institute in November 2023, positioning itself to influence global standards and thereby reinforce acceptance of permanganate in regulated markets. Carus markets CAIROX and AQUOX through Univar Solutions’ 140-branch network, achieving 10-day delivery to most North American water plants. The January 2023 fire exposed the strategic risk of an 80% domestic share resting on one facility, pushing customers to seek Indian supply and to trial liquid sodium permanganate that claims superior solubility and lower sludge.
Smaller Indian players such as Libox Chem and Otto Chemie capture export share by offering flexible drum sizes, REACH dossiers, and ISO 9001 certification. Feedstock control is critical: firms with captive manganese-dioxide mines or long-term Gabonese offtake enjoy a USD 0.30–0.50 per kilogram cost edge and reinvest savings in pneumatic fluidized-tower reactors that lift yield and cut waste salts. Regulatory barriers remain high because NSF/ANSI 60 and FDA drug-master-file registration impose multi-year audit cycles. These hurdles slow new entrants but also delay broad adoption of process innovations that could lower costs or reduce emissions across the Potassium Permanganate Market.
Potassium Permanganate Industry Leaders
Carus Group Inc.
GFS Chemicals, Inc.
Nippon Chemical Industrial CO., LTD.
Hangxin Technology
Chongqing Changyuan Group Limited
- *Disclaimer: Major Players sorted in no particular order
Potassium Permanganate Market Companies Covered in this Report
- Carus Group Inc.
- Changsha Yonta
- Chongqing Changyuan Group Limited
- GFS Chemicals, Inc.
- Hangxin Technology
- Hebei Huiyang Chemical
- Hubei Xiangyun (Group) Chemical Co., Ltd.
- Libox Chem (India) Pvt. Ltd.
- Magnesia GmbH
- Milport Enterprises, Inc.
- Mubychem Group
- Nippon Chemical Industrial CO., LTD.
- Otto Chemie Pvt. Ltd.
- Rusan Pharma
- Seidler Chemical Co.
- Univar Solutions Inc,
- Universal Chemicals & Industries Pvt. Ltd.

Market Opportunities and Future Outlook
A key whitespace exists in municipality and industrial programs that require auditable impurity control and consistent supply. Anchors include ANSI/AWWA B603-23 for permanganates and NSF/ANSI/CAN 600 certification for potable water and wastewater uses, which favor suppliers able to document impurity control and offer liquid dosing formats with technical services. Packaging and logistics improvements for strong-oxidizer handling address UN 1490 constraints and support utilities pursuing multi-sourcing following the 2023 North American outage. In treatment trains, permanganate pretreatment is deployed to support PFAS remediation with GAC, with Gulf desalination pretreatment already dosing permanganate and evidence of its role in managing trace metals and biofilms, linking oxidant choice to capex and O&M outcomes rather than disinfection alone. Higher-purity portfolios enable oxidation steps in electronics and pharma, while aquaculture biosecurity in Asia-Pacific and South America expands where pond treatments are integrated into export-farm protocols.
Recent Industry Developments in Potassium Permanganate Market
- June 2026: Carus published updated technical guidance describing how permanganate pretreatment can reduce competing iron and manganese in source water to improve granular activated carbon performance in PFAS treatment trains. The positioning connects permanganate demand to utility PFAS programs and shifts competition toward suppliers that can support integrated process design and verification.
- January 2025: Carus completed a major rebuild project at its Peru, Illinois site following the 2023 fire, incorporating upgraded water containment and recycling systems. Restoring and modernizing domestic operations improves supply reliability for North American municipal and industrial buyers that had increased imports and broadened supplier qualification after the disruption.
- November 2024: Carus completed a capacity expansion at its LaSalle, Illinois facility, lifting potassium permanganate production capacity by 35% and upgrading crystallization and automated packaging. The added output and automation strengthen service levels for utility and industrial contracts where delivery lead times and packaging consistency directly influence dosing reliability and compliance.


Potassium Permanganate Market Report Scope and Research Methodology
Market Definition and Coverage
This market is measured as the sales value of potassium permanganate supplied as a chemical product, across common physical forms and end-use consumption in industrial and municipal applications, tracked across major producing and consuming regions.
Scope exclusions: We exclude downstream services and equipment spending (such as dosing systems, filtration units, and treatment plant capex) even when potassium permanganate is part of the process.
Segments Covered in This Report
- By Form
- Crystalline Solids
- Powders
- Aqueous Solutions
- By End-user Industry
- Chemical and Petrochemicals Industry
- Paper and Pulp
- Mining
- Power Generation
- Oil and Gas
- Food and Beverage Processing Industry
- Other End-User Industries
- By Geography
- Asia-Pacific
- China
- India
- Japan
- South Korea
- ASEAN Countries
- Rest of Asia-Pacific
- North America
- United States
- Canada
- Mexico
- Europe
- Germany
- United Kingdom
- France
- Italy
- NORDIC Countries
- Rest of Europe
- South America
- Brazil
- Argentina
- Rest of South America
- Middle-East and Africa
- South Africa
- Saudi Arabia
- Rest of Middle-East and Africa
- Asia-Pacific
Data Sources, Market Sizing, and Validation
Desk Research
Desk work started with mapping where potassium permanganate is produced, traded, and used, so that the demand pools and price logic could be set up with fewer blind spots. We relied on public sources such as USGS mineral statistics for manganese-related supply context, UN Comtrade trade flows for relevant HS codes, and US EPA and WHO publications to anchor water-treatment use cases and compliance signals.
To avoid over-relying on a single data stream, we also reviewed sources such as the USITC DataWeb for import and tariff context, peer-reviewed journals that discuss oxidation performance and dosing ranges, and national standards references where applicable (for example, potable water treatment acceptance). Company annual reports, investor slides, and reputable industry press were used to capture capacity moves, operating constraints, and regional supply availability, then selective paid subscriptions for company financials, patents, and shipment-level trade checks were used to sanity-check directionally. The sources listed here are illustrative, and additional public and paid references were used for data collection, validation, and clarification.
Primary Interviews and Surveys
Primary conversations were used to confirm how buyers specify grade and form, how procurement contracts are priced, and how demand changes with municipal and industrial treatment cycles. We spoke with a mix of producers, distributors, water-treatment operators, and industrial users across APAC, EMEA, and the Americas, so assumptions on utilization, substitution, and delivered pricing could be adjusted to local realities.
Distribution of primary research fieldwork respondents
| Company type | Respondent position | Region |
|---|---|---|
| Top tier: 33% | CXOs: 15% | APAC: 49% |
| Mid tier: 51% | Functional/Unit leaders: 41% | EMEA: 30% |
| Smaller Players: 16% | Managers: 44% | Americas: 21% |
Market-Sizing & Forecasting
Sizing begins with a top-down reconstruction of demand, where regional consumption is built from water and wastewater treatment volumes, industrial oxidation use intensity, and trade balances, then translated into value using observed price bands. The totals are corroborated through selective bottom-up approximations, including sampled supplier shipments where visible, distributor channel checks, and volume-by-ASP builds for a handful of high-consumption end uses. The model is adjusted where the two views do not align.
Key inputs in the model include municipal treatment activity (population served and treatment throughput), oxidation use cases by industry (such as aquaculture and chemical processing intensity), import dependency by region, and a working view of operating rates and supply tightness that influence price realization. Pricing is handled through an ASP ladder that separates form and grade differences, then applies regional delivered-price adjustments, since freight, packaging, and compliance requirements can shift realized prices.
For the forecast, scenario analysis is used to reflect how water quality enforcement, infrastructure spending cycles, and industrial production outlook can pull demand up or down. Expert inputs from interviews were used to select the most realistic scenario path by region. Gaps in bottom-up visibility were handled by applying conservative capture rates to the observed supplier and channel signals, followed by rechecks against trade and consumption markers.
Data Validation & Update Cycle
Outputs are checked against independent signals such as trade values, known capacity changes, and regional demand indicators, so the final number does not drift away from what is observable. Where the model creates outliers, the drivers are re-tested, including conversion factors, price ladders, and any one-off events that may have temporarily distorted volumes.
A second analyst review is used to challenge the main assumptions and confirm that the logic stays consistent across regions and end uses. The report is refreshed annually, and interim updates are triggered when material events occur, such as major capacity additions, disruptions, or abrupt commodity and currency moves. Before delivery, we run a final check pass so clients receive the latest updated view.
Mordor Intelligence's Potassium Permanganate Market Size Versus Other Published Estimates
Published market sizes for potassium permanganate often do not match because the counted scope, the price basis, and the timing assumptions differ across sources, even when the label sounds the same. Differences also come from whether estimates lean on value-only reporting or reconcile value back to physical demand signals.
A practical gap driver in this market is how average selling prices are refreshed and converted into USD, since chemical pricing can move with freight, packaging, and regional availability, while currency timing can shift the reported total. By updating the ASP ladder with recent quotes and rechecking it against trade-value signals near the cut-off date, the number stays closer to the year it claims to represent, which is a key reason the Mordor Intelligence estimate is not aligned with figures that appear to use older pricing or broader inclusions.
Benchmark comparison
| Source | Market Size | Gaps in Research Methodology |
|---|---|---|
| Mordor Intelligence | USD 0.93 B (2025) | |
| Global Consultancy A | USD 0.31 B (2025) | Uses a narrower application boundary that is closer to water-treatment demand only, which reduces the counted industrial oxidation uses and keeps the value closer to a limited demand pool. |
| Industry Publisher B | USD 0.89 B (2025) | Appears to use a different pricing basis for value, with less separation by form or delivered regional pricing, which can compress the total when higher realized prices are not captured consistently. |
Looking across the table, the spread is mainly explained by boundary setting and pricing mechanics rather than a disagreement that consumption exists. When scope is kept consistent and pricing is refreshed in a traceable way, the resulting market size is easier to reproduce and can be stress-tested with trade and demand indicators.


Key Questions Answered in the Report
What is the projected market size of the Potassium Permanganate Market in 2031?
It is expected to reach USD 1.19 billion under a 4.11% CAGR trajectory from USD 0.97 billion in 2026.
Which region will grow fastest for permanganate demand through 2031?
The Middle-East and Africa region is forecast to expand at a 5.43% CAGR as utilities invest in desalination and wastewater reuse.
Why are aqueous solutions gaining popularity over crystalline permanganate?
Automated dosing in large plants eliminates dust exposure and supports real-time control, which favors liquid formats that dissolve instantly.
What caused the January 2023 supply disruption in North America?
A fire at Carus Corporation’s LaSalle plant halted output for 90 days, forcing buyers to import from India and consider sodium permanganate substitutes.
Page last updated on:


 Your data is secure and never sold or shared.


