| Study Period | 2017 - 2030 |
| Base Year For Estimation | 2024 |
| Forecast Data Period | 2025 - 2030 |
| Market Size (2025) | USD 21.51 Billion |
| Market Size (2030) | USD 28.45 Billion |
| CAGR (2025 - 2030) | 5.75 % |
| Market Concentration | Medium |
Major Players*Disclaimer: Major Players sorted in no particular order |

Potash Fertilizer Market Analysis
The Potash Fertilizer Market size is estimated at 21.51 billion USD in 2025, and is expected to reach 28.45 billion USD by 2030, growing at a CAGR of 5.75% during the forecast period (2025-2030).
The global potash fertilizer industry is experiencing significant consolidation through strategic acquisitions and partnerships, as evidenced by several major deals in 2023. Notable among these is K+S's acquisition of a 75% stake in the South African trading company ICH, strengthening its presence in southern and eastern Africa, while EuroChem Group's purchase of a controlling stake in Brazilian distributor Fertilizantes Heringer demonstrates the industry's focus on expanding distribution networks in key agricultural markets. These strategic moves are reshaping the competitive landscape, with the top five players - including The Mosaic Company, Nutrien Ltd, K+S Aktiengesellschaft, EuroChem Group, and Sinofert Holdings Limited - collectively commanding 46.8% of the global potash market.
The industry is witnessing a significant technological evolution in product formulations, particularly in the specialty fertilizer segment. Water-soluble fertilizers have emerged as the dominant force in the specialty segment, capturing a 63.5% market share, while liquid fertilizers account for the remaining portion. This shift towards specialty products reflects the industry's response to growing demands for more efficient nutrient delivery systems and environmentally conscious farming practices, though conventional fertilizers continue to maintain their stronghold with a 90.8% share in field crop applications.
A critical challenge facing the industry is the widespread potassium deficiency in agricultural soils, with approximately 20% of global agricultural lands experiencing severe deficiency. The situation is particularly acute in Southeast Asia, where 44% of agricultural soils face potassium deficiency, highlighting the crucial role of potash fertilizers in addressing these nutritional gaps. This has led to an increased focus on developing region-specific fertilizer formulations that can effectively address local soil conditions while maintaining crop productivity.
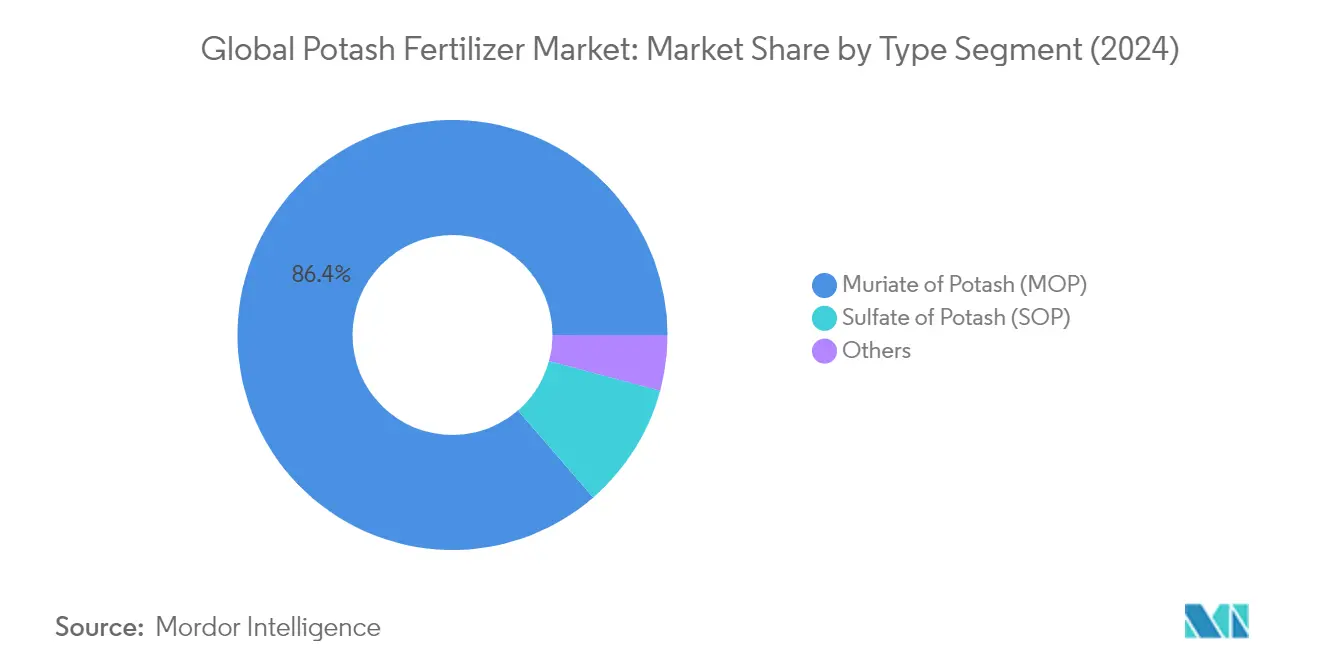
The market is characterized by a clear differentiation between two primary product categories: MOP fertilizer and Sulfate of Potash (SOP), each serving distinct agricultural needs. MOP fertilizer, containing the highest potassium content at 60-62%, has established itself as the industry standard for broad agricultural applications, while SOP, with its 50% potassium content, has carved out a premium niche for chloride-sensitive crops despite commanding higher prices. This price differential has created a two-tier market structure, with MOP serving as the volume driver while SOP caters to high-value specialty applications. The MOP fertilizer composition is critical in determining its application and effectiveness in various agricultural settings.
Furthermore, the potash price forecast remains a key consideration for stakeholders as they navigate the evolving market dynamics. Companies like The Mosaic Company and Nutrien Ltd continue to influence the potash market through strategic initiatives and product innovations, positioning themselves as leading potash fertilizer companies.
Global Potash Fertilizer Market Trends
The rising pressure on the agriculture industry to meet the growing demand for food is expected to increase the area under field crop cultivation
- The global agricultural sector is currently facing many challenges. According to the UN, the world population will likely exceed nine billion by 2050. This population growth may overburden the agricultural industry, which is already experiencing an output loss due to a lack of laborers and the shrinkage of agricultural fields caused by rising urbanization. According to the Food and Agriculture Organization, 70% of the global population is expected to live in cities by 2050. Due to the global loss of arable land, farmers now need to utilize more fertilizers to increase crop yields.
- Asia-Pacific is the world's largest producer of agricultural products. Agriculture is critical to the region's economy, as it employs about 20% of the total available workforce. Field crop cultivation dominates the region, accounting for about more than 95% of the total crop area in the region. Rice, wheat, and corn are the major field crops produced in the region, together accounting for about 24.3% of the total crop area in 2022.
- North America ranks as the second-largest arable region globally. Its farms cultivate a diverse range of crops, with a focus on field crops. Notably, corn, cotton, rice, soybean, and wheat are the prominent field crops, as highlighted by the USDA. In 2022, the United States commanded 46.2% of North America's crop cultivation area. However, the country witnessed a significant drop in crop acreage between 2017 and 2019, primarily due to adverse environmental conditions, leading to severe flooding in regions like Texas and Houston.

Understand The Key Trends Shaping This Market
Download PDF
Potassium activates the enzymes needed for plant growth and development
- Corn, rapeseed, cotton, sorghum, rice, wheat, and soybean are prominent crops globally, known for their high nutrient requirements. The average potassium application rates for these crops in 2022 were as follows: corn (196.8 kg/ha), rapeseed (248.6 kg/ha), cotton (164.3 kg/ha), sorghum (185.3 kg/ha), rice (67.9 kg/ha), wheat (96.4 kg/ha), and soybean (181.7 kg/ha). Potassium plays a major role in achieving the maximum economic yield, as part of a balanced approach to crop nutrition, as well as influencing crop quality.
- The average application rate for potassium in field crops stood at 150.3 kg/ha in 2022. The rapeseed had the highest potassium application rate recorded at 248.6 kg/ha. In the case of acute potassium deficiency, the leaves of rapeseed show marginal or interveinal chlorosis followed by patches of necrosis. It will also lead to greater drought susceptibility, increased lodging, reduced photosynthesis, and restricted movement of water and nutrients around the plant.
- According to University College London, The researchers reported that globally, about 20% of agricultural soils face severe potassium deficiency, with particular regions likely to experience more critical shortages, including 44% of agricultural soils in Southeast Asia, 30% in Sub-Saharan Africa, and 20% in East Asia which will further drive the potash fertilizers usage.
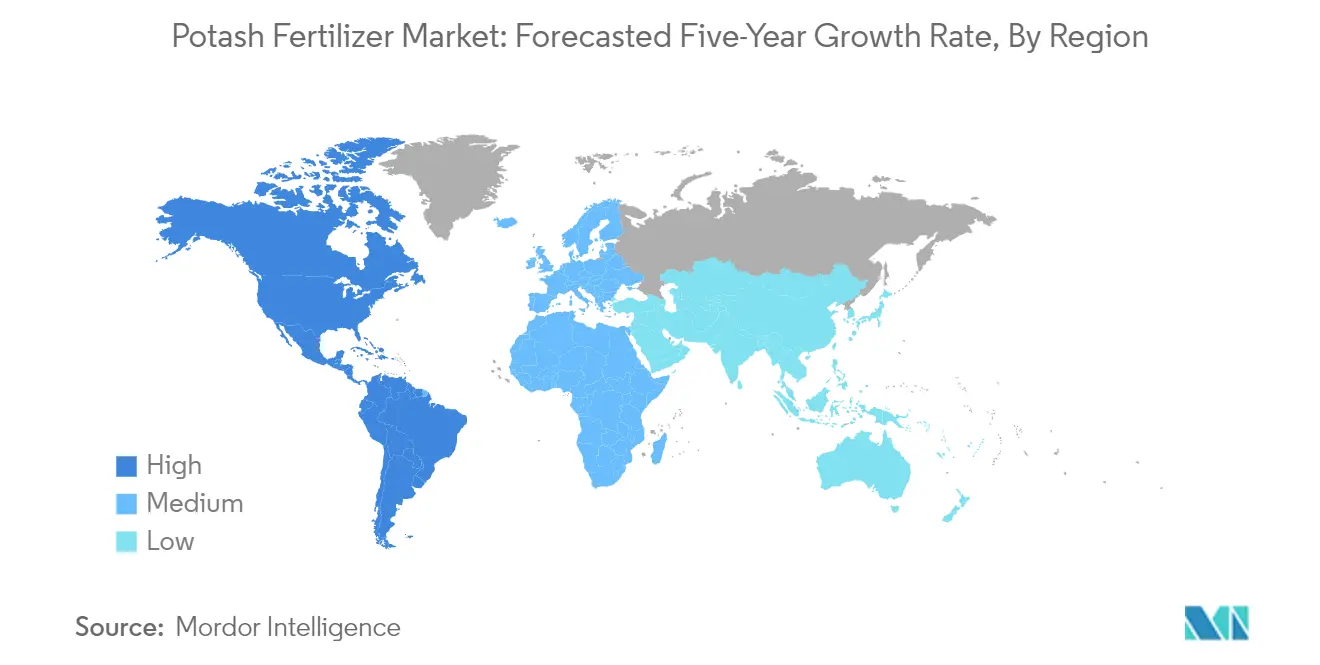
- The cultivation area for field crops is expanding globally, with notable growth in South America and Asia-Pacific. These regions are emerging as key markets for fertilizers. Developed regions like Europe and North America and areas grappling with nutrient deficiencies are increasingly adopting specialty fertilizers for their efficacy. These trends are expected to fuel the potash fertilizers market during 2023-2030.

OTHER KEY INDUSTRY TRENDS COVERED IN THE REPORT
- The expansion of horticulture crop cultivation is driven by higher economic returns and increasing demand for fruits and vegetables
- Tomatoes, cauliflower, garlic, and onions are the leading vegetable crops globally, with the highest consumption of potash fertilizers per hectare
- Potassium activates the enzymes needed for plant growth and development
- Asia-Pacific occupied the majority of the irrigation area globally, accounting for 66.8% in 2022
Segment Analysis: Type
Muriate of Potash (MOP) Segment in Global Potash Fertilizer Market
Muriate of Potash (MOP) dominates the global potash fertilizer market, commanding approximately 85% of the market share in 2024. This dominance can be attributed to its high potassium content of 60-62%, making it the most concentrated form of potassium fertilizer available. MOP fertilizer contains a significant amount of potassium chloride, which contributes to its widespread adoption. MOP's competitive pricing compared to other potassium-rich alternatives and its effectiveness in chloride-loving crops such as sugar beets, corn, celery, and Swiss chard further drive its market position. Additionally, when present at optimal levels, the chloride content in MOP provides natural protection against fungal diseases in plants. The segment's strong market position is particularly evident in Asia-Pacific, where it accounts for nearly 31% of regional consumption, followed closely by South America at approximately 31% market share.
Sulfate of Potash (SOP) Segment in Global Potash Fertilizer Market
The Sulfate of Potash (SOP) segment is experiencing robust growth in the global potash fertilizer market, with an expected growth rate of approximately 6% during 2024-2029. This growth is primarily driven by its superior characteristics, including a 50% potassium content and an additional 18% sulfur content, which effectively addresses sulfur deficiencies in crops while eliminating the need for supplementary sulfur applications. SOP's chloride-free nature makes it particularly valuable for chloride-sensitive crops, and its low salinity index has made it increasingly popular in regions prone to soil salinity issues. The segment's growth is further supported by its ability to enhance crop quality, improve pest resistance, and boost drought resilience, making it an increasingly preferred choice among farmers focusing on high-value crops and sustainable agricultural practices.
Remaining Segments in Potash Fertilizer Market
The remaining segments in the potash fertilizer market include specialty products like Langbeinite and Carnallite, which serve specific agricultural needs. Langbeinite, also known as potassium magnesium sulfate, offers the unique advantage of providing both potassium and magnesium in a single product, making it particularly valuable for crops requiring both nutrients. Its neutral pH characteristics make it especially suitable for maintaining soil balance. Carnallite, a hydrated potassium magnesium chloride, serves as an alternative source of potassium while providing additional magnesium and chlorine benefits. These specialty segments play a crucial role in meeting specific crop requirements and soil conditions where traditional potash fertilizers may not be optimal.
Segment Analysis: Application Mode
Soil Application Segment in Potash Fertilizer Market
Soil application continues to dominate the global potash fertilizer market, commanding approximately 91% of the total market value in 2024. This traditional method of fertilizer application remains the most widely adopted approach due to its cost-effectiveness and simplicity in implementation. The segment's dominance is particularly evident in field crops, which account for nearly 87% of soil-applied potash fertilizers. Broadcasting, band placement, and drill application are the primary methods employed within this segment. The widespread preference for soil application can be attributed to its inexpensive nature and the ability to perform applications without heavy equipment requirements. However, the segment faces certain challenges, including non-uniform distribution of fertilizers and potential nutrient losses through leaching, volatilization, and denitrification processes.
Fertigation Segment in Potash Fertilizer Market
The fertigation segment is experiencing rapid growth in the potash fertilizer market, driven by its superior efficiency in nutrient delivery and water conservation benefits. This application method, which combines irrigation and fertilization, is particularly well-suited for specialty potassic fertilizers, with water-soluble fertilizers dominating approximately 53% of the fertigation segment. The growth is further supported by the increasing adoption of precision farming techniques and the rising popularity of drip irrigation systems globally. Fertigation offers numerous advantages, including consistent nutrient supply, reduced soil nutrient fluctuations, and the ability to precisely tailor nutrient application to crop needs. The segment's expansion is also bolstered by its effectiveness in protected cultivation systems and high-value crop production.
Remaining Segments in Application Mode
The foliar application segment represents a crucial component of the potash fertilizer market, offering unique advantages in nutrient delivery. This method involves direct application of fertilizers to plant leaves, enhancing nutrient use efficiency and enabling quick crop response due to direct absorption through the plant's vascular system. Liquid fertilizers dominate the foliar segment, followed by water-soluble fertilizers, with their adoption particularly strong in situations requiring rapid nutrient correction or when soil conditions limit nutrient uptake. The method's effectiveness is particularly notable in addressing specific nutrient deficiencies during critical growth stages, though its application requires careful consideration of environmental conditions such as wind speed and humidity.
Segment Analysis: Crop Type
Field Crops Segment in Potash Fertilizer Market
Field crops constitute the dominant segment in the global potash fertilizer market, commanding approximately 86% of the market share in 2024. This substantial market presence is primarily attributed to the extensive cultivation area dedicated to field crops like corn, rapeseed, cotton, sorghum, rice, wheat, and soybean, which collectively require significant potassium inputs for optimal growth. These crops demonstrate particularly high nutrient requirements, with average potassium application rates reaching notable levels - corn (197 kg/ha), rapeseed (249 kg/ha), cotton (164 kg/ha), and sorghum (185 kg/ha). The segment's dominance is further reinforced by the critical role of potassium in achieving maximum economic yield and influencing crop quality. Additionally, the segment's growth is driven by increasing awareness about balanced plant nutrition and the pressing need to address potassium deficiencies, which affect approximately 20% of agricultural soils globally, with particularly severe shortages in Southeast Asia (44%), Sub-Saharan Africa (30%), and East Asia (20%).
Turf & Ornamental Segment in Potash Fertilizer Market
The turf and ornamental segment is emerging as the fastest-growing category in the potash fertilizer market, driven by the increasing number of gardens, golf courses, and the overall development of the tourism industry. The segment's growth is particularly notable in Europe, which leads the market with a significant share in the turf and ornamental potash fertilizers segment. The region's focus on flower production and ornamental plant cultivation has positioned it as a global leader, accounting for a substantial portion of the world's flower production area and global flower and pot-plant production. The segment's expansion is further supported by the rising adoption of specialty fertilizers, with liquid fertilizers claiming the largest share at 51.3%, followed by water-soluble variants at 48.7%. The growth is also attributed to the increasing implementation of protected cultivation systems and the growing demand for high-quality ornamental plants in both commercial and residential landscapes.
Remaining Segments in Crop Type
The horticultural crops segment represents a significant portion of the potash fertilizer market, characterized by its unique requirements and application patterns. This segment is particularly important in regions with intensive fruit and vegetable production, where potassium plays a crucial role in improving produce quality, flavor, and storage life. Horticultural crops typically require more precise nutrient management due to their high-value nature and specific quality requirements. The segment's dynamics are influenced by the growing trend toward protected cultivation, increasing demand for premium quality produce, and the rising adoption of precision farming techniques. The segment also benefits from the increasing awareness about the importance of balanced nutrition in horticultural production and the growing trend toward sustainable agricultural practices.
Potash Fertilizer Market Geography Segment Analysis
Potash Fertilizer Market in Asia-Pacific
The Asia-Pacific region dominates the potash fertilizer market, with a robust agricultural landscape marked by diverse crop cultivation patterns. Countries like India, China, and Indonesia are leading consumers, driven by their extensive agricultural activities and government support for fertilizer usage. The region's potash market is characterized by a strong focus on field crops, particularly rice, wheat, and corn, which collectively account for a significant portion of the total crop area. The market dynamics are further shaped by the increasing adoption of modern farming practices and growing awareness about balanced nutrient application.
Potash Fertilizer Market in India
India emerges as the largest market in the Asia-Pacific region, commanding approximately 29% of the regional market share in 2024. The country's dominance is attributed to its vast agricultural land base and government policies supporting fertilizer usage. India's agricultural sector heavily relies on potash fertilizer, particularly for field crops, which account for nearly 90% of the total consumption. The market is characterized by a strong preference for conventional muriate of potash, which has established itself as the primary source of potassium for Indian farmers. The government's focus on achieving food security and improving crop yields continues to drive the demand for potash fertilizers across various agricultural regions.
Potash Fertilizer Market in Vietnam
Vietnam represents the fastest-growing market in the Asia-Pacific region, with a projected CAGR of approximately 5% during 2024-2029. The country's agricultural sector is undergoing rapid modernization, with increasing adoption of advanced farming techniques and balanced fertilization practices. Vietnam's focus on high-value crops and export-oriented agriculture has been a key driver for potash fertilizer demand. The market is seeing a gradual shift towards specialty fertilizers, although conventional products still dominate. The government's support for agricultural development and efforts to improve crop productivity have created a favorable environment for market growth.
Potash Fertilizer Market in Europe
Europe represents a mature market for potash fertilizers, characterized by advanced agricultural practices and strong environmental regulations. The region's market is driven by the need for sustainable agriculture and optimal nutrient management. Countries like France, Germany, and Russia play pivotal roles in both the production and consumption of potash fertilizers. The market is marked by high adoption rates of precision farming techniques and an increasing focus on specialty fertilizers for improved nutrient use efficiency.
Potash Fertilizer Market in France
France stands as the largest potash fertilizer market in Europe, holding approximately 10% of the regional market share in 2024. The country's strong position is supported by its large agricultural sector and advanced farming practices. French agriculture is characterized by a diverse crop portfolio, with field crops dominating the consumption pattern. The market shows a strong preference for both conventional and specialty potash fertilizers, driven by the need for sustainable and efficient nutrient management practices.
Potash Fertilizer Market in Turkey
Turkey emerges as the fastest-growing market in Europe, with a projected CAGR of approximately 8% during 2024-2029. The country's agricultural sector is undergoing significant transformation with increasing adoption of modern farming techniques. Turkey's strategic position and growing focus on agricultural exports have been key drivers for market growth. The government's support for agricultural modernization and efforts to improve crop yields have created a strong foundation for sustained market expansion.
Potash Fertilizer Market in Middle East & Africa
The Middle East & Africa region presents a diverse market landscape for potash fertilizers, with varying agricultural practices and consumption patterns across countries. Saudi Arabia emerges as the largest market in the region, driven by its focus on agricultural self-sufficiency and modern farming techniques. Turkey stands out as the fastest-growing market, supported by its robust agricultural sector and government initiatives. The region's market is characterized by increasing adoption of advanced irrigation systems and a growing focus on horticultural crops, particularly in countries like South Africa and Nigeria.
Potash Fertilizer Market in North America
The North American potash fertilizer market is characterized by advanced agricultural practices and high technology adoption rates. The United States dominates as both the largest and fastest-growing market in the region, followed by Canada and Mexico. The region's market is driven by extensive field crop cultivation and increasing adoption of precision farming techniques. The strong presence of major manufacturers and well-established distribution networks further strengthens the market dynamics.
Potash Fertilizer Market in South America
South America represents a significant market for potash fertilizers, with Brazil emerging as the largest market and Argentina showing the fastest growth potential. The region's agricultural sector is characterized by large-scale farming operations, particularly in soybean and corn production. The market is driven by increasing adoption of modern farming practices and growing awareness about balanced nutrient application. Government support for agricultural development and expanding export-oriented agriculture continue to shape the market dynamics.
Get Analysis on Important Geographic Markets
Download PDF
Potash Fertilizer Industry Overview
Top Companies in Potash Fertilizer Market
The potash fertilizer market is characterized by companies actively pursuing innovation and strategic expansion initiatives. Manufacturers are increasingly focusing on developing enhanced nutrient-efficient products through collaborative research partnerships, as exemplified by ventures between established players and agricultural technology firms. Operational agility has become paramount, with potash fertilizer companies investing in vertically integrated supply chains spanning mining, production, logistics, and distribution networks. Strategic moves predominantly revolve around geographical expansion through acquisitions and joint ventures, particularly in emerging markets with growing agricultural sectors. Companies are also emphasizing sustainability and environmental stewardship, developing products with improved absorption rates and reduced environmental impact while simultaneously strengthening their digital capabilities to provide comprehensive crop nutrition solutions.
Consolidated Market Led By Global Players
The potash fertilizer market exhibits a high degree of consolidation, dominated by large multinational corporations with extensive global footprints. These industry leaders leverage their integrated operations, from raw material extraction to end-product distribution, creating significant barriers to entry for new players. The market structure favors established companies with strong backward integration into mining operations and forward integration into distribution networks. Regional players maintain their presence through specialized product offerings and deep local market knowledge, though their influence remains limited compared to global conglomerates.
The industry has witnessed substantial merger and acquisition activity, primarily driven by the need to secure raw material sources and expand geographical presence. Major players are increasingly pursuing strategic partnerships and joint ventures to strengthen their market positions and access new territories. These consolidation trends are particularly evident in emerging markets, where established companies seek to capitalize on growing agricultural sectors and increasing demand for specialized fertilizer products. The competitive dynamics are further shaped by companies' abilities to maintain cost leadership while investing in research and development capabilities.
Innovation and Sustainability Drive Future Success
For incumbent companies to maintain and expand their market share, focus must be placed on developing innovative product formulations and sustainable production practices. Success increasingly depends on the ability to offer comprehensive crop nutrition solutions rather than standalone products, requiring investments in research and development capabilities. Companies must also strengthen their distribution networks and customer relationships through digital platforms and advisory services. Building resilient supply chains and maintaining cost competitiveness while meeting environmental standards will be crucial for long-term success.
New entrants and smaller players can gain ground by focusing on specialized market segments and developing niche products for specific crop types or regional requirements. Success factors include building strong relationships with local farming communities and offering tailored solutions supported by technical expertise. Companies must also navigate the complex regulatory landscape, particularly regarding environmental protection and product safety standards. The ability to adapt to changing agricultural practices and emerging sustainability requirements while maintaining product quality and reliability will be essential for market success. Strategic partnerships with established players or technology providers can provide viable pathways for market entry and growth. The potash manufacturer agtech industry is poised to play a crucial role in these developments, offering technological advancements that enhance productivity and sustainability.
Potash Fertilizer Market Leaders
-
EuroChem Group
-
K+S Aktiengesellschaft
-
Nutrien Ltd.
-
Sinofert Holdings Limited
-
The Mosaic Company
- *Disclaimer: Major Players sorted in no particular order

Need More Details on Market Players and Competitors?
Download PDF
Potash Fertilizer Market News
- April 2023: K+S acquired a 75% share of the fertilizer business of a South African trading company, Industrial Commodities Holdings (Pty) Ltd (ICH). In addition to expanding the core business, K+S is strengthening its operations in southern and eastern Africa as a result of this acquisition. The newly acquired fertilizer business in the future is to be operated in a joint venture under the name of FertivPty Ltd.
- March 2022: EuroChem Group has purchased 51.48% of the shares of the Brazilian distributor Fertilizantes Heringer SA, this purchase will further strengthen its production and distribution capacity in Brazil.
- February 2022: Sinochem Fertilizer Macao Limited and Arab Potash Company PLC (“APC”) signed their Memorandum of Understanding (“MOU”). By the Memorandum of Understanding, from 2023 to 2025 Sinochem Fertilizer will still be China's exclusive marketing company for APC potash.
Free With This Report
Along with the report, We also offer a comprehensive and exhaustive data pack with 25+ graphs on area under cultivation and average application rate per hectare. The data pack includes Globe, North America, Europe, Asia-Pacific, South America, and Africa.


Potash Fertilizer Market Report - Table of Contents
1. EXECUTIVE SUMMARY & KEY FINDINGS
2. REPORT OFFERS
3. INTRODUCTION
- 3.1 Study Assumptions & Market Definition
- 3.2 Scope of the Study
- 3.3 Research Methodology
4. KEY INDUSTRY TRENDS
-
4.1 Acreage Of Major Crop Types
- 4.1.1 Field Crops
- 4.1.2 Horticultural Crops
-
4.2 Average Nutrient Application Rates
- 4.2.1 Primary Nutrients
- 4.2.1.1 Field Crops
- 4.2.1.2 Horticultural Crops
- 4.3 Agricultural Land Equipped For Irrigation
- 4.4 Regulatory Framework
- 4.5 Value Chain & Distribution Channel Analysis
5. MARKET SEGMENTATION (includes market size in Value in USD and Volume, Forecasts up to 2030 and analysis of growth prospects)
-
5.1 Type
- 5.1.1 Straight
- 5.1.1.1 Potassic
- 5.1.1.1.1 MoP
- 5.1.1.1.2 SoP
- 5.1.1.1.3 Others
-
5.2 Application Mode
- 5.2.1 Fertigation
- 5.2.2 Foliar
- 5.2.3 Soil
-
5.3 Crop Type
- 5.3.1 Field Crops
- 5.3.2 Horticultural Crops
- 5.3.3 Turf & Ornamental
-
5.4 Region
- 5.4.1 Asia-Pacific
- 5.4.1.1 Australia
- 5.4.1.2 Bangladesh
- 5.4.1.3 China
- 5.4.1.4 India
- 5.4.1.5 Indonesia
- 5.4.1.6 Japan
- 5.4.1.7 Pakistan
- 5.4.1.8 Philippines
- 5.4.1.9 Thailand
- 5.4.1.10 Vietnam
- 5.4.1.11 Rest of Asia-Pacific
- 5.4.2 Europe
- 5.4.2.1 France
- 5.4.2.2 Germany
- 5.4.2.3 Italy
- 5.4.2.4 Netherlands
- 5.4.2.5 Russia
- 5.4.2.6 Spain
- 5.4.2.7 Ukraine
- 5.4.2.8 United Kingdom
- 5.4.2.9 Rest of Europe
- 5.4.3 Middle East & Africa
- 5.4.3.1 Nigeria
- 5.4.3.2 Saudi Arabia
- 5.4.3.3 South Africa
- 5.4.3.4 Turkey
- 5.4.3.5 Rest of Middle East & Africa
- 5.4.4 North America
- 5.4.4.1 Canada
- 5.4.4.2 Mexico
- 5.4.4.3 United States
- 5.4.4.4 Rest of North America
- 5.4.5 South America
- 5.4.5.1 Argentina
- 5.4.5.2 Brazil
- 5.4.5.3 Rest of South America
6. COMPETITIVE LANDSCAPE
- 6.1 Key Strategic Moves
- 6.2 Market Share Analysis
- 6.3 Company Landscape
-
6.4 Company Profiles
- 6.4.1 Coromandel International Ltd.
- 6.4.2 EuroChem Group
- 6.4.3 Intrepid Potash Inc.
- 6.4.4 K+S Aktiengesellschaft
- 6.4.5 Nutrien Ltd.
- 6.4.6 Sinofert Holdings Limited
- 6.4.7 Sociedad Quimica y Minera de Chile SA
- 6.4.8 The Mosaic Company
- *List Not Exhaustive
7. KEY STRATEGIC QUESTIONS FOR FERTILIZER CEOS
8. APPENDIX
-
8.1 Global Overview
- 8.1.1 Overview
- 8.1.2 Porter’s Five Forces Framework
- 8.1.3 Global Value Chain Analysis
- 8.1.4 Market Dynamics (DROs)
- 8.2 Sources & References
- 8.3 List of Tables & Figures
- 8.4 Primary Insights
- 8.5 Data Pack
- 8.6 Glossary of Terms
You Can Purchase Parts Of This Report. Check Out Prices For Specific Sections
Get Price Break-up Now
List of Tables & Figures
- Figure 1:
- CULTIVATION OF FIELD CROPS IN HECTARE, GLOBAL, 2017 - 2022
- Figure 2:
- CULTIVATION OF HORTICULTURAL CROPS IN HECTARE, GLOBAL, 2017 - 2022
- Figure 3:
- CONSUMPTION OF PRIMARY NUTRIENTS BY FIELD CROPS IN KG/HECTARE, GLOBAL, 2022
- Figure 4:
- CONSUMPTION OF PRIMARY NUTRIENTS BY HORTICULTURAL CROPS IN KG/HECTARE, GLOBAL, 2022
- Figure 5:
- AGRICULTURAL LAND EQUIPPED FOR IRRIGATION IN HECTARE, GLOBAL, 2022
- Figure 6:
- POTASSIC FERTILIZER CONSUMPTION IN METRIC TON, GLOBAL, 2017 - 2030
- Figure 7:
- POTASSIC FERTILIZER CONSUMPTION IN USD, GLOBAL, 2017 - 2030
- Figure 8:
- POTASSIC FERTILIZER CONSUMPTION BY PRODUCT IN METRIC TON, GLOBAL, 2017 - 2030
- Figure 9:
- POTASSIC FERTILIZER CONSUMPTION BY PRODUCT IN USD, GLOBAL, 2017 - 2030
- Figure 10:
- POTASSIC FERTILIZER CONSUMPTION VOLUME BY PRODUCT IN %, GLOBAL, 2017 VS 2023 VS 2030
- Figure 11:
- POTASSIC FERTILIZER CONSUMPTION VALUE BY PRODUCT IN %, GLOBAL, 2017 VS 2023 VS 2030
- Figure 12:
- MOP FERTILIZER CONSUMPTION IN METRIC TON, GLOBAL, 2017 - 2030
- Figure 13:
- MOP FERTILIZER CONSUMPTION IN USD, GLOBAL, 2017 - 2030
- Figure 14:
- MOP FERTILIZER CONSUMPTION VALUE BY CROP TYPE IN %, GLOBAL, 2023 VS 2030
- Figure 15:
- SOP FERTILIZER CONSUMPTION IN METRIC TON, GLOBAL, 2017 - 2030
- Figure 16:
- SOP FERTILIZER CONSUMPTION IN USD, GLOBAL, 2017 - 2030
- Figure 17:
- SOP FERTILIZER CONSUMPTION VALUE BY CROP TYPE IN %, GLOBAL, 2023 VS 2030
- Figure 18:
- OTHERS FERTILIZER CONSUMPTION IN METRIC TON, GLOBAL, 2017 - 2030
- Figure 19:
- OTHERS FERTILIZER CONSUMPTION IN USD, GLOBAL, 2017 - 2030
- Figure 20:
- OTHERS FERTILIZER CONSUMPTION VALUE BY CROP TYPE IN %, GLOBAL, 2023 VS 2030
- Figure 21:
- POTASSIC POTASSIC FERTILIZER CONSUMPTION BY APPLICATION MODE IN METRIC TON, GLOBAL, 2017 - 2030
- Figure 22:
- POTASSIC POTASSIC FERTILIZER CONSUMPTION BY APPLICATION MODE IN USD, GLOBAL, 2017 - 2030
- Figure 23:
- POTASSIC POTASSIC FERTILIZER CONSUMPTION VOLUME BY APPLICATION MODE IN %, GLOBAL, 2017 VS 2023 VS 2030
- Figure 24:
- POTASSIC POTASSIC FERTILIZER CONSUMPTION VALUE BY APPLICATION MODE IN %, GLOBAL, 2017 VS 2023 VS 2030
- Figure 25:
- FERTIGATION APPLICATION OF POTASSIC FERTILIZER IN METRIC TON, GLOBAL, 2017 - 2030
- Figure 26:
- FERTIGATION APPLICATION OF POTASSIC FERTILIZER IN USD, GLOBAL, 2017 - 2030
- Figure 27:
- FERTIGATION APPLICATION OF POTASSIC FERTILIZER IN VALUE BY CROP TYPE IN %, GLOBAL, 2023 VS 2030
- Figure 28:
- FOLIAR APPLICATION OF POTASSIC FERTILIZER IN METRIC TON, GLOBAL, 2017 - 2030
- Figure 29:
- FOLIAR APPLICATION OF POTASSIC FERTILIZER IN USD, GLOBAL, 2017 - 2030
- Figure 30:
- FOLIAR APPLICATION OF POTASSIC FERTILIZER IN VALUE BY CROP TYPE IN %, GLOBAL, 2023 VS 2030
- Figure 31:
- SOIL APPLICATION OF POTASSIC FERTILIZER IN METRIC TON, GLOBAL, 2017 - 2030
- Figure 32:
- SOIL APPLICATION OF POTASSIC FERTILIZER IN USD, GLOBAL, 2017 - 2030
- Figure 33:
- SOIL APPLICATION OF POTASSIC FERTILIZER IN VALUE BY CROP TYPE IN %, GLOBAL, 2023 VS 2030
- Figure 34:
- POTASSIC POTASSIC FERTILIZER CONSUMPTION BY CROP TYPE IN METRIC TON, GLOBAL, 2017 - 2030
- Figure 35:
- POTASSIC POTASSIC FERTILIZER CONSUMPTION BY CROP TYPE IN USD, GLOBAL, 2017 - 2030
- Figure 36:
- POTASSIC POTASSIC FERTILIZER CONSUMPTION VOLUME BY CROP TYPE IN %, GLOBAL, 2017 VS 2023 VS 2030
- Figure 37:
- POTASSIC POTASSIC FERTILIZER CONSUMPTION VALUE BY CROP TYPE IN %, GLOBAL, 2017 VS 2023 VS 2030
- Figure 38:
- POTASSIC FERTILIZER CONSUMPTION BY FIELD CROPS IN METRIC TON, GLOBAL, 2017 - 2030
- Figure 39:
- POTASSIC FERTILIZER CONSUMPTION BY FIELD CROPS IN USD, GLOBAL, 2017 - 2030
- Figure 40:
- POTASSIC FERTILIZER CONSUMPTION VALUE BY PRODUCT IN %, GLOBAL, 2023 VS 2030
- Figure 41:
- POTASSIC FERTILIZER CONSUMPTION BY HORTICULTURAL CROPS IN METRIC TON, GLOBAL, 2017 - 2030
- Figure 42:
- POTASSIC FERTILIZER CONSUMPTION BY HORTICULTURAL CROPS IN USD, GLOBAL, 2017 - 2030
- Figure 43:
- POTASSIC FERTILIZER CONSUMPTION VALUE BY PRODUCT IN %, GLOBAL, 2023 VS 2030
- Figure 44:
- POTASSIC FERTILIZER CONSUMPTION BY TURF & ORNAMENTAL IN METRIC TON, GLOBAL, 2017 - 2030
- Figure 45:
- POTASSIC FERTILIZER CONSUMPTION BY TURF & ORNAMENTAL IN USD, GLOBAL, 2017 - 2030
- Figure 46:
- POTASSIC FERTILIZER CONSUMPTION VALUE BY PRODUCT IN %, GLOBAL, 2023 VS 2030
- Figure 47:
- POTASSIC POTASSIC FERTILIZER CONSUMPTION BY REGION IN METRIC TON, GLOBAL, 2017 - 2030
- Figure 48:
- POTASSIC POTASSIC FERTILIZER CONSUMPTION BY REGION IN USD, GLOBAL, 2017 - 2030
- Figure 49:
- POTASSIC POTASSIC FERTILIZER CONSUMPTION VOLUME BY REGION IN %, GLOBAL, 2017 VS 2023 VS 2030
- Figure 50:
- POTASSIC POTASSIC FERTILIZER CONSUMPTION VALUE BY REGION IN %, GLOBAL, 2017 VS 2023 VS 2030
- Figure 51:
- POTASSIC POTASSIC FERTILIZER CONSUMPTION BY COUNTRY IN METRIC TON, ASIA-PACIFIC, 2017 - 2030
- Figure 52:
- POTASSIC POTASSIC FERTILIZER CONSUMPTION BY COUNTRY IN USD, ASIA-PACIFIC, 2017 - 2030
- Figure 53:
- POTASSIC POTASSIC FERTILIZER CONSUMPTION VOLUME BY COUNTRY IN %, ASIA-PACIFIC, 2017 VS 2023 VS 2030
- Figure 54:
- POTASSIC POTASSIC FERTILIZER CONSUMPTION VALUE BY COUNTRY IN %, ASIA-PACIFIC, 2017 VS 2023 VS 2030
- Figure 55:
- POTASSIC FERTILIZER CONSUMPTION IN METRIC TON, AUSTRALIA, 2017 - 2030
- Figure 56:
- POTASSIC FERTILIZER CONSUMPTION IN USD, AUSTRALIA, 2017 - 2030
- Figure 57:
- POTASSIC FERTILIZER CONSUMPTION VALUE BY CROP TYPE IN %, AUSTRALIA, 2023 VS 2030
- Figure 58:
- POTASSIC FERTILIZER CONSUMPTION IN METRIC TON, BANGLADESH, 2017 - 2030
- Figure 59:
- POTASSIC FERTILIZER CONSUMPTION IN USD, BANGLADESH, 2017 - 2030
- Figure 60:
- POTASSIC FERTILIZER CONSUMPTION VALUE BY CROP TYPE IN %, BANGLADESH, 2023 VS 2030
- Figure 61:
- POTASSIC FERTILIZER CONSUMPTION IN METRIC TON, CHINA, 2017 - 2030
- Figure 62:
- POTASSIC FERTILIZER CONSUMPTION IN USD, CHINA, 2017 - 2030
- Figure 63:
- POTASSIC FERTILIZER CONSUMPTION VALUE BY CROP TYPE IN %, CHINA, 2023 VS 2030
- Figure 64:
- POTASSIC FERTILIZER CONSUMPTION IN METRIC TON, INDIA, 2017 - 2030
- Figure 65:
- POTASSIC FERTILIZER CONSUMPTION IN USD, INDIA, 2017 - 2030
- Figure 66:
- POTASSIC FERTILIZER CONSUMPTION VALUE BY CROP TYPE IN %, INDIA, 2023 VS 2030
- Figure 67:
- POTASSIC FERTILIZER CONSUMPTION IN METRIC TON, INDONESIA, 2017 - 2030
- Figure 68:
- POTASSIC FERTILIZER CONSUMPTION IN USD, INDONESIA, 2017 - 2030
- Figure 69:
- POTASSIC FERTILIZER CONSUMPTION VALUE BY CROP TYPE IN %, INDONESIA, 2023 VS 2030
- Figure 70:
- POTASSIC FERTILIZER CONSUMPTION IN METRIC TON, JAPAN, 2017 - 2030
- Figure 71:
- POTASSIC FERTILIZER CONSUMPTION IN USD, JAPAN, 2017 - 2030
- Figure 72:
- POTASSIC FERTILIZER CONSUMPTION VALUE BY CROP TYPE IN %, JAPAN, 2023 VS 2030
- Figure 73:
- POTASSIC FERTILIZER CONSUMPTION IN METRIC TON, PAKISTAN, 2017 - 2030
- Figure 74:
- POTASSIC FERTILIZER CONSUMPTION IN USD, PAKISTAN, 2017 - 2030
- Figure 75:
- POTASSIC FERTILIZER CONSUMPTION VALUE BY CROP TYPE IN %, PAKISTAN, 2023 VS 2030
- Figure 76:
- POTASSIC FERTILIZER CONSUMPTION IN METRIC TON, PHILIPPINES, 2017 - 2030
- Figure 77:
- POTASSIC FERTILIZER CONSUMPTION IN USD, PHILIPPINES, 2017 - 2030
- Figure 78:
- POTASSIC FERTILIZER CONSUMPTION VALUE BY CROP TYPE IN %, PHILIPPINES, 2023 VS 2030
- Figure 79:
- POTASSIC FERTILIZER CONSUMPTION IN METRIC TON, THAILAND, 2017 - 2030
- Figure 80:
- POTASSIC FERTILIZER CONSUMPTION IN USD, THAILAND, 2017 - 2030
- Figure 81:
- POTASSIC FERTILIZER CONSUMPTION VALUE BY CROP TYPE IN %, THAILAND, 2023 VS 2030
- Figure 82:
- POTASSIC FERTILIZER CONSUMPTION IN METRIC TON, VIETNAM, 2017 - 2030
- Figure 83:
- POTASSIC FERTILIZER CONSUMPTION IN USD, VIETNAM, 2017 - 2030
- Figure 84:
- POTASSIC FERTILIZER CONSUMPTION VALUE BY CROP TYPE IN %, VIETNAM, 2023 VS 2030
- Figure 85:
- POTASSIC FERTILIZER CONSUMPTION IN METRIC TON, REST OF ASIA-PACIFIC, 2017 - 2030
- Figure 86:
- POTASSIC FERTILIZER CONSUMPTION IN USD, REST OF ASIA-PACIFIC, 2017 - 2030
- Figure 87:
- POTASSIC FERTILIZER CONSUMPTION VALUE BY CROP TYPE IN %, REST OF ASIA-PACIFIC, 2023 VS 2030
- Figure 88:
- POTASSIC POTASSIC FERTILIZER CONSUMPTION BY COUNTRY IN METRIC TON, EUROPE, 2017 - 2030
- Figure 89:
- POTASSIC POTASSIC FERTILIZER CONSUMPTION BY COUNTRY IN USD, EUROPE, 2017 - 2030
- Figure 90:
- POTASSIC POTASSIC FERTILIZER CONSUMPTION VOLUME BY COUNTRY IN %, EUROPE, 2017 VS 2023 VS 2030
- Figure 91:
- POTASSIC POTASSIC FERTILIZER CONSUMPTION VALUE BY COUNTRY IN %, EUROPE, 2017 VS 2023 VS 2030
- Figure 92:
- POTASSIC FERTILIZER CONSUMPTION IN METRIC TON, FRANCE, 2017 - 2030
- Figure 93:
- POTASSIC FERTILIZER CONSUMPTION IN USD, FRANCE, 2017 - 2030
- Figure 94:
- POTASSIC FERTILIZER CONSUMPTION VALUE BY CROP TYPE IN %, FRANCE, 2023 VS 2030
- Figure 95:
- POTASSIC FERTILIZER CONSUMPTION IN METRIC TON, GERMANY, 2017 - 2030
- Figure 96:
- POTASSIC FERTILIZER CONSUMPTION IN USD, GERMANY, 2017 - 2030
- Figure 97:
- POTASSIC FERTILIZER CONSUMPTION VALUE BY CROP TYPE IN %, GERMANY, 2023 VS 2030
- Figure 98:
- POTASSIC FERTILIZER CONSUMPTION IN METRIC TON, ITALY, 2017 - 2030
- Figure 99:
- POTASSIC FERTILIZER CONSUMPTION IN USD, ITALY, 2017 - 2030
- Figure 100:
- POTASSIC FERTILIZER CONSUMPTION VALUE BY CROP TYPE IN %, ITALY, 2023 VS 2030
- Figure 101:
- POTASSIC FERTILIZER CONSUMPTION IN METRIC TON, NETHERLANDS, 2017 - 2030
- Figure 102:
- POTASSIC FERTILIZER CONSUMPTION IN USD, NETHERLANDS, 2017 - 2030
- Figure 103:
- POTASSIC FERTILIZER CONSUMPTION VALUE BY CROP TYPE IN %, NETHERLANDS, 2023 VS 2030
- Figure 104:
- POTASSIC FERTILIZER CONSUMPTION IN METRIC TON, RUSSIA, 2017 - 2030
- Figure 105:
- POTASSIC FERTILIZER CONSUMPTION IN USD, RUSSIA, 2017 - 2030
- Figure 106:
- POTASSIC FERTILIZER CONSUMPTION VALUE BY CROP TYPE IN %, RUSSIA, 2023 VS 2030
- Figure 107:
- POTASSIC FERTILIZER CONSUMPTION IN METRIC TON, SPAIN, 2017 - 2030
- Figure 108:
- POTASSIC FERTILIZER CONSUMPTION IN USD, SPAIN, 2017 - 2030
- Figure 109:
- POTASSIC FERTILIZER CONSUMPTION VALUE BY CROP TYPE IN %, SPAIN, 2023 VS 2030
- Figure 110:
- POTASSIC FERTILIZER CONSUMPTION IN METRIC TON, UKRAINE, 2017 - 2030
- Figure 111:
- POTASSIC FERTILIZER CONSUMPTION IN USD, UKRAINE, 2017 - 2030
- Figure 112:
- POTASSIC FERTILIZER CONSUMPTION VALUE BY CROP TYPE IN %, UKRAINE, 2023 VS 2030
- Figure 113:
- POTASSIC FERTILIZER CONSUMPTION IN METRIC TON, UNITED KINGDOM, 2017 - 2030
- Figure 114:
- POTASSIC FERTILIZER CONSUMPTION IN USD, UNITED KINGDOM, 2017 - 2030
- Figure 115:
- POTASSIC FERTILIZER CONSUMPTION VALUE BY CROP TYPE IN %, UNITED KINGDOM, 2023 VS 2030
- Figure 116:
- POTASSIC FERTILIZER CONSUMPTION IN METRIC TON, REST OF EUROPE, 2017 - 2030
- Figure 117:
- POTASSIC FERTILIZER CONSUMPTION IN USD, REST OF EUROPE, 2017 - 2030
- Figure 118:
- POTASSIC FERTILIZER CONSUMPTION VALUE BY CROP TYPE IN %, REST OF EUROPE, 2023 VS 2030
- Figure 119:
- POTASSIC POTASSIC FERTILIZER CONSUMPTION BY COUNTRY IN METRIC TON, MIDDLE EAST & AFRICA, 2017 - 2030
- Figure 120:
- POTASSIC POTASSIC FERTILIZER CONSUMPTION BY COUNTRY IN USD, MIDDLE EAST & AFRICA, 2017 - 2030
- Figure 121:
- POTASSIC POTASSIC FERTILIZER CONSUMPTION VOLUME BY COUNTRY IN %, MIDDLE EAST & AFRICA, 2017 VS 2023 VS 2030
- Figure 122:
- POTASSIC POTASSIC FERTILIZER CONSUMPTION VALUE BY COUNTRY IN %, MIDDLE EAST & AFRICA, 2017 VS 2023 VS 2030
- Figure 123:
- POTASSIC FERTILIZER CONSUMPTION IN METRIC TON, NIGERIA, 2017 - 2030
- Figure 124:
- POTASSIC FERTILIZER CONSUMPTION IN USD, NIGERIA, 2017 - 2030
- Figure 125:
- POTASSIC FERTILIZER CONSUMPTION VALUE BY CROP TYPE IN %, NIGERIA, 2023 VS 2030
- Figure 126:
- POTASSIC FERTILIZER CONSUMPTION IN METRIC TON, SAUDI ARABIA, 2017 - 2030
- Figure 127:
- POTASSIC FERTILIZER CONSUMPTION IN USD, SAUDI ARABIA, 2017 - 2030
- Figure 128:
- POTASSIC FERTILIZER CONSUMPTION VALUE BY CROP TYPE IN %, SAUDI ARABIA, 2023 VS 2030
- Figure 129:
- POTASSIC FERTILIZER CONSUMPTION IN METRIC TON, SOUTH AFRICA, 2017 - 2030
- Figure 130:
- POTASSIC FERTILIZER CONSUMPTION IN USD, SOUTH AFRICA, 2017 - 2030
- Figure 131:
- POTASSIC FERTILIZER CONSUMPTION VALUE BY CROP TYPE IN %, SOUTH AFRICA, 2023 VS 2030
- Figure 132:
- POTASSIC FERTILIZER CONSUMPTION IN METRIC TON, TURKEY, 2017 - 2030
- Figure 133:
- POTASSIC FERTILIZER CONSUMPTION IN USD, TURKEY, 2017 - 2030
- Figure 134:
- POTASSIC FERTILIZER CONSUMPTION VALUE BY CROP TYPE IN %, TURKEY, 2023 VS 2030
- Figure 135:
- POTASSIC FERTILIZER CONSUMPTION IN METRIC TON, REST OF MIDDLE EAST & AFRICA, 2017 - 2030
- Figure 136:
- POTASSIC FERTILIZER CONSUMPTION IN USD, REST OF MIDDLE EAST & AFRICA, 2017 - 2030
- Figure 137:
- POTASSIC FERTILIZER CONSUMPTION VALUE BY CROP TYPE IN %, REST OF MIDDLE EAST & AFRICA, 2023 VS 2030
- Figure 138:
- POTASSIC POTASSIC FERTILIZER CONSUMPTION BY COUNTRY IN METRIC TON, NORTH AMERICA, 2017 - 2030
- Figure 139:
- POTASSIC POTASSIC FERTILIZER CONSUMPTION BY COUNTRY IN USD, NORTH AMERICA, 2017 - 2030
- Figure 140:
- POTASSIC POTASSIC FERTILIZER CONSUMPTION VOLUME BY COUNTRY IN %, NORTH AMERICA, 2017 VS 2023 VS 2030
- Figure 141:
- POTASSIC POTASSIC FERTILIZER CONSUMPTION VALUE BY COUNTRY IN %, NORTH AMERICA, 2017 VS 2023 VS 2030
- Figure 142:
- POTASSIC FERTILIZER CONSUMPTION IN METRIC TON, CANADA, 2017 - 2030
- Figure 143:
- POTASSIC FERTILIZER CONSUMPTION IN USD, CANADA, 2017 - 2030
- Figure 144:
- POTASSIC FERTILIZER CONSUMPTION VALUE BY CROP TYPE IN %, CANADA, 2023 VS 2030
- Figure 145:
- POTASSIC FERTILIZER CONSUMPTION IN METRIC TON, MEXICO, 2017 - 2030
- Figure 146:
- POTASSIC FERTILIZER CONSUMPTION IN USD, MEXICO, 2017 - 2030
- Figure 147:
- POTASSIC FERTILIZER CONSUMPTION VALUE BY CROP TYPE IN %, MEXICO, 2023 VS 2030
- Figure 148:
- POTASSIC FERTILIZER CONSUMPTION IN METRIC TON, UNITED STATES, 2017 - 2030
- Figure 149:
- POTASSIC FERTILIZER CONSUMPTION IN USD, UNITED STATES, 2017 - 2030
- Figure 150:
- POTASSIC FERTILIZER CONSUMPTION VALUE BY CROP TYPE IN %, UNITED STATES, 2023 VS 2030
- Figure 151:
- POTASSIC FERTILIZER CONSUMPTION IN METRIC TON, REST OF NORTH AMERICA, 2017 - 2030
- Figure 152:
- POTASSIC FERTILIZER CONSUMPTION IN USD, REST OF NORTH AMERICA, 2017 - 2030
- Figure 153:
- POTASSIC FERTILIZER CONSUMPTION VALUE BY CROP TYPE IN %, REST OF NORTH AMERICA, 2023 VS 2030
- Figure 154:
- POTASSIC POTASSIC FERTILIZER CONSUMPTION BY COUNTRY IN METRIC TON, SOUTH AMERICA, 2017 - 2030
- Figure 155:
- POTASSIC POTASSIC FERTILIZER CONSUMPTION BY COUNTRY IN USD, SOUTH AMERICA, 2017 - 2030
- Figure 156:
- POTASSIC POTASSIC FERTILIZER CONSUMPTION VOLUME BY COUNTRY IN %, SOUTH AMERICA, 2017 VS 2023 VS 2030
- Figure 157:
- POTASSIC POTASSIC FERTILIZER CONSUMPTION VALUE BY COUNTRY IN %, SOUTH AMERICA, 2017 VS 2023 VS 2030
- Figure 158:
- POTASSIC FERTILIZER CONSUMPTION IN METRIC TON, ARGENTINA, 2017 - 2030
- Figure 159:
- POTASSIC FERTILIZER CONSUMPTION IN USD, ARGENTINA, 2017 - 2030
- Figure 160:
- POTASSIC FERTILIZER CONSUMPTION VALUE BY CROP TYPE IN %, ARGENTINA, 2023 VS 2030
- Figure 161:
- POTASSIC FERTILIZER CONSUMPTION IN METRIC TON, BRAZIL, 2017 - 2030
- Figure 162:
- POTASSIC FERTILIZER CONSUMPTION IN USD, BRAZIL, 2017 - 2030
- Figure 163:
- POTASSIC FERTILIZER CONSUMPTION VALUE BY CROP TYPE IN %, BRAZIL, 2023 VS 2030
- Figure 164:
- POTASSIC FERTILIZER CONSUMPTION IN METRIC TON, REST OF SOUTH AMERICA, 2017 - 2030
- Figure 165:
- POTASSIC FERTILIZER CONSUMPTION IN USD, REST OF SOUTH AMERICA, 2017 - 2030
- Figure 166:
- POTASSIC FERTILIZER CONSUMPTION VALUE BY CROP TYPE IN %, REST OF SOUTH AMERICA, 2023 VS 2030
- Figure 167:
- MOST ACTIVE COMPANIES BY NUMBER OF STRATEGIC MOVES, GLOBAL, 2017 - 2030
- Figure 168:
- GLOBAL POTASH FERTILIZER MARKET, MOST ADOPTED STRATEGIES, 2018 - 2021
- Figure 169:
- MARKET SHARE OF MAJOR PLAYERS IN %, GLOBAL
Potash Fertilizer Industry Segmentation
Straight are covered as segments by Type. Fertigation, Foliar, Soil are covered as segments by Application Mode. Field Crops, Horticultural Crops, Turf & Ornamental are covered as segments by Crop Type. Asia-Pacific, Europe, Middle East & Africa, North America, South America are covered as segments by Region.| Type | Straight | Potassic | MoP |
| SoP | |||
| Others | |||
| Application Mode | Fertigation | ||
| Foliar | |||
| Soil | |||
| Crop Type | Field Crops | ||
| Horticultural Crops | |||
| Turf & Ornamental | |||
| Region | Asia-Pacific | Australia | |
| Bangladesh | |||
| China | |||
| India | |||
| Indonesia | |||
| Japan | |||
| Pakistan | |||
| Philippines | |||
| Thailand | |||
| Vietnam | |||
| Rest of Asia-Pacific | |||
| Europe | France | ||
| Germany | |||
| Italy | |||
| Netherlands | |||
| Russia | |||
| Spain | |||
| Ukraine | |||
| United Kingdom | |||
| Rest of Europe | |||
| Middle East & Africa | Nigeria | ||
| Saudi Arabia | |||
| South Africa | |||
| Turkey | |||
| Rest of Middle East & Africa | |||
| North America | Canada | ||
| Mexico | |||
| United States | |||
| Rest of North America | |||
| South America | Argentina | ||
| Brazil | |||
| Rest of South America | |||
Need A Different Region or Segment?
Customize Now
Market Definition
- MARKET ESTIMATION LEVEL - Market Estimations for various types of fertilizers has been done at the product-level and not at the nutrient-level.
- NUTRIENT TYPES COVERED - All Potassic Fertilizers
- AVERAGE NUTRIENT APPLICATION RATE - This refers to the average volume of nutrient consumed per hectare of farmland in each country.
- CROP TYPES COVERED - Field Crops: Cereals, Pulses, Oilseeds, and Fiber Crops Horticulture: Fruits, Vegetables, Plantation Crops and Spices, Turf Grass and Ornamentals
| Keyword | Definition |
|---|---|
| Fertilizer | Chemical substance applied to crops to ensure nutritional requirements, available in various forms such as granules, powders, liquid, water soluble, etc. |
| Specialty Fertilizer | Used for enhanced efficiency and nutrient availability applied through soil, foliar, and fertigation. Includes CRF, SRF, liquid fertilizer, and water soluble fertilizers. |
| Controlled-Release Fertilizers (CRF) | Coated with materials such as polymer, polymer-sulfur, and other materials such as resins to ensure nutrient availability to the crop for its entire life cycle. |
| Slow-Release Fertilizers (SRF) | Coated with materials such as sulfur, neem, etc., to ensure nutrient availability to the crop for a longer period. |
| Foliar Fertilizers | Consist of both liquid and water soluble fertilizers applied through foliar application. |
| Water-Soluble Fertilizers | Available in various forms including liquid, powder, etc., used in foliar and fertigation mode of fertilizer application. |
| Fertigation | Fertilizers applied through different irrigation systems such as drip irrigation, micro irrigation, sprinkler irrigation, etc. |
| Anhydrous Ammonia | Used as fertilizer, directly injected into the soil, available in gaseous liquid form. |
| Single Super Phosphate (SSP) | Phosphorus fertilizer containing only phosphorus which has lesser than or equal to 35%. |
| Triple Super Phosphate (TSP) | Phosphorus fertilizer containing only phosphorus greater than 35%. |
| Enhanced Efficiency Fertilizers | Fertilizers coated or treated with additional layers of various ingredients to make it more efficient compared to other fertilizers. |
| Conventional Fertilizer | Fertilizers applied to crops through traditional methods including broadcasting, row placement, ploughing soil placement, etc. |
| Chelated Micronutrients | Micronutrient fertilizers coated with chelating agents such as EDTA, EDDHA, DTPA, HEDTA, etc. |
| Liquid Fertilizers | Available in liquid form, majorly used for application of fertilizers to crops through foliar and fertigation. |
Need More Details on Market Definition?
Ask a Question
Research Methodology
Mordor Intelligence follows a four-step methodology in all our reports.
- Step-1: IDENTIFY KEY VARIABLES: In order to build a robust forecasting methodology, the variables and factors identified in Step-1 are tested against available historical market numbers. Through an iterative process, the variables required for market forecast are set and the model is built on the basis of these variables.
- Step-2: Build a Market Model: Market-size estimations for the forecast years are in nominal terms. Inflation is not a part of the pricing, and the average selling price (ASP) is kept constant throughout the forecast period for each country.
- Step-3: Validate and Finalize: In this important step, all market numbers, variables and analyst calls are validated through an extensive network of primary research experts from the market studied. The respondents are selected across levels and functions to generate a holistic picture of the market studied.
- Step-4: Research Outputs: Syndicated Reports, Custom Consulting Assignments, Databases & Subscription Platforms

Get More Details On Research Methodology
Download PDF


