
Market Overview
| Study Period | 2021 - 2031 |
|---|---|
| Market Size (2026) | USD 30.6 Billion |
| Market Size (2031) | USD 37.53 Billion |
| Growth Rate (2026 - 2031) | 4.16 % |
| Fastest Growing Market | Asia Pacific |
| Largest Market | Asia Pacific |
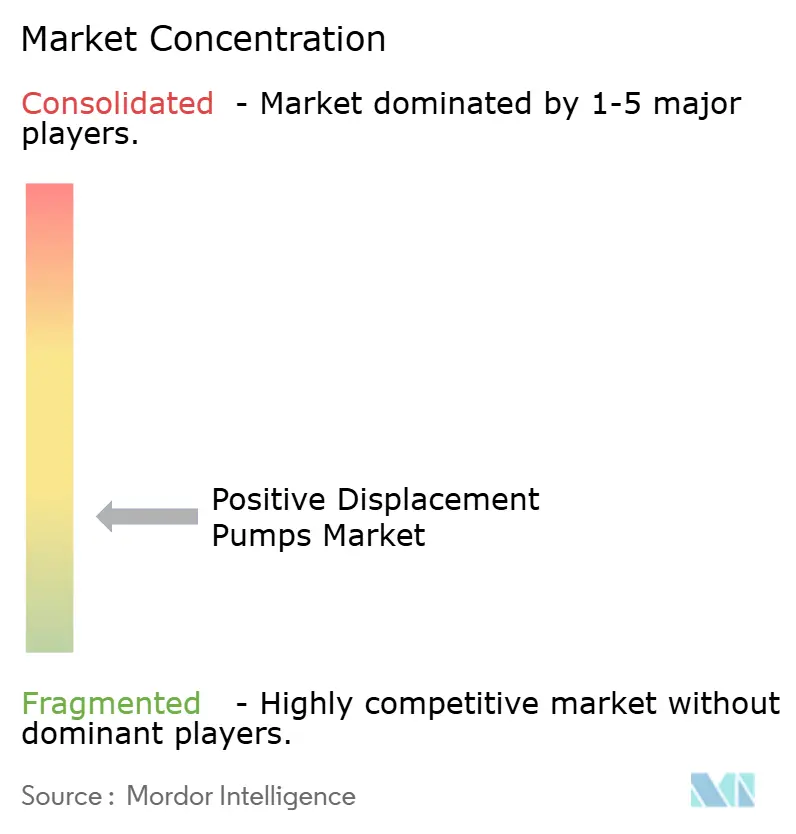
| Market Concentration | Low |
Major Players *Disclaimer: Major Players sorted in no particular order Image © Mordor Intelligence. Reuse requires attribution under CC BY 4.0. | |
Positive Displacement Pumps Market Analysis by Mordor Intelligence
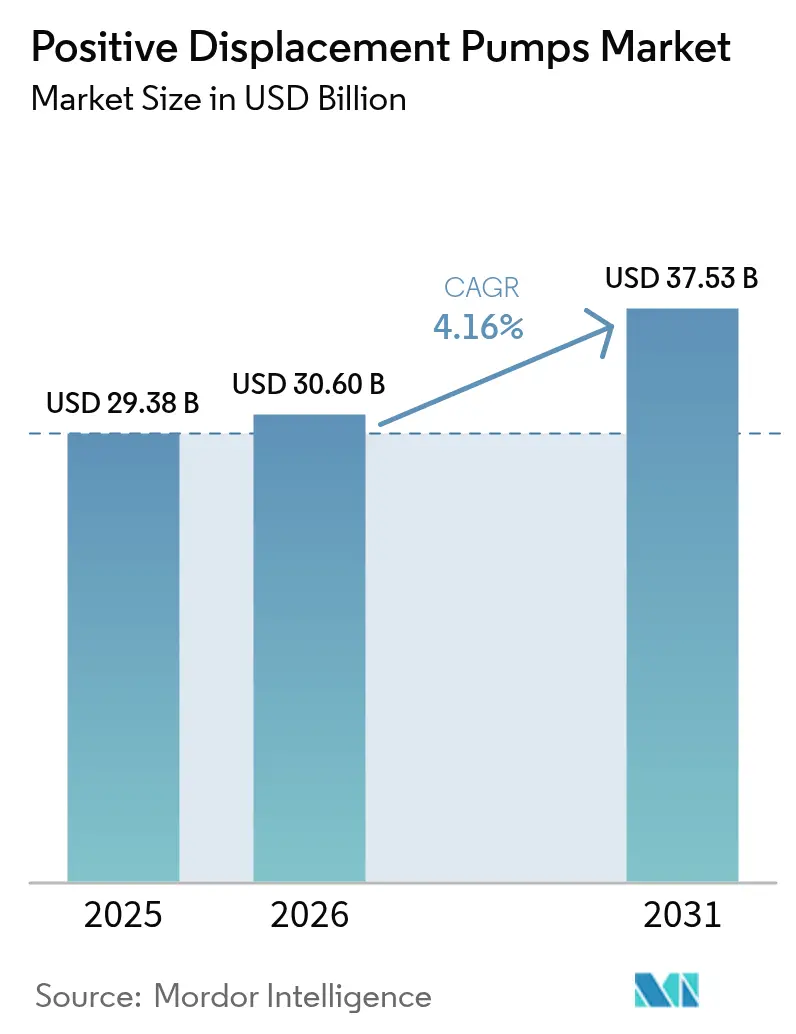
The Positive Displacement Pumps market size is expected to grow from USD 29.38 billion in 2025 to USD 30.6 billion in 2026 and is forecast to reach USD 37.53 billion by 2031 at 4.16% CAGR over 2026-2031.
Robust demand for accurate flow control in water treatment plants, subsea production systems, and pharmaceutical bioprocessing lines underpins this trajectory. Regulatory accelerants—ranging from zero-liquid-discharge mandates in steam-electric power stations to strict sanitary design rules in dairy processing—are amplifying replacement cycles and green-field installations. Meanwhile, upstream oil and gas operators are intensifying brown-field upgrades that rely on high-pressure subsea pump packages, and manufacturers are targeting cost-of-ownership reductions through energy-efficient, seal-less, and condition-monitored designs. Competitive intensity is rising as strategic buyers seek to achieve scale, broad technology capabilities, and aftermarket revenues, while volatile stainless-steel prices and elevated energy costs are squeezing margins even for tier-one players.
Key Report Takeaways
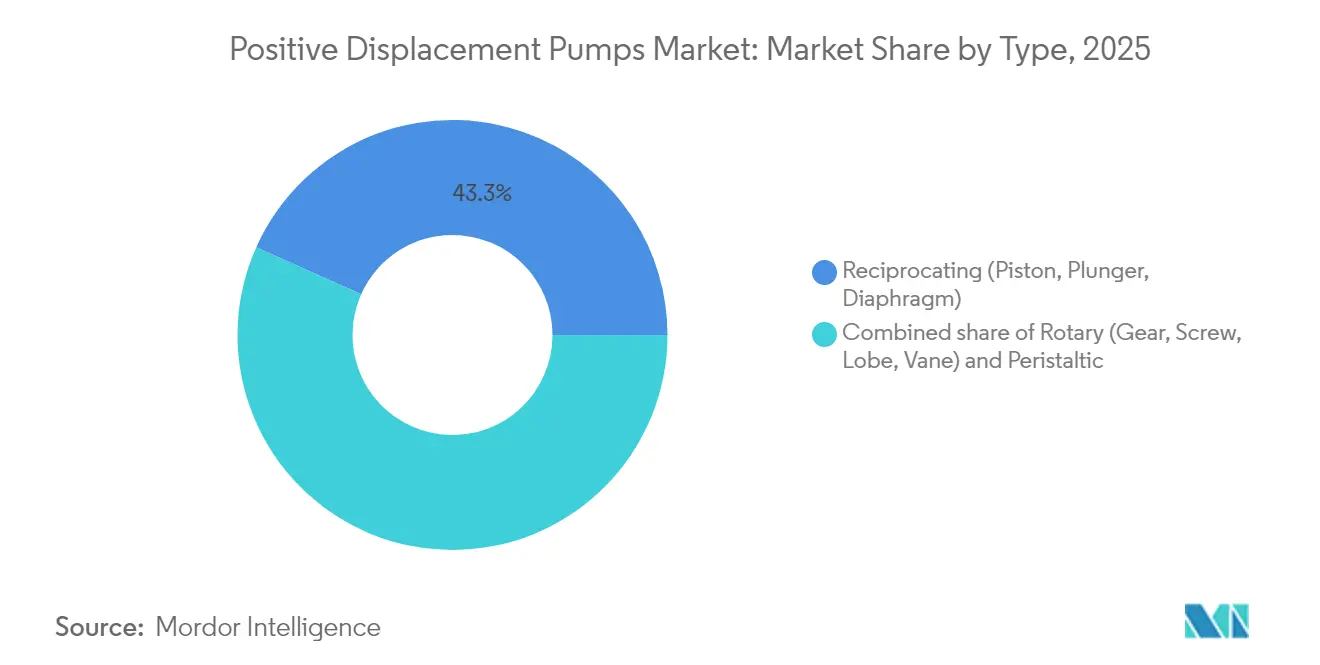
- By type, reciprocating pumps captured 43.30% of the positive displacement pumps market share in 2025; peristaltic technology is projected to grow at a 6.78% CAGR to 2031.
- By pressure rating, up to 50 bar pumps held 48.10% of the positive displacement pumps market share in 2025, whereas units above 150 bar are forecast to expand at a 5.72% CAGR through 2031.
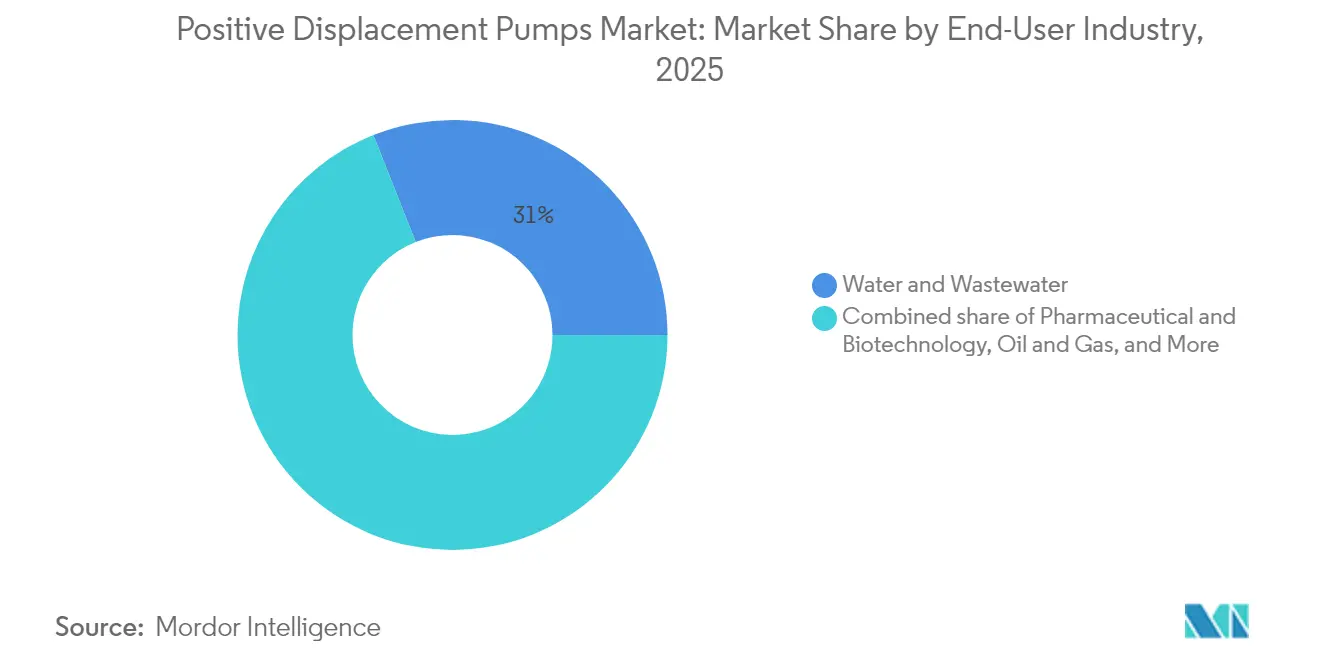
- By end-user industry, water and wastewater treatment accounted for a 31.00% share of the positive displacement pumps market size in 2025; pharmaceutical and biotechnology applications are projected to advance at a 6.52% CAGR between 2026 and 2031.
- By geography, the Asia-Pacific region led with a 42.60% revenue share in 2025 and is expected to maintain the fastest regional CAGR at 5.53% through 2031.
Note: Market size and forecast figures in this report are generated using Mordor Intelligence’s proprietary estimation framework, updated with the latest available data and insights as of 2026.
Market Trends and Insights
Drivers Impact Analysis of Positive Displacement Pumps Market*
| Driver | (~) % Impact on CAGR Forecast | Geographic Relevance | Impact Timeline |
|---|---|---|---|
| Industrial wastewater compliance spending surge | +1.2% | Global; early gains in North America, Europe | Medium term (2-4 years) |
| Upstream oil and gas brown-field upgrade cycle | +0.8% | North America, Middle East, Asia-Pacific cores | Medium term (2-4 years) |
| Process-automation driven precision dosing | +0.7% | Global; spill-over to emerging markets | Long term (≥ 4 years) |
| Strict food-safety standards for sanitary pumps | +0.5% | North America & EU; expanding to Asia-Pacific | Short term (≤ 2 years) |
| Biopharma modular skids require micro-PD pumps | +0.6% | North America, Europe; growth in Asia-Pacific | Long term (≥ 4 years) |
| Electrified remote mining needs energy-efficient PD pumps | +0.4% | APAC core; spill-over to South America, Africa | Long term (≥ 4 years) |
| Source: Mordor Intelligence | |||
Industrial Wastewater Compliance Spending Surge
Zero-discharge limits adopted by the United States Environmental Protection Agency for flue-gas desulfurization wastewater are driving capital programs that favor high-reliability metering and hose pumps capable of handling aggressive chemistries[1]United States Environmental Protection Agency, “Supplemental Effluent Limitations Guidelines for Steam Electric Power Generation,” epa.gov. Similar tightening is observable in Europe, while Asian foundries and semiconductor fabs adopt high-recovery reverse-osmosis and evaporation loops that rely on precision metering systems for antiscalant and pH control. Funding momentum is strong: the US Bipartisan Infrastructure Law allocates USD 50 billion for water and wastewater upgrades, providing owners with the budget certainty needed to finalize multi-year framework agreements for pump packages. The adoption of zero liquid discharge in microelectronics is also increasing demand for high-pressure reciprocating units capable of 24/7 operation. Suppliers that bundle IoT-enabled condition monitoring and performance analytics are closing total-cost-of-ownership gaps versus centrifugal alternatives.
Upstream Oil & Gas Brown-Field Upgrade Cycle
Deep-water operators are reinvesting in mature basins, and high-pressure subsea multiphase pumps play a central role in these redevelopment plans. SLB OneSubsea’s award for BP’s Kaskida field demonstrates how artificial-lift packages rated beyond 15,000 psi can unlock incremental recovery while reducing topside compression footprints [2]SLB, “BP Awards OneSubsea Kaskida High-Pressure Pump Contract,” slb.com. Hydraulic efficiency improvements, larger motor ratings, and compact footprint designs are enabling deployment from smaller floating facilities, reducing capital expenditure per barrel. Orders data underscore the trend: Baker Hughes booked USD 3.03 billion in Industrial & Energy Technology projects in Q4 2024, its fifth consecutive quarter above USD 3 billion, with pumps and compressors accounting for a material portion. Field operators see additional value in adjustable-speed drives that allow output turndown, minimizing energy draw during partial-load operation.
Process-Automation Driven Precision Dosing
Manufacturers are embracing digital twins, advanced process control, and single-use skids, all of which depend on accurate low-pulsation flow. Watson-Marlow’s Qdos series now delivers 2,000 ml/min at 9 bar with ±1% flow accuracy, eliminating the need for diaphragm valves and reducing calibration downtime [3]Watson-Marlow Fluid Technology Solutions, “Quantum Peristaltic Pump for Bioprocessing,” watson-marlow.com. Bioprocessing 4.0 roadmaps prioritize modular layouts that can be reconfigured within days; peristaltic and diaphragm metering pumps with plug-and-play connectivity meet this need. In chemical dosing for industrial water, remote monitoring reduces service calls by up to 35%, an advantage prized in regions facing a scarcity of skilled labor.
Strict Food-Safety Standards for Sanitary Pumps
USDA regulation 7 CFR 58.219 requires plunger-type homogenizers and pumps to conform with 3-A Sanitary Standards, including full clean-in-place capability and crevice-free wetted parts. The European Hygienic Engineering & Design Group (EHEDG) guidelines reinforce the same design principles. Manufacturers have responded with polished stainless-steel rotary lobe and twin-screw units certified to handle wash-down pressures without dismantling. Peristaltic makers offer food-grade hoses that isolate product from mechanical parts, a critical attribute for allergen control and flavor integrity.
Restraints Impact Analysis of Positive Displacement Pumps Market*
| Restraint | (~) % Impact on CAGR Forecast | Geographic Relevance | Impact Timeline |
|---|---|---|---|
| High O&M costs vs. centrifugal alternatives | −0.9% | Global, cost-sensitive applications | Short term (≤ 2 years) |
| Viscosity limits in high-throughput processes | −0.6% | Industrial processing regions | Medium term (2-4 years) |
| Volatile stainless-steel & alloy prices | −0.8% | Global manufacturing hubs | Short term (≤ 2 years) |
| Valve-less micro-fluidics cannibalising lab demand | −0.3% | North America, Europe research centers | Long term (≥ 4 years) |
| Source: Mordor Intelligence | |||
High O&M Costs vs. Centrifugal Alternatives
Centrifugal pumps still account for more than 90% of petroleum service due to their lower parts count and simpler maintenance routines [4]IPIECA, “Pump Efficiency Optimization in Oil & Gas,” ipieca.org. Seal replacement intervals for reciprocating designs can be one-third those of centrifugal machines, and energy consumption penalties rise when positive displacement pumps run far below the best-efficiency point. Cost-conscious operators in bulk water transfer and irrigation applications, therefore, hesitate to specify positive displacement technology unless viscosity, suction performance, or metering accuracy demands override economics.
Volatile Stainless-Steel & Alloy Prices
European base-grade 304 stainless rose throughout Q1 2025 as nickel supply concerns re-emerged, lifting alloy surcharges by nearly 25 % year-over-year. Manufacturers faced quoting challenges, with some limiting the validity of prices to 30 days. Smaller OEMs that lacked volume contracts or futures hedging struggled to maintain margins, occasionally deferring deliveries until raw material costs stabilized. The uncertainty encourages exploration of composite wetted parts, yet adoption is slow in high-pressure service segments where metal fatigue data underpin user approvals.
*Our forecasts treat driver/restraint impacts as directional, not additive. The impact forecasts reflect baseline growth, mix effects, and variable interactions.
Positive Displacement Pumps Market Segment Analysis
By Type:
Peristaltic Technology Drives Innovation WaveReciprocating units dominated 2025 revenue with 43.30% positive displacement pumps market share, a testament to their unrivaled pressure capabilities and precise stroke-by-stroke control in refineries, chemical reactors, and high-pressure boiler feed duties. In contrast, peristaltic solutions are expected to headline growth at a 6.78% CAGR, driven by sterile bioprocessing, laboratory automation, and adhesive dispensing requirements. Quantum and PERIPRO series hose pumps achieve continuous flow with a deviation of ≤±1%, even at viscosities above 50,000 cSt, a performance window previously limited to specialty gear pumps. The elimination of dynamic seals minimizes the risk of cross-contamination, a decisive factor for vaccine producers. As single-use cartridge hoses reduce changeover time, peristaltic suppliers are marketing total-cost-of-ownership models matching those of stainless-steel diaphragm alternatives.
Gear, screw, and lobe variants remain fixtures in lubrication, asphalt, and chocolate transfer lines, where shear sensitivity demands gentle handling. Integrated variable-frequency drives optimize torque and mitigate pressure spikes, extending bearing life. Rotary vane configurations cater to compact machine tools and HVAC lubricant circulation systems, sustaining a sizeable mid-volume niche.


By Pressure Rating:
Ultra-High-Pressure Applications AccelerateSystems rated up to 50 bar secured 48.10% of the positive displacement pumps market size in 2025, capturing the largest installed base across municipal waterworks and standard chemical dosing skids. Yet, above 150 bar units are charting the fastest 5.72% CAGR, driven by waterjet cutting, carbon capture sequestration injection, and subsea multiphase boosting, which demand pressures that conventional designs cannot meet. Seal-less radial piston pumps now operate at 600 bar for water hydraulics in steel mills, reporting mean time between maintenance intervals exceeding five years. Meanwhile, ultrahigh-pressure plunger assemblies surpass 14,000 bar for specialty machining of aerospace alloys. Between 51 and 150 bar, diaphragm models equipped with integral pulsation dampeners serve as membrane bioreactor feed duties, balancing footprint, reliability, and energy draw.
By End-User Industry:
Pharmaceutical Biotechnology Leads GrowthWater and wastewater treatment accounted for the largest 31.00% of 2025 revenue as municipalities addressed effluent tightening and aging infrastructure. Framework contracts often span 15 years, embedding recurring spares and service demand. Conversely, pharmaceutical and biotechnology facilities are projected to post the fastest 6.52% CAGR through 2031, driven by continuous manufacturing lines, increased cell therapy batches, and Annex 1 sterility mandates. Positive displacement pumps market share is rising in this sector because closed, single-use skids rely exclusively on low-shear, seal-free flow paths. Food and beverage processors invest in 3-A-compliant twin-screw units to enhance allergen segregation, while mining operations specify energy-efficient triplex piston pumps linked to renewable microgrids.
Oil and gas remain material, supported by brownfield artificial-lift upgrades and LNG feedstock investment. However, gases are leaner, and project count moderates post-2027 as upstream capex pivots toward lower-emission assets. Chemical producers continue to favor magnet-drive gear pumps for the transfer of corrosive monomers, citing zero fugitive emissions and reduced fire-watch staffing requirements.
Geography Analysis
APAC Positive Displacement Pumps Market
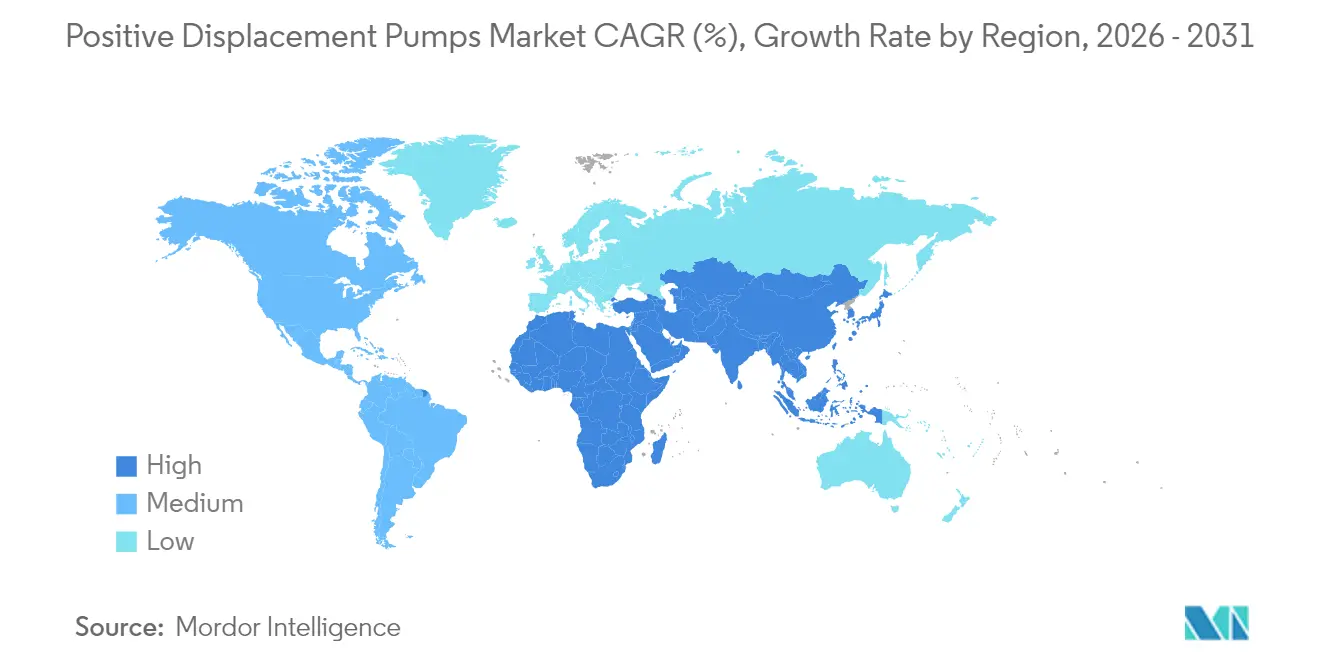
Asia-Pacific held 42.60% of 2025 revenue and delivered the strongest 5.53% CAGR, underwritten by China’s 10 billion yuan pumped-storage program and India’s USD 270 billion industrial water spend pipeline . Local OEMs are upgrading casting quality to secure nuclear motor coolant orders, but Western brands continue to be preferred for pharmaceutical-grade hose pumps. Japan’s Ebara is building a 16 billion yen liquid-hydrogen pump testing hub, signaling a long-term national focus on clean-energy carriers.
North America, EMEA and LATAM Positive Displacement Pumps Market
North America retains a large installed base across refineries and shale operations, providing robust aftermarket revenue even as new-build investment flattens. Government-backed PFAS discharge rules are also boosting state-level funding for advanced oxidation and membrane systems, both of which depend on chemical metering pumps. Europe grapples with energy cost volatility yet enforces strict effluent and food safety codes, sustaining a healthy spare parts business. Latin America’s mining expansion drives demand for high-pressure slurry transfer, although currency depreciation occasionally delays capital expenditures. The Middle East and Africa prioritize desalination and produced-water reinjection, generating opportunities for corrosion-resistant duplex-steel triplex pumps despite budget sensitivity.

Regulatory Landscape
Energy-efficiency requirements and standardized performance verification are narrowing the compliance envelope for pumps sold into building services and industrial utilities, shaping product selection and test procedures. In the United States, the Department of Energy issued a final rule in May 2024 establishing energy conservation standards for circulator pumps, with compliance required on and after May 22, 2028. This raises expectations for efficiency-oriented design and documentation for applicable pump categories.
Testing and conformity assessment are also being influenced by updated international methods and existing EU ecodesign frameworks. ISO published ISO 8426-1:2025 in August 2025, updating the methodology for displacement determination in hydraulic fluid power positive displacement pumps. In the European Union, Commission Regulation (EU) No 547/2012 continues to set ecodesign requirements for rotodynamic water pumps using the Minimum Efficiency Index (MEI), reinforcing buyer preference for certified performance and traceable test procedures in tender-driven water and utility projects.
Competitive Landscape
Industry consolidation continues. The all-stock merger between Chart Industries and Flowserve will create a USD 19 billion flow-technology supplier with aftermarket revenue exceeding USD 3.7 billion, positioning it to bundle cryogenic, pump, and valve portfolios into multi-site framework agreements. Honeywell’s USD 2.16 billion Sundyne acquisition strengthens its engineered-equipment vertical and grants access to refinery revamp cycles.
Technology differentiation emphasizes energy reduction and digital service. NETZSCH’s PERIPRO series advertises up to 30 % lower power draw via optimized rotor geometry, while integrated edge analytics trigger service dispatches based on vibration trend deviation rather than time-based schedules. EBARA’s hydrogen-pump prototype targets liquefied carrier temperatures at −253 °C, carving an early mover advantage in an emerging value chain. Tier-two players face sourcing risk from stainless-steel price spikes and respond by dual-qualifying castings across foundries in India, Vietnam, and Mexico.
Positive Displacement Pumps Industry Leaders
Flowserve Corporation
Xylem Inc.
Sulzer AG
KSB SE & Co. KGaA
SPX FLOW Inc.
- *Disclaimer: Major Players sorted in no particular order
Positive Displacement Pumps Market Companies Covered in this Report
- Flowserve Corporation
- Xylem Inc.
- Sulzer AG
- KSB SE & Co. KGaA
- SPX FLOW Inc.
- ITT Inc.
- Ampco Pumps Company Inc.
- NETZSCH Holding
- Pentair PLC
- LEWA GmbH
- Grundfos Holding A/S
- Dover Corp. (PSG)
- Ingersoll Rand (Gardner Denver)
- Alfa Laval AB
- Atlas Copco AB
- Graco Inc.
- Gorman-Rupp Co.
- IDEX Corporation
- Wilo SE
- Tsurumi Pump

Market Opportunities and Future Outlook
Compliance-driven water and wastewater upgrades and higher-spec dosing needs are creating room for pump packages that lower total installed cost while meeting uptime and monitoring requirements. The US Bipartisan Infrastructure Law allocation of USD 50 billion for water and wastewater upgrades provides multi-year funding visibility, which supports framework agreements for metering and hose pump packages. This is especially relevant as plants add advanced treatment steps that increase the intensity of chemical dosing, antiscalant control, and pH adjustment.
Decarbonization-related process investments are also expanding demand for high-integrity metering and injection services, particularly in carbon capture, utilization and storage (CCUS) applications where solvent dosing and CO2 handling require tight containment and high-pressure capability. SPX FLOW publicly positioned its Bran + Luebbe metering and process pumps for CCUS chemical dosing in December 2025, and suppliers are aligning around seal-less, condition-monitored designs to address fugitive-emission constraints and labor scarcity in maintenance. In parallel, subsea and brownfield oil and gas redevelopment continues to pull through ultra-high-pressure pump packages, including projects with beyond 15,000 psi subsea boosting such as BP Kaskida awarded to SLB OneSubsea, supporting opportunities for engineered-to-order high-pressure skids and long-tail aftermarket service linked to installed base reliability programs.
Recent Industry Developments in Positive Displacement Pumps Market
- June 2026: Flowserve completed its USD 490 million acquisition of the Trillium Flow Technologies Valves Division. The deal expands Flowserve's footprint in nuclear and other power end-markets and strengthens its ability to bundle pumps, valves, and aftermarket services into broader plant-level supply scopes.
- March 2026: ITT completed the acquisition of SPX FLOW for USD 4.775 billion and integrated the business into a newly named Flow Technologies segment. The transaction consolidates fluid handling and process technology portfolios, increasing cross-selling potential in hygienic processing, industrial services, and project-driven pump packages.
- October 2025: Xylem launched Flygt Concertor, positioned as a wastewater pumping system with integrated intelligence for 2.2 to 7.3 kW pumps. Embedding controls and analytics at the pump system level supports energy and maintenance optimization in municipal and industrial wastewater applications where lifecycle cost is central to procurement.


Positive Displacement Pumps Market Report Scope and Research Methodology
Market Definition and Coverage
This market covers revenue generated from positive displacement pumps used to move fluids by trapping a fixed volume and pushing it through the discharge side. The sizing follows pump shipments and installed base replacement across industrial and infrastructure use cases, then converts to USD using consistent annual averages.
Scope exclusions: We exclude centrifugal pumps, most pump consumables (such as seals sold as spares), and non-pump services that are not bundled with the equipment sale.
Segments Covered in This Report
- By Type
- Reciprocating (Piston, Plunger, Diaphragm)
- Rotary (Gear, Screw, Lobe, Vane)
- Peristaltic
- By Pressure Rating
- Up to 50 bar
- 51 to 150 bar
- Above 150 bar
- By End-user Industry
- Oil and Gas
- Power Generation
- Water and Wastewater
- Chemical and Petrochemical
- Food and Beverage
- Pharmaceutical and Biotechnology
- Mining and Minerals
- Pulp and Paper
- Others
- By Geography
- North America
- United States
- Canada
- Mexico
- Europe
- Germany
- United Kingdom
- France
- Italy
- Spain
- NORDIC Countries
- Russia
- Rest of Europe
- Asia-Pacific
- China
- India
- Japan
- South Korea
- Southeast Asia
- Rest of Asia-Pacific
- South America
- Brazil
- Argentina
- Chile
- Rest of South America
- Middle East and Africa
- Saudi Arabia
- United Arab Emirates
- South Africa
- Egypt
- Rest of Middle East and Africa
- North America
Data Sources, Market Sizing, and Validation
Desk Research
Desk research was used to set the factual base for demand drivers and to avoid building the model on opinion alone. We leaned on public sources such as the US Census Bureau manufacturing data, USGS for industry output signals, Eurostat industrial production series, UN Comtrade trade codes for pumps and parts, and IEA energy statistics that link to oil and gas and power activity.
To connect pump demand with end markets, we also reviewed company annual reports and investor presentations, technical papers in peer reviewed journals on pump efficiency and fluids handling, and association websites and reputed press that track capital spending cycles in water and wastewater, chemicals, and energy. In a few cases, paid subscriptions for company financials and patent databases were used to validate product focus and innovation intensity. The sources listed here are illustrative, and other public datasets and documents were also referenced for cross-checks and clarification.
Primary Interviews and Surveys
Primary work focused on interviews and short surveys with pump OEM staff, channel partners, EPC and maintenance stakeholders, and buyer-side engineers in fluids handling roles. Because this is a global market, inputs were balanced across major regions to sanity check pricing ranges, replacement cycles, and the pace of adoption for specific pump types across end uses.
Distribution of primary research fieldwork respondents
| Company type | Respondent position | Region |
|---|---|---|
| Top tier: 32% | CXOs: 18% | APAC: 44% |
| Mid tier: 49% | Functional/Unit leaders: 25% | EMEA: 34% |
| Smaller Players: 19% | Managers: 57% | Americas: 22% |
Market-Sizing & Forecasting
The core model uses a top-down build where industrial production, energy and water infrastructure activity, and trade flows are used to reconstruct the addressable demand pool for positive displacement pumps by region, and then mapped to pricing bands and typical mix. The totals are then corroborated with selective bottom-up approximations, including sampled supplier revenue splits, distributor channel checks, and simple volume times ASP calculations for a few high-usage end markets, before final numbers are locked.
For inputs, we track indicators that tend to move pump demand in a visible way, including capital spending in water and wastewater projects, drilling and refinery utilization trends, chemical output growth, food and beverage processing additions, and the share shift between key pump families used for viscous or metering duties. Pricing assumptions are kept realistic by using observed ASP ranges, then adjusting for raw material inflation and mix changes that were confirmed in interviews. Forecasting is run using scenario analysis supported by a light multivariate regression on the most stable macro drivers, and assumptions are reviewed with experts so the trend stays aligned with real procurement behavior. Where bottom-up signals are missing for smaller countries, gaps are handled through proxy ratios from comparable economies and import penetration cues, then rechecked at the regional roll-up level.
Data Validation & Update Cycle
Validation is done through several rounds of checks so the final number does not depend on a single dataset. We compare outputs against independent signals, such as pump trade direction, reported order intake commentary in filings, and end market capex cycles, and any outliers trigger a re-look at mix and price inputs. Before sign-off, the model and assumptions are reviewed by another analyst, and re-contacts are made if a key variable shows an unusual jump.
The report is refreshed annually, and interim updates are made when material events occur, such as sharp commodity swings or policy-led project accelerations. Right before delivery, we do a fresh pass on the latest public data releases to make sure clients receive the most current view available.
Mordor Intelligence's Positive Displacement Pumps Market Size Compared Against Other Published Estimates
Published market sizes for positive displacement pumps can differ by a wide margin, even when the topic name looks the same. The gaps usually come from what gets counted as revenue, which years are treated as the starting point, and how price and volume are blended across regions and end uses.
Some external estimates lean toward a narrower equipment-only view or apply a different base year, which can reduce the reported 2025 value even if the growth story is similar. Other estimates may use a longer forecast horizon with a more aggressive price progression, and currency conversion timing can change the USD figure when local inflation is high. In this study, the spread is mainly explained by how Mordor Intelligence counts only positive displacement pump equipment revenues tied to defined industrial and infrastructure demand signals, and it keeps adjacent pump categories and standalone aftermarket services out of the total.
Benchmark comparison
| Source | Market Size | Gaps in Research Methodology |
|---|---|---|
| Mordor Intelligence | USD 30.60 B (2026) | |
| Global Consultancy A | USD 20.72 B (2025) | Uses an earlier base-year level and a lower starting value, which can happen when the pricing mix is averaged down and certain end-market demand pools are sized more conservatively across regions. |
| Industry Publisher B | USD 22.11 B (2025) | Reports a 2025 base year and then projects forward with a higher growth profile, so the 2025 snapshot can look smaller if fewer pump categories or fewer bundled equipment revenues are included in the starting scope. |
Taken together, the table shows that the biggest differences come from scope choices and the year used for the headline number, and then pricing and currency handling amplify the gap. By keeping the inputs tied to observable demand indicators and by cross-checking totals with channel and supplier signals, our estimate stays traceable to repeatable steps instead of relying on one broad assumption.


Key Questions Answered in the Report
What is the current size of the positive displacement pumps market?
The positive displacement pumps market size is USD 30.6 billion in 2026 and is forecast to reach USD 37.53 billion by 2031 at a 4.16% CAGR.
Which segment is growing fastest within the market?
Peristaltic pumps are the fastest-growing type, expected to post a 6.78% CAGR through 2031, largely due to pharmaceutical and bioprocessing demand.
Why is Asia-Pacific the leading region?
Asia-Pacific commands 42.60% of 2025 revenue and a 5.53% CAGR because of sizeable infrastructure projects such as China’s pumped-storage initiatives and Japan’s hydrogen investments.
How are regulations influencing demand?
Zero-discharge wastewater rules, stricter food-safety standards and new EU-GMP Annex 1 sterility requirements are accelerating replacement and upgrade cycles across multiple industries.
What impact will raw-material price volatility have on suppliers?
Rising stainless-steel and nickel prices tighten margins, prompting manufacturers to shorten quote validity, hedge with futures contracts or explore composite materials.
Who are the key consolidators in the market?
Chart Industries’ merger with Flowserve and Honeywell’s purchase of Sundyne illustrate ongoing consolidation that is reshaping competitive dynamics and boosting aftermarket scale.
Page last updated on:


 Your data is secure and never sold or shared.


