
Position Sensor Market Size and Share
Market Overview
| Study Period | 2021 - 2031 |
|---|---|
| Market Size (2026) | USD 9.31 Billion |
| Market Size (2031) | USD 14.79 Billion |
| Growth Rate (2026 - 2031) | 9.68 % |
| Fastest Growing Market | Asia Pacific |
| Largest Market | Asia Pacific |
| Market Concentration | Medium |
Major Players *Disclaimer: Major Players sorted in no particular order Image © Mordor Intelligence. Reuse requires attribution under CC BY 4.0. | |
Position Sensor Market Analysis by Mordor Intelligence
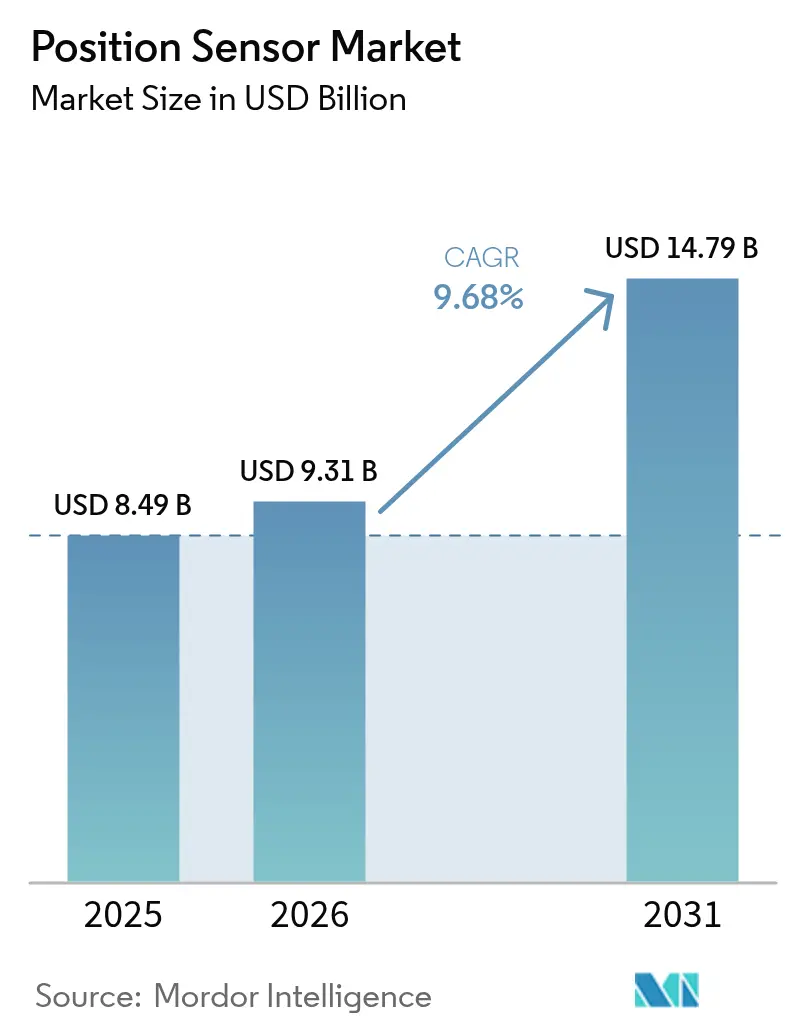
Position sensor market size in 2026 is estimated at USD 9.31 billion, growing from 2025 value of USD 8.49 billion with 2031 projections showing USD 14.79 billion, growing at 9.68% CAGR over 2026-2031. Growth is propelled by the rapid move from basic mechanization toward fully automated field operations that require micrometer-level feedback for steering, hydraulics, and implement control. OEMs are embedding ruggedized angle and linear sensors into autonomous tractors, sprayers, and conveyors to comply with emerging safety rules, while semiconductor suppliers are shrinking MEMS packages to cut power budgets and ease integration. Supply chain pressure on rare-earth magnets is nudging buyers to evaluate inductive, optical, and time-of-flight alternatives that can survive harsh dust, vibration, and temperature cycles. At the same time, on-edge AI routines and energy harvesting are extending sensor life in remote acreage where broadband coverage is unreliable.
Key Report Takeaways
- By type, linear sensors led the position sensor market, accounting for a 40.45% revenue share in 2025. Meanwhile, laser displacement sensors are projected to grow at a 13.25% CAGR through 2031.
- By technology, non-contact devices commanded a 61.25% share of the position sensor market in 2025, while the same category is also expanding fastest at a 12.20% CAGR to 2031.
- By output interface, analog held a 57.30% share of the position sensor market in 2025, whereas digital protocols such as CAN and SENT are climbing at a 12.35% CAGR through 2031.
- By application, agricultural vehicles and self-propelled machinery captured 48.20% of the position sensor market size in 2025, whereas indoor and vertical farming solutions are advancing at a 12.85% CAGR to 2031.
- By geography, Asia-Pacific dominated with a 45.60% market share in 2025 and is forecast to post the fastest regional CAGR of 11.15% by 2031.
Note: Market size and forecast figures in this report are generated using Mordor Intelligence’s proprietary estimation framework, updated with the latest available data and insights as of 2026.
Global Position Sensor Market Trends and Insights
Drivers Impact Analysis*
| Driver | (~) % Impact on CAGR Forecast | Geographic Relevance | Impact Timeline |
|---|---|---|---|
| Rising automation in Industry 4.0 settings | +2.1% | Asia-Pacific and North America | Medium term (2-4 years) |
| Electrification and functional-safety needs | +1.8% | Europe and North America | Medium term (2-4 years) |
| Miniaturization of MEMS position sensors | +1.4% | Manufacturing hubs in Asia-Pacific | Short term (≤ 2 years) |
| On-chip diagnostics for ISO 26262 compliance | +1.2% | Europe's first movers, global adoption | Long term (≥ 4 years) |
| AI-enabled edge sensing for predictive O and M | +0.9% | Early adoption in North America and Europe | Medium term (2-4 years) |
| Ultra-low-power energy-harvesting sensors | +0.7% | Remote agricultural regions worldwide | Long term (≥ 4 years) |
| Source: Mordor Intelligence | |||
Rising Automation in Industry 4.0 Settings
Smart-factory principles are reshaping machinery design, demanding continuous, sub-millimeter positional data that links seamlessly with digital twins. Tractor and combine builders now preload telematics gateways that stream sensor outputs into cloud dashboards, enabling real-time fleet coordination and remote diagnostics. Precision seeding systems adjust planter depth on the fly using magnetostrictive rods that report cylinder position to within 10 µm, saving fuel and inputs during tight planting windows. In parallel, manufacturers are fusing lidar, radar, and angle sensing to create 360-degree situational awareness for driverless vehicles. This momentum strengthens the position sensor market as OEMs standardize smart interfaces across new model platforms.
Electrification and Functional-Safety Needs
Transitioning to high-voltage drivetrains forces designers to specify sensors that remain accurate despite electromagnetic interference and large temperature swings. Rotor position in electric traction motors must be measured to within 1° for peak efficiency, and redundant channels are mandatory to meet ISO 26262 Automotive Safety Integrity Level D. Infineon’s USD 2.5 billion purchase of Marvell’s automotive Ethernet business underscores the strategic value of tightly coupled sensing and networking stacks. The push toward certified, dual-die architectures boosts content per vehicle and deepens supplier engagement, adding momentum to the position sensor market through retrofit kits that electrify legacy fleets.
Miniaturization of MEMS Position Sensors
Advances in wafer-level packaging now place six-axis motion sensing and absolute angle measurement on a single 4 × 4 mm die. These parts sit directly on implement blades or drone airframes, gathering soil hardness and plant-level imaging without mechanical linkages. STMicroelectronics pairs MEMS IMUs with GNSS receivers to create location hubs that weigh under 2 g yet deliver centimeter accuracy, spreading precision tools to smallholders previously priced out of automation. Shrinking footprints also cut board space and wiring, trimming the bill of materials and elevating the position sensor market in low-power edge deployments.
On-Chip Diagnostics for ISO 26262 Compliance
Sensors now self-monitor offset drift, voltage rails, and memory integrity, flagging faults before they compromise steering or boom leveling. TDK’s TAS8240 redundant TMR angle device ships with built-in self-test capable of detecting single-point failures at power-up and during operation, satisfying ASIL D audits. Pre-certified parts shorten OEM homologation cycles by up to 12 months, a schedule advantage that expands the position sensor market among mid-tier implement makers lacking in-house safety expertise.
Restraints Impact Analysis*
| Restraint | (~) % Impact on CAGR Forecast | Geographic Relevance | Impact Timeline |
|---|---|---|---|
| High ASPs of non-contact linear sensors | -1.6% | Price-sensitive emerging markets | Short term (≤ 2 years) |
| Combo-IC inertial sensors substituting lines | -1.2% | Cost-focused equipment segments worldwide | Medium term (2-4 years) |
| Complex supply chain for specialty magnetics | -0.8% | Asia-Pacific sourcing concentration | Short term (≤ 2 years) |
| Certification bottlenecks for ASIL-D designs | -0.7% | Europe and North America are safety-regulated zones | Long term (≥ 4 years) |
| Source: Mordor Intelligence | |||
High ASPs of Non-Contact Linear Sensors
Magnetostrictive and optical encoders often list three to five times above potentiometric rods, stretching capital budgets for small farms. Neo Performance Materials links quarter-on-quarter price swings in neodymium magnets to volatility in gross margins that cascade into sensor pricing. While longer life and zero recalibration lower the total cost of ownership, the upfront premium slows replacements in older hydraulic cylinders and restrains near-term conversion within the position sensor market.
Combo-IC Inertial Sensors Substituting Dedicated Line
System-on-chip IMUs blending gyroscopes, accelerometers, and basic angle logic hit a lower price curve by leveraging smartphone production volumes. Several sprayer manufacturers now opt for “good-enough” fused output, bypassing single-function position sensors where ±1% accuracy suffices. TE Connectivity acknowledged a double-digit dip in its precision sensor line as customers migrated to integrated packages in fiscal 2025 filings. Performance gaps remain in dirty, high-shock zones, yet substitution trims the addressable share for specialist suppliers.
*Our forecasts treat driver/restraint impacts as directional, not additive. The impact forecasts reflect baseline growth, mix effects, and variable interactions.
Segment Analysis
By Type: Linear Feedback Underpins Depth and Lift Control
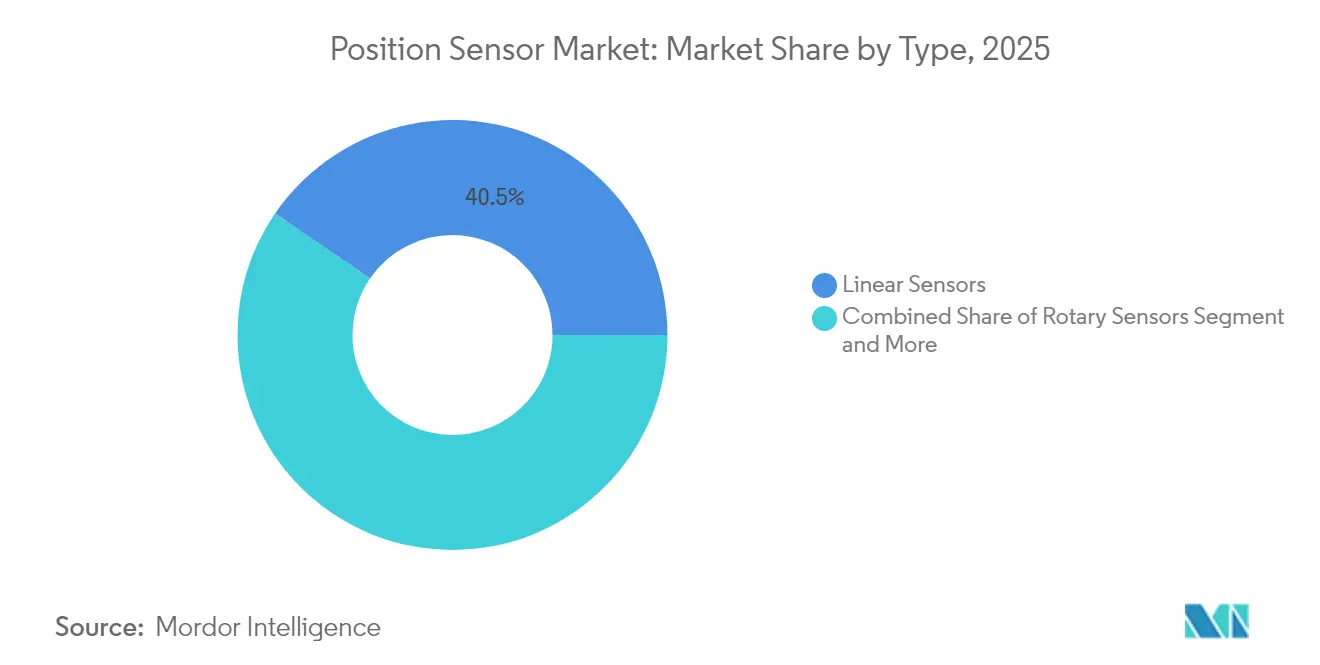
Linear sensors captured 40.45% of the 2025 position sensor market size, reflecting their indispensability in-depth control for tillage, seeding, and sprayer boom leveling. Magnetostrictive rods endure hydraulic pressures above 350 bar and resist abrasive soil, extending service intervals beyond 20,000 hours. Rotary encoders play a vital role in steering knuckles and power take-off shafts, where accurate angular data is essential for closed-loop guidance. Proximity and displacement models also held a significant market share, driven by their application in header height detection and obstacle avoidance systems.
Laser displacement sensors are projected to climb at a 13.25% CAGR to 2031 as prices fall, and optical contamination mitigation improves. This pace outstrips overall position sensor market growth, helped by conveyor-type harvester yield monitors and fruit grading systems that require sub-millimeter distance measurement to classify crops.


By Technology: Non-Contact Platforms Dominate Harsh-Duty Tasks
Non-contact architectures secured a 61.25% share of 2025 revenue, confirming their suitability for mud, shock, and vibration that degrade wiper-arm potentiometers. Hall-based angle devices with integrated T-code interfaces now ship in tractors exceeding 600 hp, where contact wear poses failure risks. Contact solutions still occupy 38.75% of the position sensor market because they offer adequate accuracy in grain cart augers and feed mixer slides at a fraction of the cost.
The non-contact segment is forecast to expand at 12.20% annually, supported by automotive cross-over platforms and automated optical inspection lines that share silicon and optical designs. SICK and Endress+Hauser’s cooperation transfers industrial ruggedness into smart implements, multiplying addressable volume and pushing the position sensor market size for non-contact solutions toward double-digit billions by decade's end.
By Application: Vehicle Automation Commands Investment
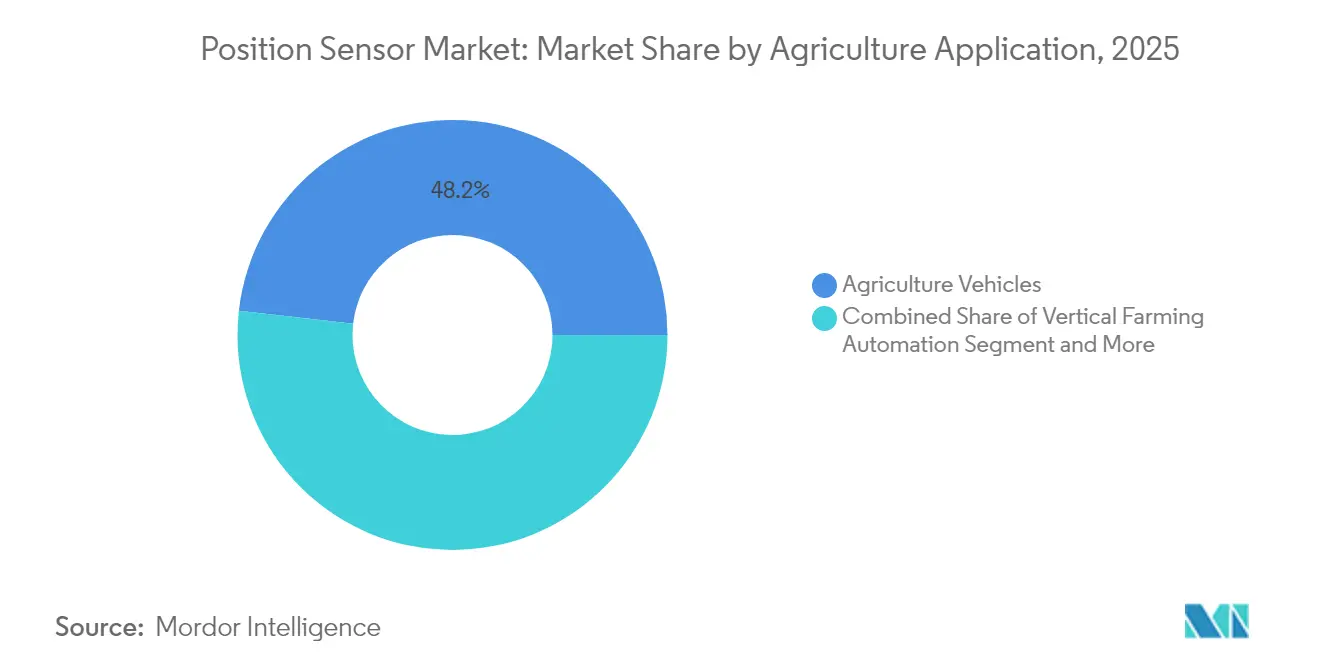
Agriculture vehicles/Self-propelled machinery represented 48.20% of 2025 demand, confirming that automated navigation and implement control remain the primary revenue engines for the position sensor market share. Position feedback guides auto-steer systems that cut overlap, lowering diesel consumption by up to 8% during planting seasons.
Livestock monitoring, using collar-based tags and gate sensors to track animal movement and health indicators, remains a significant segment. Indoor and vertical farms are poised to outpace the field at a 12.85% CAGR, as LED-lit towers in urban hubs demand z-axis positioning to regulate nutrient delivery and facilitate robotic harvesting. AGCO’s USD 2 billion acquisition of Trimble Ag underlines that vehicle automation is converging with sensor-rich retrofit kits that standardize control loops across mixed equipment fleets.
By Output Interface: Digital Protocols Fuel Data-Driven Farming
Analog voltage and current loops held a 57.30% share in 2025, mirroring the global installed base of legacy hydraulic systems. Nonetheless, digital outputs are rising at a 12.35% CAGR as CAN, SENT, and IO-Link become standard on new seeders, sprayers, and robotic grafting lines. Packet-based communication supports error detection, on-board calibration tables, and firmware updates, all of which are crucial for autonomous implements.
Balluff’s Asset Data Provider loads edge algorithms into the sensor head, compressing raw position data into actionable alerts before passing it on via industrial Ethernet, thereby trimming cloud bandwidth fees. As growers adopt predictive maintenance contracts, suppliers embedding such functionality gain share, adding lift to the broader position sensor market.
Geography Analysis
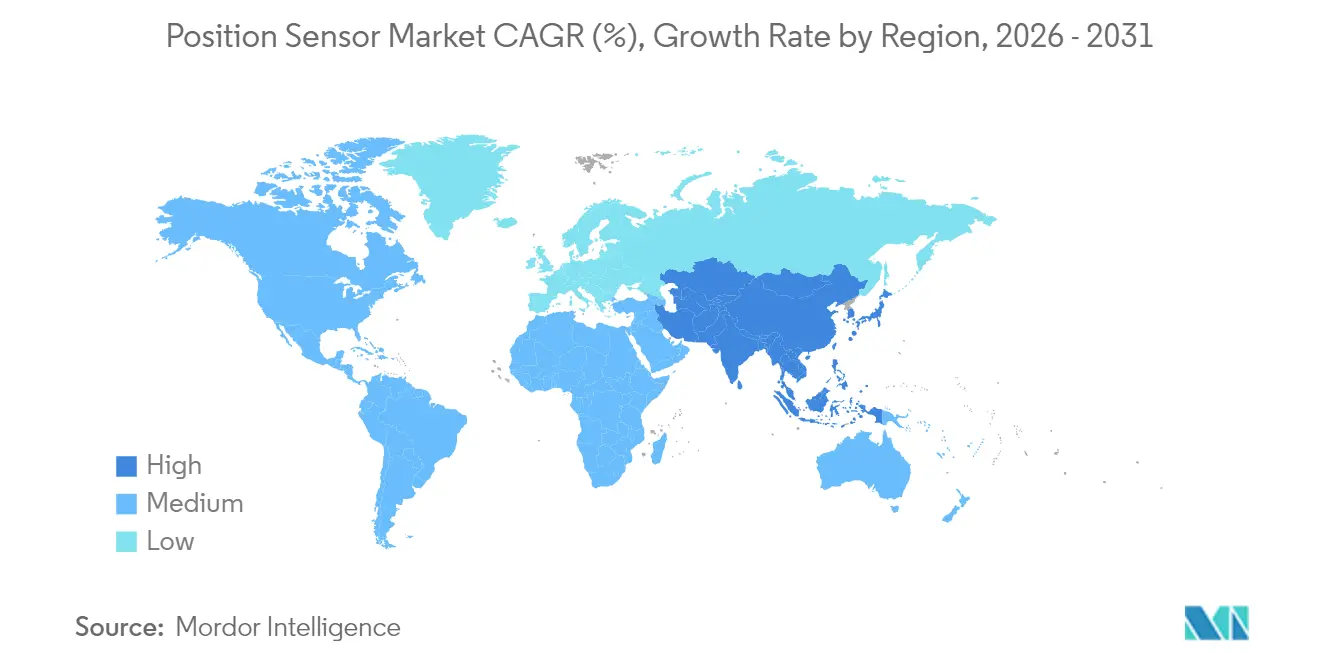
Asia-Pacific accounted for 45.60% of 2025 sales, boosted by China’s quest for 75% farm mechanization by 2025 and India’s USD 6 billion allocation for digital platforms under its Digital Agriculture Mission. The region’s projected 11.15% CAGR will keep it the growth engine for the position sensor market size through 2031. Imports of agricultural machinery into China rose 14.6% year on year, while India’s budget carved out USD 6 billion for remote-sensing infrastructure linking farm registries to credit and insurance engines. The region’s sustained double-digit expansion signals continual upgrades from basic GPS guidance to fully autonomous fleets, cementing Asia-Pacific’s role as the fulcrum of the position sensor market.
Europe is advancing the use of precision sprayers and autonomous weeding robots to achieve the pesticide-reduction targets outlined in the Green Deal. The European Commission earmarked EUR 15 million (USD 16.5 million) under Horizon Europe to pilot agrobotics in 2025. The North American market is expanding, supported by large contiguous fields that enable economies of scale for fully automated equipment. This growth is further reinforced by the 2024 Farm, Food, and National Security Act, which launched a Federal Precision Agriculture Task Force. The region's growth is driven by early adopter farms that frequently utilize advanced technologies such as 30-meter boom sprayers, auto-guided planters, and fully autonomous grain carts.
Water-scarce areas have demonstrated significant benefits from these advancements. For instance, Florida’s smart irrigation program saved 164 million gallons of water in 2024 by integrating soil-moisture probes with valve position sensors. While the region’s growth is steadier compared to Asia-Pacific, it remains positive due to incremental technological upgrades, tax incentives, and a robust ecosystem of retrofit kit suppliers, which continue to drive the position sensor market upward.

Regulatory Landscape
Position sensors used in automated agricultural machinery increasingly fall under functional-safety and machinery-safety frameworks that treat sensing hardware, and in some cases embedded software, as safety-relevant elements. In the European Union, Regulation (EU) 2023/1230 on machinery (consolidated text updated through May 2026) strengthens health and safety requirements for machinery, and explicitly brings certain digital components within the definition of safety components when they perform safety functions. This raises the bar for position-sensing systems integrated into safety-related control architectures.
Electrical safety requirements in agricultural equipment also influence sensor selection and design, especially as platforms move to higher-voltage electrical subsystems. ISO published ISO 23285:2025 (February 2025), which specifies safety design requirements for electrical and electronic components operating between 32 V and 75 V DC in agricultural tractors and implements. It reinforces needs around insulation, diagnostics, and robust interfaces for sensors operating near electrified drivetrains and actuators. In the United States, regulatory activity around farm equipment use and maintenance also intersects with sensor-enabled controls, including February 2026 US EPA guidance stating that the Clean Air Act supports farmers rights to perform their own equipment repairs. That guidance shapes how OEMs and suppliers approach serviceability and diagnostics for sensorized subsystems.
Value Chain Analysis
The position sensor value chain starts with materials and component inputs (semiconductors for Hall/AMR/TMR and MEMS devices, magnetics including rare-earth magnets for magnetic sensing, optical emitters and receivers, and ruggedized housings and connectors) that feed sensor design, packaging, and module assembly. Sensor manufacturers then supply discrete sensors or smart sub-modules to OEMs and tier suppliers building tractors, harvesters, sprayers, and implements, along with retrofit kit providers. Downstream, distributors and integrators bundle sensors with GNSS/INS, vision, and control electronics for precision guidance and autonomy, while aftermarket channels support replacement demand in hydraulic cylinders, hitches, and steering systems where uptime and field serviceability matter.
Integration and interoperability are now a value-capture point as agriculture platforms shift from standalone measurement to multi-sensor fusion. Partnerships increasingly emphasize technical integration. For example, Topcon Agricultures collaboration with Bonsai Robotics in February 2025 aims to integrate vision-based autonomy with smart implement controls, Kubotas partnership with Agtonomy in June 2025 focuses on advancing autonomous operations on M5N tractors, and CHC Navigations December 2025 partnership with CNH Industrial supports FP FleetPro precision agriculture kits. These collaborations point to a value chain shift toward integrated control stacks (sensor hardware plus software interfaces and data flow), where ruggedization, calibration stability, and digital interfaces such as CAN and SENT affect supplier qualification and recurring aftermarket attach.
Competitive Landscape
The position sensor market displays moderate fragmentation. The top five vendors, Honeywell International, TE Connectivity, SICK, TDK, and Balluff, captured nearly 42.3% of 2024 sales, leaving material headroom for niche specialists and start-ups. Honeywell leverages industrial automation pedigrees to supply rugged Hall-effect solutions that tolerate 1,000-psi wash-downs, while TE Connectivity emphasizes sealed connectors that combine sensing and data pathways for plug-and-play retrofits.
Strategic positioning is tilting toward platform ecosystems rather than standalone components. SICK’s 2023 revenue climbed 5.4% to EUR 2.307 billion (USD 2.497 Billion) as it partnered with Endress+Hauser for joint channel coverage and tapped Aeva’s FMCW chipsets to embed 4D lidar into short-range distance modules. TDK expands through redundant TMR stacks certified to the toughest automotive safety levels, furnishing OEMs with pre-qualified parts that cut project timelines.
Mergers and joint ventures highlight the premium on data and integration. Infineon’s Ethernet purchase fortifies a vertically integrated stack that blends secure networking with angle measurement, while AGCO’s Trimble transaction seeds a cross-brand autonomy platform. White-space opportunities cluster in battery-free, energy-harvesting sensors, and on-sensor AI that performs health analytics, offering disruptors a path to sidestep entrenched volume contracts.
Position Sensor Industry Leaders
Honeywell International Inc.
TE Connectivity Ltd.
SICK AG
Infineon Technologies AG
Texas Instruments Incorporated
- *Disclaimer: Major Players sorted in no particular order


Market Opportunities and Future Outlook
Opportunities focus on moving from single-function sensors to consolidated sensing nodes and validated interfaces that simplify autonomy-ready architectures in harsh field environments. A tangible indicator is Gefrans 2026 introduction of the TWIIST multivariable sensor, which combines position with speed, inclination, and vibration. This aligns with OEM demand to reduce wiring, improve diagnostics, and support predictive maintenance using fewer sealed devices. With non-contact technologies already holding a majority share (61.25% in 2025), suppliers can differentiate through higher functional-safety content (redundancy and on-chip diagnostics) and through industrialized sensor-fusion readiness that helps OEMs integrate GNSS/INS, vision, and LiDAR controllers.
A second whitespace area is modular retrofit and aftermarket kits that bring digital protocols and closed-loop implement control to a large installed base still dominated by analog outputs (57.30% share in 2025). Recent OEM and ecosystem activity supports this direction, including CHC Navigation and CNH Industrials 2025 partnership for the FP FleetPro aftermarket kit line and the broader shift toward API-driven integrations referenced across 2025 precision agriculture partnerships. Outside field machinery, expanding sensorized automation across livestock and controlled environments widens the demand pool for rugged position and displacement sensing embedded into feeders, gates, conveyors, and robotic handling, building on the markets main revenue engine in agricultural vehicles and self-propelled machinery (48.20% share in 2025).
Recent Industry Developments
- July 2026: Infineon Technologies AG completed the acquisition of ams OSRAMs non-optical analog/mixed-signal sensor portfolio. The deal strengthens Infineons sensor breadth for industrial and automotive position and related sensing, supporting tighter integration of sensing with its power and connectivity stack for rugged applications.
- April 2025: Infineon acquired Marvells automotive Ethernet assets for USD 2.5 billion. Bringing high-speed in-vehicle networking into the portfolio supports sensor-to-controller data paths and functional-safety architectures that depend on deterministic communications alongside position sensing.
- December 2024: Aeva expanded its collaboration with SICK to commercialize FMCW lidar modules for factory and agricultural automation, with first shipments planned for mid-2025. The expanded collaboration reinforces the shift toward sensor fusion where position and distance sensing are combined to enable guidance, obstacle detection, and autonomous operation.


Research Methodology Framework and Report Scope
Market Definition and Coverage
This market covers position sensors that measure linear or rotary movement and provide absolute or incremental position output. They are sold as discrete sensor parts or as sensor sub-modules, used in end systems across automotive, industrial equipment, consumer devices, medical, and aerospace.
Scope exclusions: simple on-off proximity switches, generic inertial IMUs, and limit sensors used only for binary detection are excluded.
Segmentation Overview
- By Type
- Linear Sensors
- Rotary Sensors
- Proximity/Displacement Sensors
- Other Types
- By Technology
- Contact
- Non-contact
- By Output Interface
- Analog
- Digital
- By Agricultural Application
- Agricultural Vehicles/Self-propelled Machinery
- Livestock Position and Health Monitoring
- Indoor/Vertical Farming Automation
- Other Agricultural Applications
- By Geography
- North America
- United States
- Canada
- Mexico
- Rest of North America
- South America
- Brazil
- Argentina
- Rest of South America
- Europe
- Germany
- United Kingdom
- France
- Russia
- Spain
- Rest of Europe
- Asia-Pacific
- China
- Japan
- India
- Australia
- Rest of Asia-Pacific
- Middle East
- Saudi Arabia
- United Arab Emirates
- Rest of Middle East
- Africa
- South Africa
- Nigeria
- Rest of Africa
- North America
Data Sources, Market Sizing, and Validation
Desk Research
Desk research starts with public baselines that help us size demand pools and sanity check how quickly position sensor adoption is changing by application. For core references, we used US Census Bureau manufacturing and trade tables, UN Comtrade trade flows, and ISO publications on sensor-related standards, along with IEEE and other peer reviewed engineering journals and patent databases to track technology shifts and design migration.
To translate this into a usable model, we also reviewed company filings and earnings decks, association websites, and reputable business press to understand shipment momentum, pricing direction, and where design wins are shifting by region. In a few places, we complemented the public trail with paid subscriptions focused on company financials and intelligence, news and financials, and patent databases, mainly to reduce the time spent on cross-checking. The desk sources listed here are illustrative, and we used many other public references for data collection, validation, and clarification.
Primary Interviews and Surveys
Primary work was used to confirm which position sensor types are being specified in new platforms, how ASPs are moving as content and packaging change, and which end uses are driving the most volume. We spoke with a mix of component suppliers, module integrators, automation and machine builders, and OEM facing engineering and sourcing roles across APAC, EMEA, and the Americas. The respondent inputs were then used to close gaps and align assumptions with observed buying patterns, especially around where linear versus rotary content is being added.
Distribution of primary research fieldwork respondents
| Company type | Respondent position | Region |
|---|---|---|
| Top tier: 26% | CXOs: 13% | APAC: 42% |
| Mid tier: 56% | Functional/Unit leaders: 42% | EMEA: 35% |
| Smaller Players: 18% | Managers: 45% | Americas: 23% |
Market-Sizing & Forecasting
For sizing, we use a top-down build that reconstructs the addressable demand pool from end-use production activity and equipment build cycles, and then applies position sensor content per unit where it is technically required. After the first pass is built, the totals are corroborated with selective bottom-up checks such as sampled supplier revenue rollups, channel feedback on unit volumes, and simple ASP times volume math for a few high-usage applications.
Inputs in the model include factory automation and machinery output trends, vehicle production and electrification mix, the share of contact versus non-contact sensing in new designs, average sensors per system for linear and rotary use cases, and regional import and export direction for sensor components. Pricing is handled through a practical ASP progression that reflects mix shift into smarter modules and digital outputs, and it is then pressure tested through interview feedback tied to platform refresh timing. For forecasting, scenario analysis is used around adoption speed and pricing, anchored to expert views on automation capex cycles and platform refresh timing, before the final time series is locked.
Data Validation & Update Cycle
Outputs are checked in more than one way so results do not rely on a single assumption. We compare the modeled totals against independent signals such as trade flow direction, disclosed sensor and automation revenue cues, and end-use production indicators, and then review outliers until the story is consistent across the different inputs.
Before sign-off, the model and write-up go through multi-step analyst review, with re-contact triggers when a key assumption shifts or when a new data point creates an unexpected variance. Reports are refreshed annually, and interim updates are made when material events occur. Right before delivery, a final pass is completed so clients receive the most current view available at that time.
Mordor Intelligence's Position Sensor Market Size Versus Other Published Estimates
It is common to see different market values for position sensors because published studies do not always count the same product set, price level, or shipment timing. Differences also show up when one estimate relies heavily on broad electronics totals, while another rebuilds demand from end-use production and then applies sensor content and pricing.
The main gap drivers are scope boundaries (for example, whether simple proximity switches or IMUs are counted), the choice of base year and currency timing, and how ASP change is treated when smart modules gain share. Another frequent reason is refresh cadence, since automotive and factory automation cycles can shift quickly, and that then changes near-term volumes and the starting point for the forecast.
Benchmark comparison
| Source | Market Size | Gaps in Research Methodology |
|---|---|---|
| Mordor Intelligence | USD 9.31 B (2026) | |
| Industry Publisher A | USD 6.67 B (2024) | Uses an earlier base year and does not clearly state exclusions around binary-only proximity switches and IMUs, which can compress or expand the addressable pool depending on what is implicitly included. |
| Global Consultancy B | USD 8.68 B (2025) | Starts from a different base year and segment mix, and the pricing path appears to assume a faster blend into higher-value categories, which can lift the total without the same volume checks tied to end-use build rates. |
The spread in values mainly comes down to what is counted as a position sensor, which year anchors the series, and how price and mix are moved forward. When binary-only devices and generic motion sensing are kept out, and when end-use production signals are used as the demand spine, the estimate stays more traceable to real shipment drivers, a modeling choice applied by Mordor Intelligence.


Key Questions Answered in the Report
What is the current value of the agricultural position sensor market?
The market stands at USD 9.31 billion in 2026 and is projected to reach USD 14.79 billion by 2031.
Which region contributes the most demand?
Asia-Pacific leads with 45.60% of 2025 revenue thanks to aggressive mechanization targets and digital agriculture funding.
Which sensor type holds the largest share?
Linear position sensors account for 40.45% of 2025 sales because they are integral to hydraulic depth and lift control.
What technology segment is expanding fastest?
Non-contact sensors are forecast to grow at a 12.20% CAGR as autonomous equipment demands maintenance-free feedback.
How concentrated is supplier power?
The top five vendors capture just over 42.3% of revenue, indicating a moderately fragmented landscape where new entrants can still gain traction.
What regulatory trend most affects sensor design?
ISO 26262 functional-safety requirements compel on-chip diagnostics and redundant channels, lengthening design cycles but raising performance standards.
Page last updated on:


 Your data is secure and never sold or shared.


