
Port Equipment Market Size and Share
Market Overview
| Study Period | 2020 - 2031 |
|---|---|
| Market Size (2026) | USD 21.66 Billion |
| Market Size (2031) | USD 28.16 Billion |
| Growth Rate (2026 - 2031) | 5.39 % |
| Fastest Growing Market | Asia Pacific |
| Largest Market | Asia Pacific |
| Market Concentration | Medium |
Major Players *Disclaimer: Major Players sorted in no particular order Image © Mordor Intelligence. Reuse requires attribution under CC BY 4.0. | |
Port Equipment Market Analysis by Mordor Intelligence
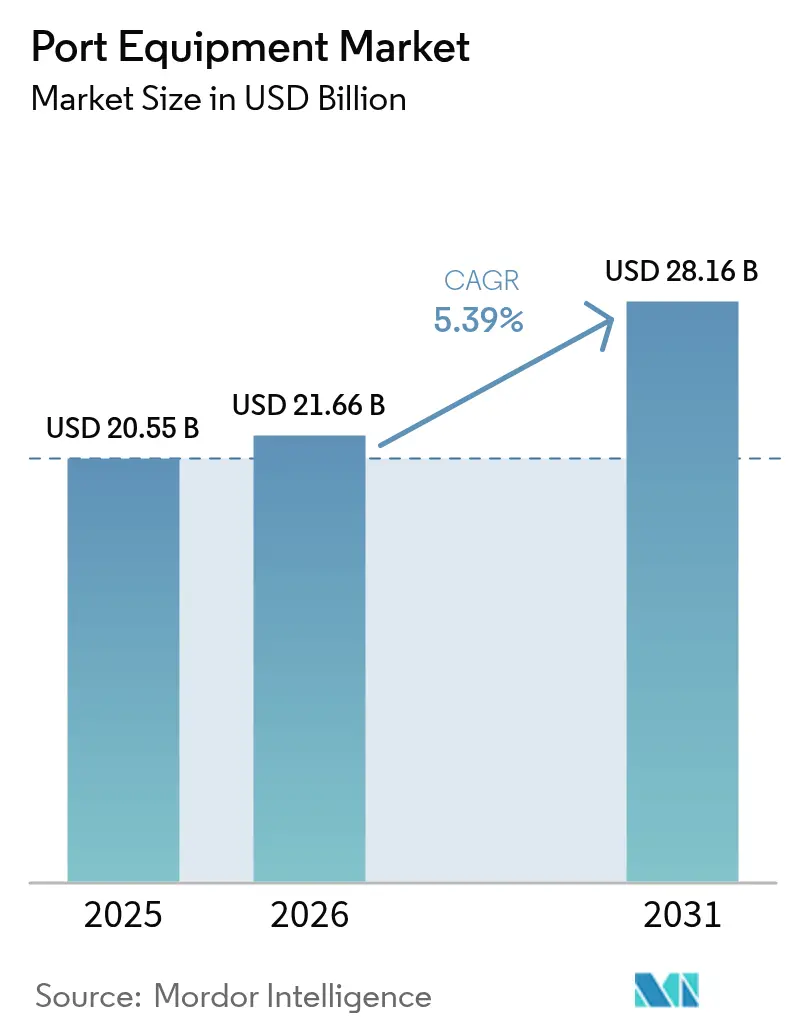
Port equipment market size in 2026 is estimated at USD 21.66 billion, growing from 2025 value of USD 20.55 billion with 2031 projections showing USD 28.16 billion, growing at 5.39% CAGR over 2026-2031. Rising container‐ship sizes, stricter decarbonization rules, and accelerated terminal automation continue to reshape procurement decisions in every major gateway. Container throughput has already set fresh records, with China’s automated ports alone processing 16.04 billion tons of cargo and 300 million boxes in 2024, a 3.4% year-on-year rise [1]“2024 Port Throughput Statistics,” Ministry of Transport of the People’s Republic of China, mot.gov.cn. Geopolitical tensions are also influencing sourcing strategies, evidenced by the United States’ USD 20 billion push to onshore crane manufacturing and harden port cyber-security. Meanwhile, Asia Pacific maintains the largest regional foothold, and cranes remain the most purchased equipment class.
Key Report Takeaways
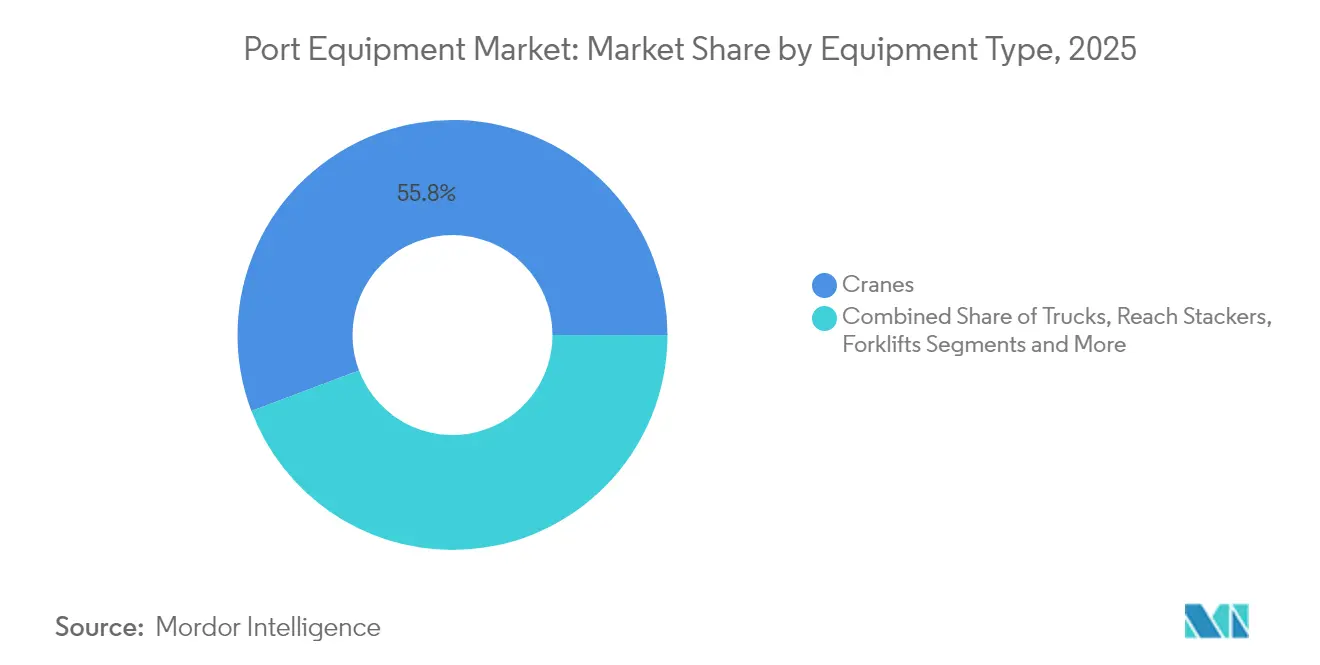
- By equipment type, cranes commanded 55.76% of the port equipment market share in 2025 and are projected to expand at a 6.97% CAGR during the forecast period (2026-2031).
- By application, container handling led the port equipment market with 54.22% of the share in 2025; warehouse and yard logistics are expected to grow at an 8.03% CAGR during the forecast period (2026-2031).
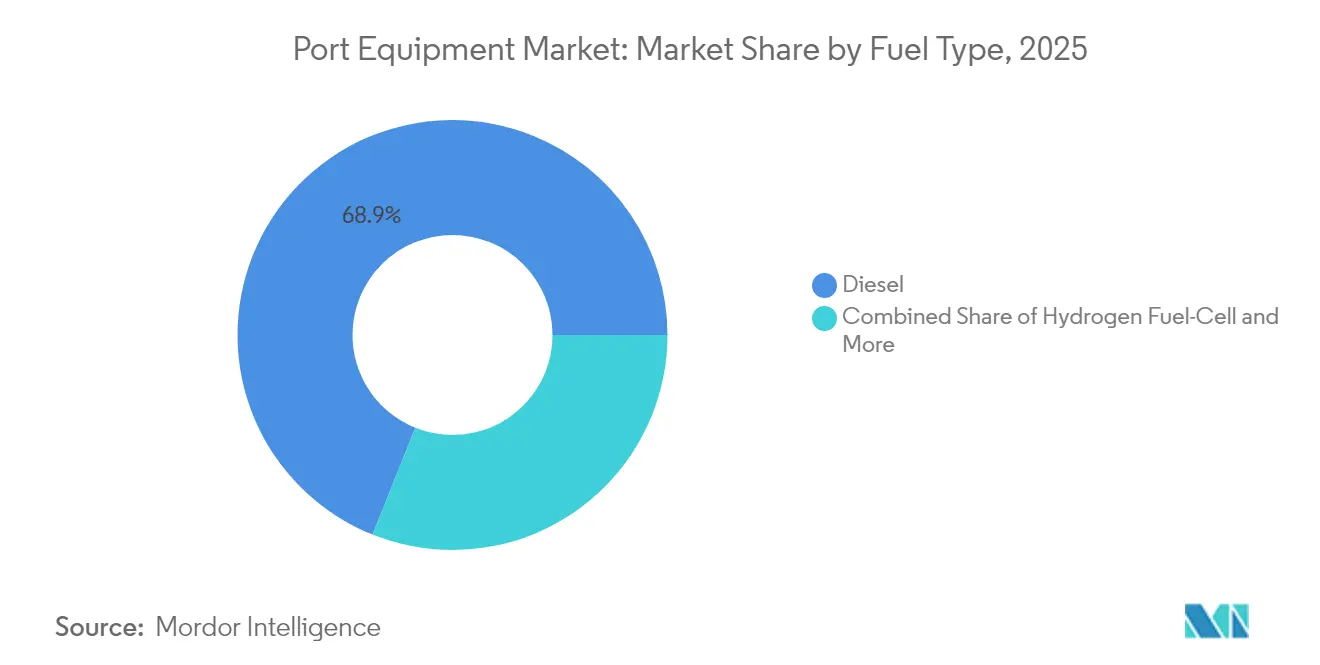
- By fuel type, diesel units accounted for 68.94% of the port equipment market share in 2025, while electric and hybrid models are forecast to post a 8.95% CAGR during the forecast period (2026-2031).
- By operation mode, conventional (manual/semi-auto) accounted for 90.92% of the port equipment market size in 2025, while fully autonomous models are forecast to grow at a 16.05% CAGR during the forecast period (2026-2031).
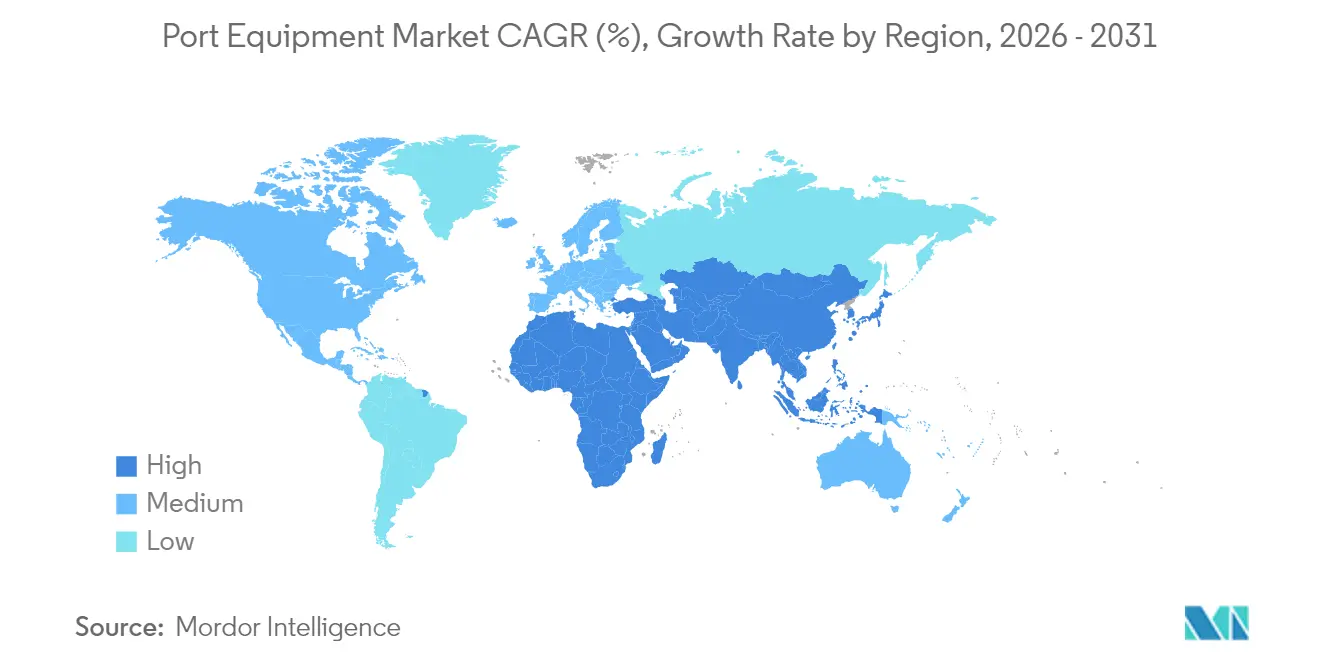
- By geography, the Asia Pacific held 45.88% of the port equipment market share in 2025; the region is anticipated to register a 6.18% CAGR during the forecast period (2026-2031).
Note: Market size and forecast figures in this report are generated using Mordor Intelligence’s proprietary estimation framework, updated with the latest available data and insights as of 2026.
Market Trends and Insights
Drivers Impact Analysis of Port Equipment Market*
| Driver | (~) % Impact on CAGR Forecast | Geographic Relevance | Impact Timeline |
|---|---|---|---|
| Surge in Container-Ship Sizes | +1.2% | Global hubs | Medium term (2-4 years) |
| Stricter Port-side Decarbonization Mandates | +0.9% | North America and EU; expanding to APAC | Long term (≥ 4 years) |
| Rapid Terminal Automation | +0.8% | APAC core; spill-over to MEA | Medium term (2-4 years) |
| Tariff Threat on Chinese Cranes | +0.6% | North America; secondary in EU | Short term (≤ 2 years) |
| OT Cyber-Security Compliance | +0.4% | Global; led by North America | Medium term (2-4 years) |
| Autonomous, Remotely-Operated Vehicles | +0.3% | APAC and EU early adopters | Long term (≥ 4 years) |
| Source: Mordor Intelligence | |||
Surge in Container Ship Sizes Driving Demand for Mega-STS And ASC Cranes
Ultra-large container vessels now measure 400 m and carry up to 23,000 TEU, forcing terminals to procure quay cranes with outreach beyond 74 m to clear 24 rows. Each call can require 3,800 trucks and 50 freight trains, straining gate, yard, and rail assets as seen at Hamburg. The Port of Savannah recently took delivery of the East Coast’s largest STS cranes to handle 16,000 TEU ships, adding around 1.5 million TEU of annual capacity. Yet crane productivity has climbed only 90% in two decades versus a 202% jump in bay size, widening operational bottlenecks and stimulating demand for automation and twin-lift spreaders.
Stricter Port-Side Decarbonization Mandates are Accelerating Electric and Hybrid Fleets
California requires 90% zero-emission cargo-handling equipment by 2036, a rule affecting about 33,500 drayage trucks and thousands of terminal assets [2]“In-Use Locomotive & Cargo Handling Rule,” California Air Resources Board, arb.ca.gov. Terminals are reacting: APM Suape allocated USD 47 million for 28 all-electric units to become South America’s first fully electrified site by 2026. An electric STS crane can save USD 3.3 million in diesel and cut 776 t of CO₂ yearly, bolstering the business case. The Zero Emission Port Alliance expects 94% of member purchases to be battery-electric by 2035, underpinning standards for tractors and straddle carriers.
Rapid Terminal Automation to Offset Labor Shortages and Boost Throughput
China already operates 52 automated container and bulk terminals, with Qingdao posting a 15% throughput lift and Yantai a 20% efficiency gain. At Rotterdam, the Maasvlakte II facility realised a 40% productivity jump by pairing remotely-operated STS cranes with battery AGVs. Despite benefits, only 4% of all container terminals are fully automated, largely because projects can cost USD 500 million-USD 1 billion, although phased roll-outs ease disruption.
Tariff Threat on Chinese Cranes Reshaping Regional Sourcing Strategies
Washington has imposed fresh tariffs and offered a USD 20 billion incentive package to build cranes domestically, targeting China’s ZPMC, which holds a significant share in India and a substantial footprint in US facilities. Konecranes and PACECO are forming US partner networks to produce Build America, Buy America-compliant machines, a shift that opens the door for European contenders.
Restraints Impact Analysis of Port Equipment Market*
| Restraint | (~) % Impact on CAGR Forecast | Geographic Relevance | Impact Timeline |
|---|---|---|---|
| Multi-Million-Dollar CAPEX and Long ROI Cycles | -1.1% | Global; acute in emerging markets | Long term (≥ 4 years) |
| Raw-Material Price Volatility | -0.7% | Manufacturing-intensive regions | Medium term (2-4 years) |
| Equipment-Leasing Boom | -0.5% | North America and EU; expanding globally | Medium term (2-4 years) |
| Geopolitical Export-Controls | -0.4% | Restricted markets | Short term (≤ 2 years) |
| Source: Mordor Intelligence | |||
Multi-Million-Dollar CAPEX and Long ROI Cycles
Automating a terminal can demand USD 500 million–USD 1 billion, with breakeven volumes exceeding 544,000 TEU in a nine-berth design. More than 50% of equipment is now financed externally, and leasing is rising as operators seek to avoid heavy upfront cash outflows [3]“2024 US Equipment Finance Outlook,” Equipment Leasing & Finance Association, elfaonline.org. Extended ROI horizons curb purchasing appetite, giving momentum to equipment-as-a-service contracts that bundle maintenance yet potentially reduce fresh unit sales.
Raw-Material Price Volatility
Steel hit USD 950 t in March 2022 before sliding to USD 579.5 t by July 2024, forcing manufacturers to juggle surcharges and hedge inventories. Hyster-Yale still expects elevated freight and material costs despite strong margins. Electric drivetrains add rare-earth exposure for batteries and motors, making cost management central to competitive bids.
*Our forecasts treat driver/restraint impacts as directional, not additive. The impact forecasts reflect baseline growth, mix effects, and variable interactions.
Port Equipment Market Segment Analysis
By Equipment Type:
Cranes Dominate Amid Automation PushThe port equipment market size for cranes accounted for 55.76% share in 2025 and is on track for a 6.97% CAGR through 2031. Ship-to-shore models top purchase lists as operators retrofit outreach beyond 74 m to serve 24-row vessels. Projects such as Port Tanjung Pelepas’ five new ULCV quay cranes illustrate the rush to future-proof waterfront assets.Automated stacking cranes are gaining momentum; Hutchison BEST’s seven-block extension lifted yard capacity 25% while lowering truck re-handles. Rubber-tired and rail-mounted gantries are rapidly electrifying, with PSA Halifax contracting eight battery RTGs from Konecranes to create North America’s first fully electric yard. Trucks remain the fastest-growing sub-class as AGVs and terminal tractors integrate autonomy, vision sensors, and clean drivetrains. Toyota’s plan to ship Nagoya-proven AGVs abroad underscores the export potential of Asia-developed technology.


By Application:
Container Handling Leads, Warehouse Logistics AcceleratesContainer handling absorbed 54.22% of the port equipment market share in 2025 revenue, thanks to record volume expansion and mega-ship cascades. Newbuild STS cranes, yard automatons, and twin-lift spreaders dominate capex plans as ports chase berth productivity gains and shorter vessel dwell. Warehouse logistics, however, is projected to rise at an 8.03% CAGR as e-commerce-driven cross-docking boosts demand for automated mobile robots and intelligent conveyor systems.Bulk cargo handling keeps steady momentum in mineral-rich regions, supported by higher-capacity grabs and continuous ship-unloaders. Ship servicing—mooring, Ro-Ro and passenger terminals, receives targeted investments where cruise and vehicle trades rebound. Port infrastructure construction cycles create episodic spikes in heavy pile-drivers, dredgers, and lifting solutions as governments roll out economic stimulus packages.
By Fuel Type:
Electric Transition Accelerates Despite Diesel DominanceDiesel remains the workhorse with 68.94% of the port equipment market share in 2025, valued for range and refueling speed in remote berths. Regulatory headwinds and TCO economics propel electric and hybrid equipment at a 8.95% CAGR through 2031, making it the most dynamic segment in the port equipment market. Toyota Material Handling’s USD 100 million electric forklift plant illustrates shifting manufacturing footprints as battery demand scales.Hydrogen fuel cell prototypes are moving from pilot to limited fleet status. MITSUI E&S and PACECO fielded the Port of Los Angeles’s first hydrogen RTG, matching diesel performance without grid hooks. Meanwhile, Taylor Machine Works is pairing Cummins-built engines to reach commercial scale. Powertrain diversity is turning into a core spec line-item as operators demand options to meet evolving emissions caps and uptime targets.
By Operation Mode:
Conventional Operations Dominate, Autonomous Systems Show Explosive GrowthManual and semi-automated operations accounted for 90.92% of the port equipment market in 2025, underscoring the enduring reliance on human oversight for complex lifts, exception handling, and berth safety. Conventional fleets benefit from lower upfront costs, established maintenance regimes, and workforce familiarity, making them the default choice for many emerging-market ports. Remote-controlled variants add incremental efficiency without the disruptive capex of full automation, enabling operators to phase upgrades around berth expansions. However, labour shortages, safety requirements, and rising vessel exchanges are exposing productivity ceilings that manual systems struggle to breach.Fully autonomous operations are projected to surge at a 16.05% CAGR through 2031, fuelled by successful deployments such as Qingdao and Yantai, where throughput and efficiency rose 15% and 20% respectively. APM Terminals’ Maasvlakte II demonstrated a 40% productivity uplift by pairing unmanned STS cranes with battery AGVs, validating the return on high-automation capex. Costs remain a barrier—projects can range from USD 500 million to USD 1 billion per terminal, but phased rollouts and performance-based financing are narrowing the gap. Toyota Industries’ plan to export AGVs proven at Nagoya Port, where units achieve 20 mm positioning accuracy, signals a maturing supplier base that should accelerate scale adoption. As technology prices fall and regulatory bodies tighten safety and emissions targets, autonomous systems are set to reshape future order books.
Geography Analysis
APAC Port Equipment Market
Asia Pacific accounted for 45.88% of the port equipment market in 2025 and is forecast to expand at a 6.18% CAGR through 2031. China anchors the region with 52 automated terminals processing 16.04 billion t of cargo a year, reinforcing the port equipment market’s growth engine. Singapore’s PSA Tuas Port typifies regional ambition as it targets 65 million TEU annual capacity through AI-enabled automation. India’s restrictions on Chinese crane purchases are opening opportunities for domestic and non-Chinese suppliers to gain share.
North America and EMEA Port Equipment Market
North America generated demand spikes after Washington announced tariffs on Chinese cranes alongside a USD 20 billion incentive for local manufacturing. The United States Coast Guard’s cybersecurity directives are pushing ports to retrofit or replace roughly 200 Chinese-made units, creating a parallel services market. Canada is prioritizing electrification, with PSA Halifax ordering eight battery RTGs as part of a nationwide zero-emission strategy. Together, these factors are reshaping sourcing models and accelerating technology upgrades across the continent.Europe held a substantial revenue share in the port equipment market in 2024 and continues to drive sustainability and digital integration agendas. EUROGATE has rolled out a 5G campus network across Hamburg, Bremerhaven and Wilhelmshaven to support remote operations and real-time diagnostics. The Middle East and Africa are emerging as high-growth zones as governments deploy sovereign infrastructure funds to modernize gateways. DP World has pledged USD 3 billion for African terminal projects, while Saudi Arabia’s NEOM port is installing automated cranes ahead of a 2026 launch. Egypt has also attracted USD 700 million from Hutchison Ports for new facilities at Sokhna and Alexandria, underscoring the region’s rising equipment appetite.

Regulatory Landscape
Port equipment procurement is increasingly shaped by emissions, safety, and digital interoperability requirements from intergovernmental bodies and standards organizations. MARPOL Annex VI amendments that entered into force in March 2026, along with SOLAS Regulation II-1/3-13 effective in January 2026, influence how ports and ship operators specify lifting, certification, and engine-related emissions controls across handling and servicing activities.
Formal standards activity also continued through 2026. CEN published EN 15056:2026 for container handling spreaders, BSI PAS 4000:2026 (sponsored by Terminal Industry Committee 4.0) to support a shared information model for cargo-handling facilities digitalization, and GB/T 26474-2026 for container front-loading cranes. ZPMC issued two industry standards for intelligent quay and gantry crane technology in April 2026, scheduled to take effect on September 1, 2026, with higher requirements for sensor integration, intelligent control, and verified automated safety protocols in smart crane deployments.
Value Chain Analysis
The port equipment value chain runs from upstream steel and components through OEM engineering, fabrication, and assembly, then into delivery, installation, commissioning, and long-life aftermarket services such as spares, inspections, retrofits, and uptime contracts. Electrification and automation are shifting more value toward software, energy systems, and integration work, since terminals need equipment control systems, interfaces to terminal operating systems, connectivity, and cybersecurity-aligned architectures alongside the physical machines.
Downstream procurement is increasingly tied to multi-year terminal modernization programs and greenfield developments that combine private capital with operator-led system integration. In January 2026, CMA CGM raised USD 2.4 billion through a joint venture with Stonepeak (United Ports LLC) to manage and upgrade 10 port properties, while in Q2 2026 YILPORT Holding ordered 53 automated and manual E-Hybrid RTG cranes from Konecranes for deployment across Europe, Africa, and Central America. Digital platforms are also becoming recurring nodes in the value chain, with Hutchison Ports Sohar deploying the nGen-VERONICA AI-enhanced TOS in November 2025 and EUROGATE and Embotech completing a six-month Autonomous Terminal Tractor pilot at Wilhelmshaven in November 2025.
Competitive Landscape
Market concentration is moderate. Kalmar, Konecranes, and ZPMC anchor the leaderboard, but rising players such as Sany and Liebherr are chipping into share by bundling automation suites with localized service offers. Cargotec’s 2024 decision to spin off Kalmar sharpened its product focus on container and heavy material handling, while Konecranes assembled a US supplier network to supply Build America-compliant cranes and widen its electrified yard range.
Differentiation is migrating from pure lifting capacity to integrated software, cyber resilience, and energy flexibility. ZPMC retains a scale advantage, yet security scrutiny in the United States and parts of Europe is opening opportunities for rivals. Liebherr’s USD 2.8 billion zero-emission mining equipment pact with Fortescue hints at cross-industry spill-over, foreshadowing hydrogen and battery modules cascading into port assets.
Equipment-as-a-service offerings are growing. Kalmar and Hyster-Yale now package uptime guarantees and remote diagnostics in subscription form, shifting customer capex to opex and locking in data-rich relationships. Autonomous niche suppliers are partnering with incumbent OEMs to embed perception stacks, further fragmenting intellectual property ownership and revenue pools.
Port Equipment Industry Leaders
Liebherr Group
Kalmar (Cargotec)
Konecranes Oyj
Sany Heavy Industry Co., Ltd.
ZPMC (Shanghai)
- *Disclaimer: Major Players sorted in no particular order

Port Equipment Market Companies Covered in this Report
- Kalmar (Cargotec)
- Konecranes Oyj
- Liebherr Group
- ZPMC (Shanghai)
- Sany Heavy Industry Co., Ltd.
- Hyster-Yale Group
- Cavotec
- Paceco Corp.
- Terex Corporation
- Manitowoc
- Taylor Machine Works
- Toyota Material Handling
- TTS Group
- Famur Famak
- OUCO Industry
- Anupam Industries
- Mi-Jack Products

Market Opportunities and Future Outlook
Electrification at the yard and horizontal transport layers is creating near-term replacement and retrofit opportunities for terminals that want to cut emissions without rebuilding entire electrical infrastructure. A notable anchor signal is DP World deploying 35 electric terminal tractors at Jeddah Islamic Port in July 2026, as part of an USD 800 million terminal transformation.
Automation and connected operations also support demand for equipment that can be integrated into AI-enabled terminal platforms and private-network environments. Interoperability standards such as BSI PAS 4000:2026 and CEN EN 15056:2026 are expanding the market for compliant spreaders, intelligent crane packages, and related integration services that reduce commissioning friction across mixed OEM fleets. Adani Ports deployed automated cranes at Vizhinjam in June 2026, reflecting active rollout of autonomous equipment within a major port project.
Recent Industry Developments in Port Equipment Market
- July 2026: DP World signs USD 800 million terminal transformation contract at Jeddah Islamic Port, including quay and yard automation, energy management, and private-network integration. The deal shows a strong move toward digitized and energy-efficient port operations in a key Middle East corridor.
- June 2026: Adani Ports deploys fully automated container cranes at Vizhinjam International Seaport using ABB technology and AI-augmented platforms. This deployment reflects commercial-scale automation in India's southern coastline and expands the port's handling capacity with automated equipment and control systems.
- September 2025: Transnet agreed a port equipment deal with Liebherr in South Africa, signaling continued fleet renewal and reliability upgrades at major African gateways. The agreement also supports an ongoing service footprint in the region.


Port Equipment Market Report Scope and Research Methodology
Market Definition and Coverage
For this study, the port equipment market covers mobile and fixed machinery used inside port and terminal areas to move, lift, and position cargo, mainly containers, across berth, yard, and gate operations.
Scope exclusions: We exclude port operations services, civil construction works, and general-purpose warehouse equipment that is not primarily used in port terminals.
Segments Covered in This Report
- By Equipment Type
- Cranes
- Ship-to-Shore (STS)
- Rubber-Tyred Gantry (RTG)
- Rail-Mounted Gantry (RMG)
- Automated Stacking Cranes (ASC)
- Mobile Harbor Cranes
- Trucks
- Terminal Tractors
- Towing Tractors
- Automated Guided Vehicles (AGV)
- Reach Stackers
- Forklifts
- Others
- Cranes
- By Application
- Container Handling
- Bulk Cargo Handling
- Ship Handling (Mooring, Ro-Ro)
- Port Infrastructure Construction
- Warehouse and Yard Logistics
- By Fuel Type
- Diesel
- Electric and Hybrid
- Hydrogen Fuel-Cell
- By Operation Mode
- Conventional (Manual/Semi-Auto)
- Fully Autonomous
- By Geography
- North America
- United States
- Canada
- Rest of North America
- South America
- Brazil
- Argentina
- Rest of South America
- Europe
- Germany
- United Kingdom
- France
- Spain
- Italy
- Netherlands
- Russia
- Rest of Europe
- Asia-Pacific
- China
- India
- Japan
- South Korea
- Australia
- Rest of Asia-Pacific
- Middle East and Africa
- United Arab Emirates
- Saudi Arabia
- Turkey
- South Africa
- Egypt
- Rest of Middle East and Africa
- North America
Data Sources, Market Sizing, and Validation
Desk Research
Desk research started with mapping which port assets are typically purchased and then replaced over time, and then linking that to measurable trade and fleet indicators. Public sources were used to anchor the demand drivers and operating context, including UNCTAD trade and maritime statistics, World Bank logistics indicators, International Maritime Organization regulations, U.S. Bureau of Transportation Statistics datasets, and port authority annual reports and throughput dashboards.
We also reviewed company annual reports, investor presentations, and credible industry news to understand order cycles, electrification plans, and delivery lead times. For cross-checking financial and shipment signals, we referenced paid subscriptions that provide structured company financials and intelligence, plus an import and export shipment-level database where it was relevant for equipment movement patterns. The sources listed above are illustrative, and we relied on additional public and paid references during data collection, validation, and analysis.
Primary Interviews and Surveys
Primary work focused on validating what terminals actually procure, and how pricing changes with capacity, automation, and powertrain shifts. We spoke with equipment OEMs and distributors, terminal operators, and port project contractors across major trading regions, so assumptions on replacement cycles, average selling prices, and adoption of electric and hybrid handling units could be tightened against on-the-ground procurement behavior.
Distribution of primary research fieldwork respondents
| Company type | Respondent position | Region |
|---|---|---|
| Top tier: 29% | CXOs: 16% | APAC: 47% |
| Mid tier: 53% | Functional/Unit leaders: 32% | EMEA: 31% |
| Smaller Players: 18% | Managers: 52% | Americas: 22% |
Market-Sizing & Forecasting
Sizing was built using a top-down demand reconstruction that begins with container and bulk throughput trends, port capacity additions, and equipment intensity per terminal footprint, then translates those into annual purchasing needs. We corroborated the totals with selective bottom-up approximations, using sampled unit volumes by major equipment classes and typical ASP bands from channel checks and interview input.
Key inputs in the model included port container throughput growth, the share of automated yards, electrification adoption rates for handling fleets, replacement and refurbishment cycles, and capex timing for terminal expansion projects. Where direct unit data was patchy, we used ranges agreed with practitioners, then constrained them using port expansion pipelines and observed trade patterns.
For forecasting, we ran scenario analysis so base, conservative, and accelerated pathways could be tested against fuel transition pace and automation rollout speed. The final forecast follows the scenario that best matched expert expectations on equipment lead times, tender cadence, and near-term port modernization priorities.
Data Validation & Update Cycle
Model outputs were checked against independent signals, including announced terminal expansion budgets, equipment order visibility discussed in public filings, and trade growth data that affects utilization. Where large variances appeared by region or equipment class, we revisited the assumptions, then triggered targeted re-contacts to confirm whether the change was structural or mostly timing related.
Before sign-off, the work goes through multi-step analyst reviews where inputs, math, and logic are re-checked, and any outliers are explained in plain language. Reports are refreshed annually, with interim updates when material events occur, and a final pre-delivery review is completed so clients receive the latest updated view.
Mordor Intelligence's Port Equipment Market Sizing Compared With Other Published Estimates
Published market sizes for port equipment often look different because the scope boundary is not identical, and the same equipment can be counted under port machinery, terminal equipment, or broader port infrastructure categories. Differences also show up when sources use different base years, currency timing, and assumptions on electrification and automation premiums.
The biggest gap drivers typically come from what is treated as port equipment versus adjacent marine and infrastructure items, and whether the model is anchored on throughput signals or on production-side rollups. Assumptions on ASP progression also matter, since electric and hybrid units can shift average values quickly, particularly when large ports upgrade fleets in batches.
Benchmark comparison
| Source | Market Size | Gaps in Research Methodology |
|---|---|---|
| Mordor Intelligence | USD 21.66 B (2026) | |
| Industry Publisher A | USD 18.31 B (2024) | Uses an earlier base year and a narrower demand pool that leans on near-term purchases, which can understate replacement-led demand during expansion cycles. |
| Industry Data Provider B | USD 27.20 B (2024) | Broadens the scope into marine and port infrastructure items (such as tug boats and mooring systems) and mixes equipment with wider port facility categories, lifting the total beyond terminal handling machinery. |
The table shows a wide spread, and in Mordor Intelligence's model the total is tied to terminal and port handling machinery only, which avoids mixing in marine assets and broader infrastructure works. Once scope is aligned and the same time base is used, the remaining difference typically comes from how replacement cycles and ASP uplift from electrification and automation are applied, steps that can be repeated and checked.


Key Questions Answered in the Report
What is the current value of the port equipment market?
The port equipment market is valued at USD 21.66 billion in 2026 and is forecast to reach USD 28.16 billion by 2031.
Which equipment type holds the largest revenue share?
Cranes dominate with 55.76% of global revenue in 2025 and are projected to grow at a 6.97% CAGR through 2031.
How fast is electric port equipment growing?
Electric and hybrid models represent the fastest-expanding fuel segment, expected to post a 8.95% CAGR between 2026-2031.
Why is Asia Pacific the largest regional market?
The region benefits from China’s 52 automated terminals, sustained infrastructure spending and a 6.18% CAGR outlook.
Page last updated on:


 Your data is secure and never sold or shared.


