
Polyvinylpyrrolidone Market Size and Share
Market Overview
| Study Period | 2021 - 2031 |
|---|---|
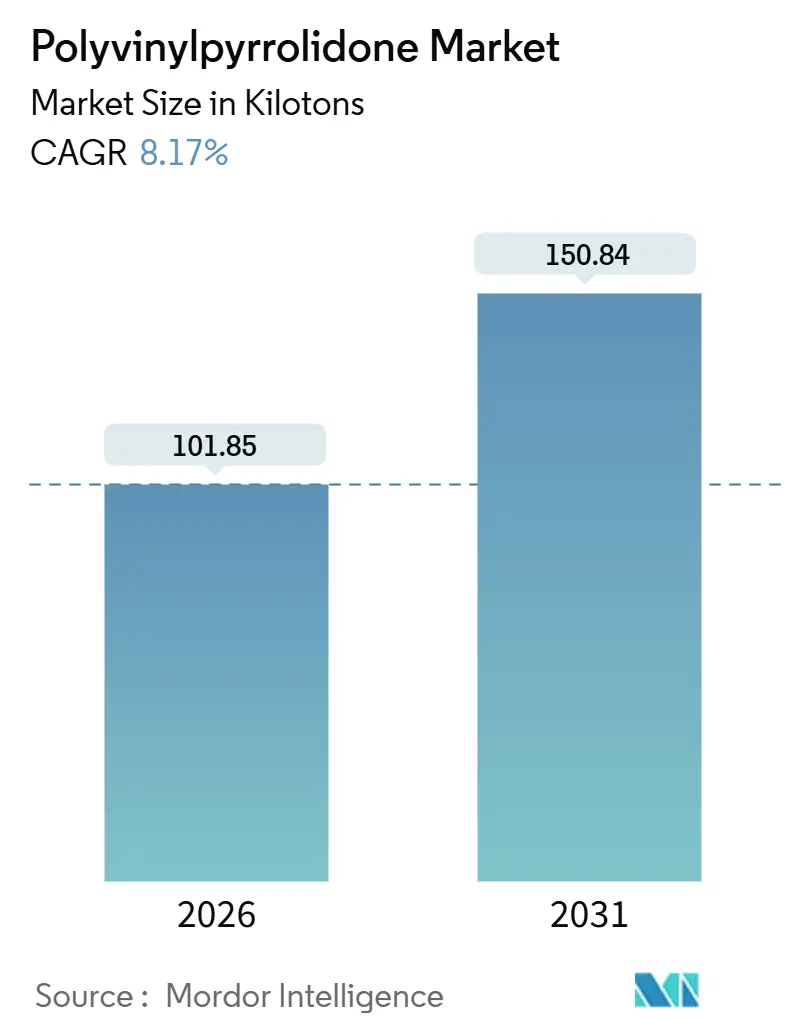
| Market Volume (2026) | 101.85 kilotons |
| Market Volume (2031) | 150.84 kilotons |
| Growth Rate (2026 - 2031) | 8.17 % |
| Fastest Growing Market | Asia Pacific |
| Largest Market | Asia Pacific |
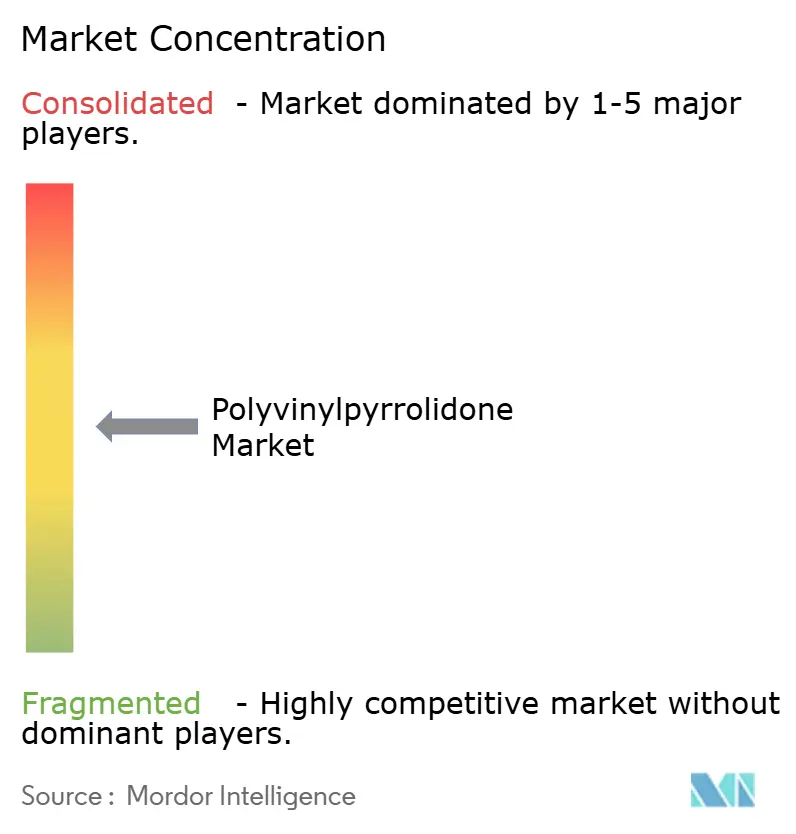
| Market Concentration | Medium |
Major Players *Disclaimer: Major Players sorted in no particular order Image © Mordor Intelligence. Reuse requires attribution under CC BY 4.0. | |
Polyvinylpyrrolidone Market Analysis by Mordor Intelligence
The Polyvinylpyrrolidone Market size is estimated at 101.85 kilotons in 2026, and is expected to reach 150.84 kilotons by 2031, at a CAGR of 8.17% during the forecast period (2026-2031). The upward curve reflects tightening residual-monomer limits that oblige excipient suppliers to retrofit purification trains, steady share migration toward spray-dried grades optimized for direct compression, and rising demand for K-value variants suited to controlled-release tablets. Supply-side capacity additions cluster in Asia, where vertically integrated plants curb feedstock risk, while downstream users in North America and Europe pursue silicone-free personal-care reformulations that depend on water-soluble PVP copolymers. On the risk ledger, acetylene-based N-vinylpyrrolidone costs track crude-oil swings, and emerging scrutiny of aquatic persistence signals potential producer-responsibility levies in Europe. Moderate consolidation persists because monomer backward integration remains capital-intensive, yet price competition in commodity grades has intensified as Chinese entrants elevate nameplate output by double digits.
Key Report Takeaways
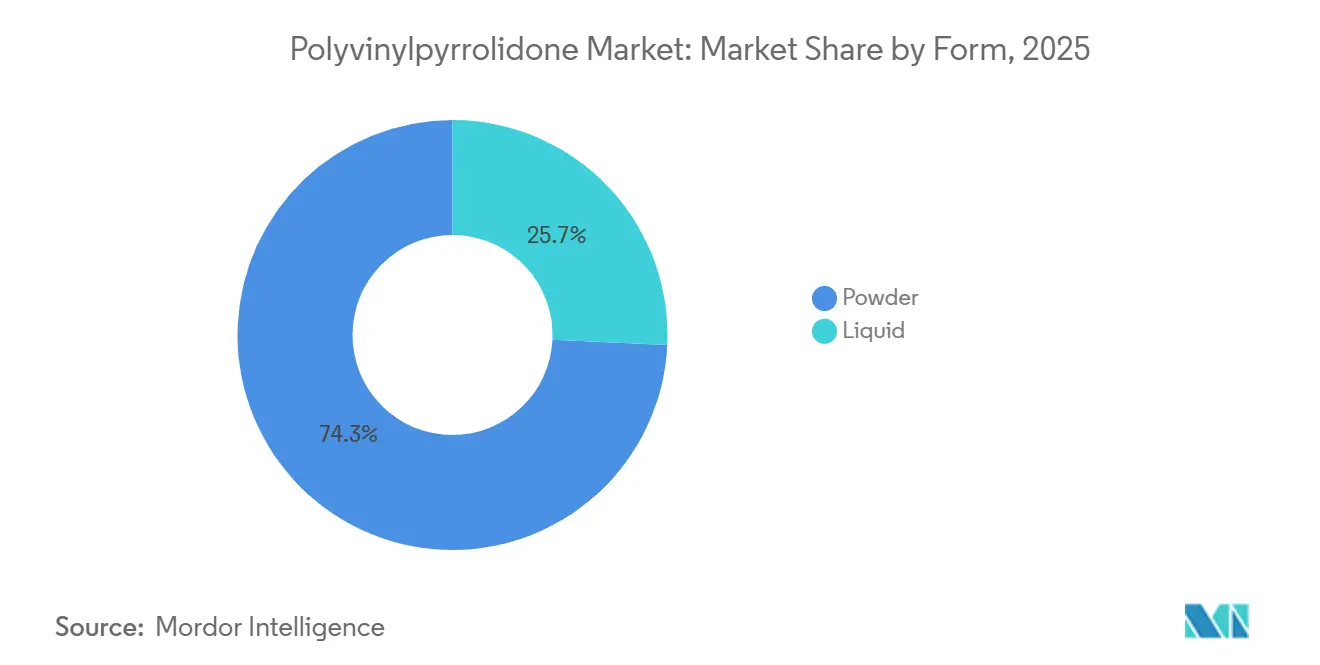
- By form, powder captured 74.26% revenue share in 2025 and is projected to expand at an 8.72% CAGR to 2031.
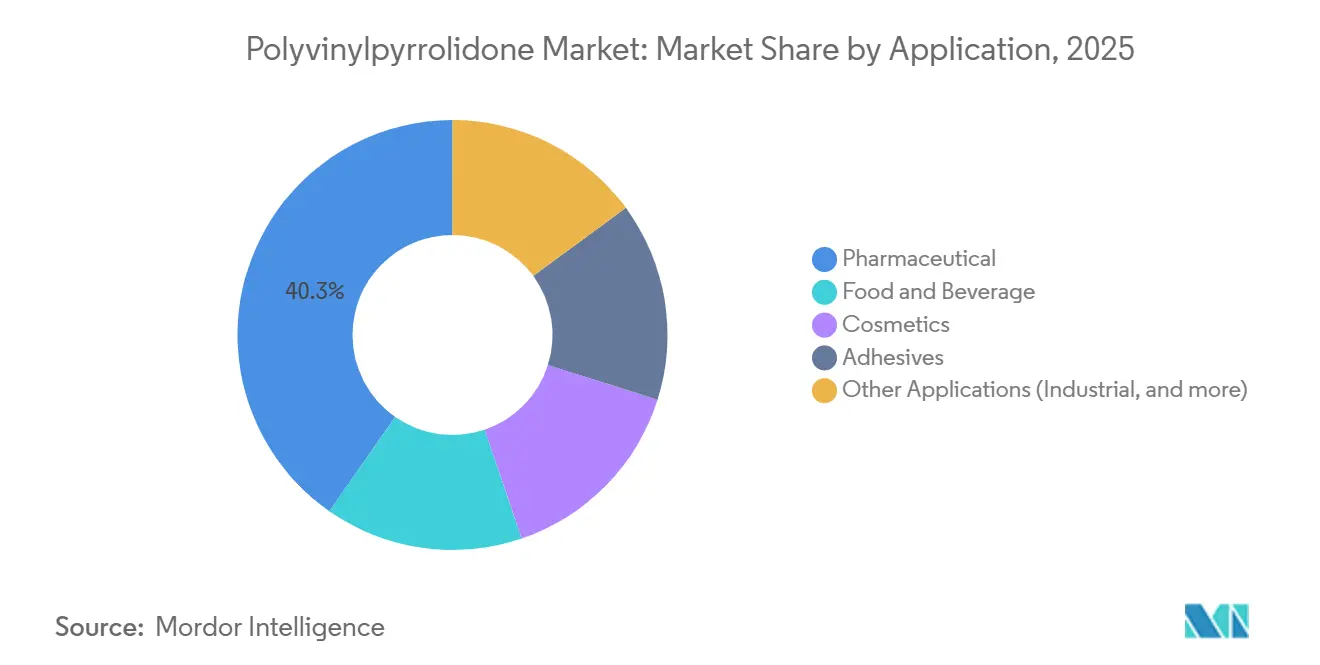
- By application, pharmaceuticals led with 40.28% of polyvinylpyrrolidone market share in 2025, while the segment is advancing at an 11.87% CAGR through 2031.
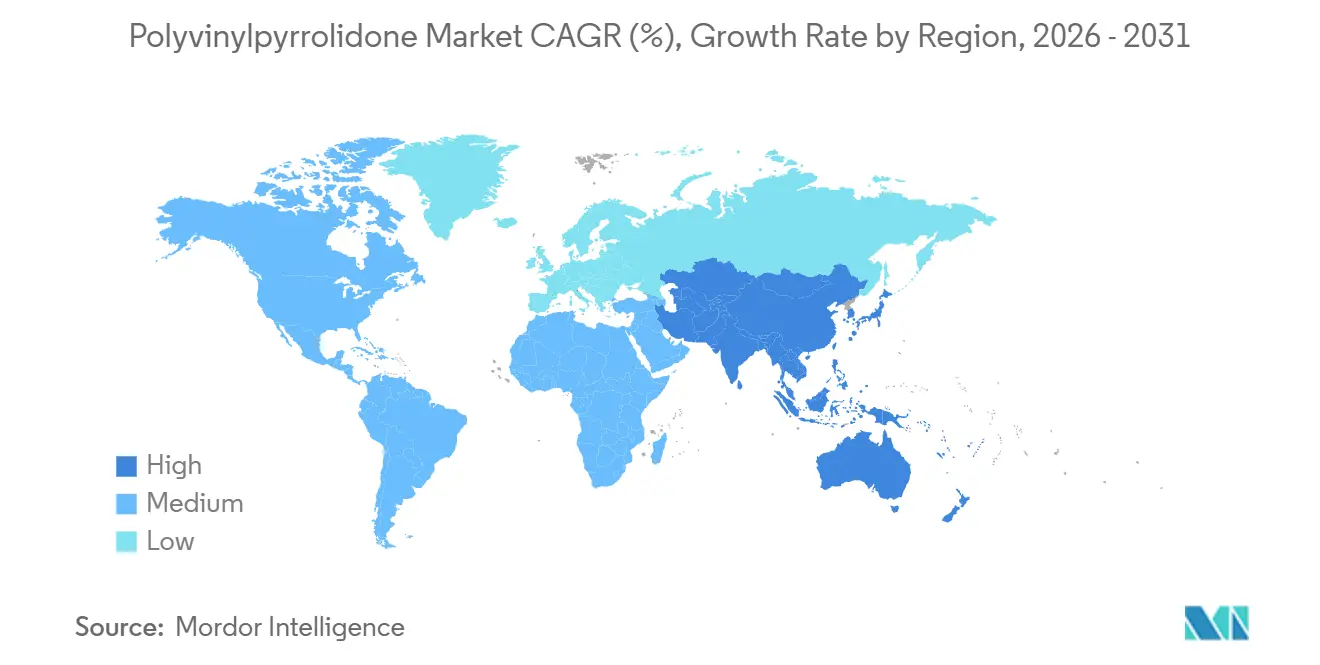
- By geography, Asia-Pacific accounted for 39.27% of the polyvinylpyrrolidone market size in 2025 and is progressing at an 11.45% CAGR to 2031.
Note: Market size and forecast figures in this report are generated using Mordor Intelligence’s proprietary estimation framework, updated with the latest available data and insights as of January 2026.
Market Trends and Insights
Drivers Impact Analysis of Polyvinylpyrrolidone Market*
| Driver | (~) % Impact on CAGR Forecast | Geographic Relevance | Impact Timeline |
|---|---|---|---|
| Escalating demand for high-purity excipients in solid-oral pharmaceuticals | +2.80% | Global, with concentration in Asia-Pacific (China, India) and North America | Medium term (2-4 years) |
| Rising consumption of hair-styling and personal-care formulations | +1.60% | North America, Europe, and urban Asia-Pacific markets (South Korea, Japan) | Short term (≤ 2 years) |
| Adoption of PVP binders in 3D-printed pharmaceuticals | +0.90% | North America and Europe, early-stage adoption in Japan | Long term (≥ 4 years) |
| Use of PVP dispersants in battery-recycling slurry processes | +0.40% | Asia-Pacific (China, South Korea) with spillover to Europe and North America | Long term (≥ 4 years) |
| Shift toward water-soluble, biodegradable adhesives in flexible electronics | +0.70% | Asia-Pacific core (South Korea, Japan, China), spillover to North America | Long term (≥ 4 years) |
| Source: Mordor Intelligence | |||
Escalating Demand for High-Purity Excipients in Solid-Oral Pharmaceuticals
Tablet manufacturers must now meet residual N-vinylpyrrolidone limits of ≤10 ppm, ≤400 ppm peroxides, and ≤500 ppm aldehydes, thresholds that force investment in vacuum stripping, peroxide quenching, and real-time spectroscopy. Asian contract development and manufacturing organizations (CDMOs) ramp output for global generics and routinely specify PVP batches with a K-value coefficient-of-variation below 3%, a standard unattainable without inline viscometry[1]. Compliance costs elevate delivered-price differentials between pharma- and industrial-grade material by up to 15%, yet also erect barriers to entry, bolstering returns for integrated suppliers. North American specialty-pharma firms widen adoption of K-90 and K-120 matrices to refresh product life cycles under the FDA’s quality-by-design ethos. Medium-term growth, therefore, hinges on API manufacturing expansions in India and China, along with western reformulation activity.
Rising Consumption of Hair-Styling and Personal-Care Formulations
Cosmetic chemists favor vinyl pyrrolidone/vinyl acetate and vinyl pyrrolidone/DMAPA copolymers to secure humidity-resistant hold without the rigid film associated with acrylates. BASF’s Luviskol and Luviset lines provide K-values from 12-90 that let formulators balance strength and wash-off characteristics. The European CosIng database lists PVP as unrestricted, yet clean-beauty retailers pressure brands to migrate toward water-based systems, accelerating demand in North America and Europe[2]. Urban Asia follows, propelled by K-pop-inspired styling regimens that value strong yet flexible hold. The effect should crest within two years as reformulation cycles close and inventories refresh.
Adoption of PVP Binders in 3D-Printed Pharmaceuticals
Additive-manufactured tablets require excipients that present narrow glass-transition windows and predictable melt rheology. PVP grades with K-values 25-90 deliver Tg 110-180°C and support fused-deposition modeling while forming amorphous dispersions that raise API bioavailability. FDA approval of Spritam in 2015 validated the regulatory path, yet commercial adoption remains gated by equipment costs and the absence of harmonized good-manufacturing-practice rules. University consortia continue material testing while Ashland and Aprecia target an NDA filing by late 2026. Uptake will materialize first in North America and Europe once process validation templates mature.
Shift Toward Water-Soluble, Biodegradable Adhesives in Flexible Electronics
Wearable sensors and foldable displays need adhesives that bond substrates without outgassing. PVP’s hydroxyl-rich backbone bonds well to metal oxides and decomposes harmlessly in physiological fluids within weeks, matching the lifecycle goals of transient electronics. Samsung Display and LG Display pilot PVP layers in foldable OLED stacks to mitigate delamination, and Japan’s METI funds research on PVP dielectrics for farm-use biosensors. Long-term CAGR uplift stems from South Korean, Japanese, and Chinese display capacity expansions and U.S. medical-device ventures that seek biodegradable implant adhesives.
Restraints Impact Analysis of Polyvinylpyrrolidone Market*
| Restraint | (~) % Impact on CAGR Forecast | Geographic Relevance | Impact Timeline |
|---|---|---|---|
| Volatility in N-vinylpyrrolidone monomer prices | -1.40% | Global, with acute exposure in regions dependent on acetylene feedstock (Asia-Pacific, Europe) | Short term (≤ 2 years) |
| Stringent pharmacopeial residual-monomer and peroxide limits | -0.90% | Global, particularly impacting pharmaceutical-grade producers in North America, Europe, and India | Medium term (2-4 years) |
| Dust-explosion compliance capex for ATEX-rated handling systems | -0.50% | Europe (ATEX Directive 2014/34/EU), with spillover to North America (NFPA 652 standards) | Medium term (2-4 years) |
| Environmental scrutiny over aquatic persistence of PVP | -0.60% | Europe and North America, with emerging regulatory attention in Japan and South Korea | Long term (≥ 4 years) |
| Source: Mordor Intelligence | |||
Volatility in N-Vinylpyrrolidone Monomer Prices
The Reppe process links NVP costs to acetylene, formaldehyde, and ammonia, and therefore to crude oil and electricity. Winter curtailments in Shanxi and Inner Mongolia pushed spot acetylene up 18-22% in 2025, lifting NVP offers globally. Europe felt parallel shocks as gas-price spikes after Nord Stream capacity loss added EUR 0.80-1.20 per kg to monomer costs, compressing pharma-grade margins by up to 10 points. Vertical integration shields BASF and Kuraray, but smaller converters ride the price roller coaster, weakening cash flows and deferring capex.
Stringent Pharmacopeial Residual-Monomer and Peroxide Limits
European Pharmacopoeia 11.0 halved the monomer limit to 10 ppm, compelling vacuum-stripping at sub-1 mbar and temperatures below 90°C to avoid polymer scission. Added stabilizers to quench peroxides, introducing trace metals that require ion-exchange clean-up, boosting variable costs by USD 0.40-0.60 per kg. Indian excipient makers supplying 35% of global generics saw operating margins slip 5-7% as they upgraded analytics capacity, driving consolidation toward scale players capable of high-performance liquid chromatography release tests.
*Our forecasts treat driver/restraint impacts as directional, not additive. The impact forecasts reflect baseline growth, mix effects, and variable interactions.
Polyvinylpyrrolidone Market Segment Analysis
By Form:
Powder Performance Bolsters Handling EfficiencyPowder grades led the polyvinylpyrrolidone market with a 74.26% volume stake in 2025 and are forecast to grow at 8.72% through 2031. Spray drying of K-30 yields spherical particles that flow easily into direct-compression presses, lowering cycle time and reducing dust-explosion risk under ATEX rules. Drum-dried K-90 and K-120 remain essential for controlled-release matrices but require extra handling steps that push cost per finished kilogram higher. Continuous-manufacturing adoption further favors free-flowing powders because gravimetric feeders operate more consistently at bulk densities between 0.3-0.5 g cm⁻³.
Liquid formulations serve injectables and aerosol hair sprays where a pre-dissolved polymer shortens make-ready time. Despite 30-40% higher freight cost per active kilogram, injectable producers value the absence of particulates and reduced microbiological risk during sterile filtration. Battery-recyclers piloting water-based hydrometallurgical flowsheets also prefer liquid binders for easier dispersion of cathode fines. Yet preservative content in liquid grades collides with clean-beauty label constraints, limiting broader cosmetics growth.
By Application:
Pharmaceuticals Accelerate on Generics and Controlled-Release NeedsPharmaceutical excipients commanded 40.28% of the overall 2025 volume and are projected to rise at 11.87%, the fastest application CAGR. The polyvinylpyrrolidone market size for pharmaceuticals is on track to hit 76.2 kilotons by 2031 as CDMOs in India and China scale output to supply biosimilars and high-potency oral solids. K-90 and K-120 grades, priced 25-30% above K-30, enable 8-12-hour release profiles that extend drug life cycles and justify premium pricing. Regulatory hurdles under ICH Q3C demand solvent limits that smaller entrants struggle to meet, further entrenching incumbent suppliers.
In food and beverage, PVPP’s unique polyphenol selectivity stabilizes beer and white wine without stripping aroma, and FDA 21 CFR 173.55 caps usage at 60 g hL⁻¹ for beer, ensuring safety compliance. Craft breweries in the United States deploy PVPP to clarify hazy IPAs while preserving hop oils, a style that grew 18% in 2025. In cosmetics, formulators replaced volatile organic solvents with PVP copolymers for humidity resistance; counterpressure from botanical gums will temper future growth. Industrial uses, including battery binders, are pacing ahead as European gigafactories trial water-based slurries to meet ESG targets.

Geography Analysis
APAC Polyvinylpyrrolidone Market
Asia-Pacific controlled 39.27% of the 2025 demand and is forecast to climb at 11.45%. China supplies 45% of global generic APIs, and provincial subsidies for excipient parks lower land and utility costs by up to 40%, deepening regional competitive advantage. India commissioned 25 new tablet-compression lines between 2024-2025 and remains the fastest-growing importer of pharmaceutical-grade PVP. South Korea’s and Japan’s display industries divert incremental tonnage to foldable OLED adhesive, while ASEAN contract manufacturers expand cosmetic exports that embed PVP copolymers for North American brands.
North America and LATAM Polyvinylpyrrolidone Market
In North America, FDA draft guidance on continuous manufacturing encourages direct-compression formulations that rely on spray-dried PVP, benefiting BASF’s Geismar and Ashland’s Wilmington plants. Canada’s cannabis edibles segment uses PVP to bind compressed tablets for dose uniformity under Health Canada rules. Mexico’s generics growth surpasses USD 2.1 billion in exports and draws on PVP-bound tablets to satisfy bioequivalence tests across Latin America.
Europe Polyvinylpyrrolidone Market
In Europe, REACH registration above 1,000 t/y costs more than EUR 500,000, favoring established suppliers. Germany anchors pharmaceutical-grade demand, yet tablet production migrates eastward for cost reasons. Post-Brexit U.K. labeling divergence adds GBP 15,000-25,000 per excipient SKU, complicating supply chains. Nordic innovators boost demand for PVP in solid shampoo bars and powder cleansers that save water.
South America and MEA Polyvinylpyrrolidone Market
Brazil’s generic sector imports PVP from Indian suppliers to meet Anvisa bioequivalence criteria, while Saudi Arabia approved 12 new tablet lines that specify PVP K-30 under Vision 2030 diversification. South Africa leads African hair-care adoption of PVP copolymers for relaxers, and local pharmacies in Nigeria experiment with powder PVP for extemporaneous capsules despite electricity constraints.
Regulatory Landscape
Regulatory requirements for PVP and PVPP vary by end use, with the tightest controls in pharmaceutical excipients. Suppliers are expected to align to pharmacopeial specifications (USP/NF, Ph. Eur., and ChP) and provide auditable quality documentation to support drug filings across the FDA, EMA, and China NMPA.
In Europe, explosive-atmosphere compliance shapes powder handling and packaging investments under the ATEX Directive 2014/34/EU, affecting plant layout, dust collection, and certified equipment selection for spray-dried grades. In food and beverage, regulatory anchors include EU authorization of PVP (E 1201) and PVPP (E 1202) under the EU food additive framework (including Commission Regulation (EU) No 231/2012 and Regulation (EC) No 1333/2008) and the United States use conditions for PVPP in beer processing under FDA 21 CFR 173.55 (with defined use limits). China also tightened compliance expectations around food-contact testing methods, with new GB 31604 testing method standards taking effect on September 16, 2025, increasing the need for localized test reports and documentation for suppliers serving packaging and beverage-processing value chains. For cosmetics, the October 2024 Cosmetic Ingredient Review (CIR) Expert Panel conclusion that multiple vinylpyrrolidone polymers are safe as used supports broader formulation continuity as brands intensify scrutiny of persistence-related narratives.
Value Chain Analysis
The PVP value chain begins upstream with petrochemical and acetylene-linked intermediates feeding N-vinylpyrrolidone (NVP) monomer production, followed by polymerization to PVP and conversion into application-specific grades (including K-value variants and crosslinked PVPP). Integrated producers with stronger control over monomer sourcing and purification capabilities typically have an edge in managing cost swings and meeting low-impurity requirements, while non-integrated converters remain more exposed to NVP volatility and qualification hurdles in regulated end markets.
Midstream, pharmaceutical-grade PVP is shaped by quality-system demands. Customer qualification commonly spans 12 to 24 months and can include facility audits, analytical method validation, and stability packages, with any site or process change potentially triggering re-qualification. Downstream distribution typically relies on regional hubs and specialist distributors that support documentation, lot traceability, and the local regulatory interface for pharma, food, and cosmetics customers. EXCiPACT GMP/GDP certification, as achieved for BASF SE at Ludwigshafen in 2024, works as a practical gatekeeper for excipient supply into regulated formulations, while partnerships with regional distributors help suppliers improve access and service levels where customers need rapid technical responses and compliant dossiers.
Competitive Landscape
The Polyvinylpyrrolidone market is moderately consolidated. Entry barriers stem from the USD 15 million-plus price tag of monomer purification lines and the need for GMP-audited analytics. BASF invests heavily, adding 3,000 t/y at Ludwigshafen for pharmaceutical-grade K-90 and K-120 completion by 2027. Ashland partners with Aprecia to co-develop PVP filaments for 3D-printed tablets, illustrating the pivot toward high-margin applications. Technology trends bifurcate: Western incumbents pilot continuous K-value monitoring and supply-chain transparency under 2024 IPEC guidance, whereas Chinese firms accelerate nameplate capacity to chase volume in cosmetics and industrial grades.
Polyvinylpyrrolidone Industry Leaders
-
Ashland
-
BASF
-
Boai NKY Pharmaceutical Co., Ltd.
-
Nippon Shokubai Co., Ltd.
-
KURARAY CO., LTD.
- *Disclaimer: Major Players sorted in no particular order
Polyvinylpyrrolidone Market Companies Covered in this Report
- Ashland
- BASF
- Boai NKY Pharmaceutical Co., Ltd.
- Glide Chem Private Limited
- JH Nanhang Life Sciences Co., Ltd.
- KURARAY CO., LTD.
- Merck KGaA
- Nippon Shokubai Co., Ltd.
- Shanghai Yuking Water Soluble Material Tech Co. Ltd.
- Star-Tech & JRS Specialty Products Co. Ltd.
- Thermo Fisher Scientific Inc.
- Zhangzhou Huafu Chemical Co. Ltd.
Market Opportunities and Future Outlook
Near-term whitespace is concentrated in higher-purity, tightly controlled PVP grades for solid oral dose manufacturing and continuous processing, where customers focus on narrow K-value variability, low residuals, and robust traceability. The tightening impurity thresholds referenced in the report context (for residual monomer and oxidative byproducts) and the expanding use of spray-dried powders in direct compression create room for suppliers that can invest in advanced purification, in-line monitoring, and excipient-grade documentation capacity (DMFs/CEPs and audit readiness), rather than competing primarily in commodity-grade volume.
On the demand side, personal care reformulation and new-use cases in advanced manufacturing point to two opportunity lanes. First are silicone-free and water-based styling and care systems that continue to use water-soluble PVP copolymers. Second is substitution pressure where brands test non-PVP alternatives. A concrete signal of substitution-led innovation is BASF introducing Verdessence Maize in April 2025 as a biodegradable hair-styling polymer positioned against synthetic PVP and VP/VA copolymers, which shifts buyer conversations toward bio-based performance polymers and sustainability-linked reformulation pathways. Pricing and supply reliability also remain active commercial levers, reflected in BASF Pharma Solutions announcing in March 2026 a global price increase of up to 20% for excipients and selected APIs, strengthening the case for suppliers that can demonstrate continuity of supply, energy-cost resilience, and differentiated quality in regulated applications.
Recent Industry Developments in Polyvinylpyrrolidone Market
- January 2026: Ashland and Univar Solutions commenced an exclusive distribution agreement covering cellulose ether derivatives and PVPP for food and beverage customers across EMEA. The deal strengthens regional reach and technical service for processing aids and excipient-adjacent grades, supporting customers as they consolidate sourcing while meeting local documentation needs.
- April 2025: BASF launched Verdessence Maize, a biodegradable hair-styling polymer marketed as an alternative to synthetic PVP and VP/VA copolymers. The launch intensifies competitive pressure in personal care by shifting buyer conversations toward bio-based performance polymers and sustainability-linked reformulation pathways.
- May 2024: BASF SE reported that its Ludwigshafen site received EXCiPACT GMP and GDP certification for the production and testing of polyvinylpyrrolidones. The certification strengthens the site’s position in regulated excipient supply and supports customer qualification and audit requirements in pharmaceutical value chains.
Polyvinylpyrrolidone Market Report Scope and Research Methodology
Market Definition and Coverage
For this study, the polyvinylpyrrolidone (PVP) market covers global demand and supply of PVP sold in commercial forms, and it is sized as market volume consumed across major end-use industries.
Scope exclusions: We exclude upstream pyrrolidone monomer values and captive, non-commercial internal transfers that are not priced and traded as PVP.
Segments Covered in This Report
- By Form
- Powder
- Liquid
- By Application
- Pharmaceutical
- Food and Beverage
- Cosmetics
- Adhesives
- Other Applications (Industrial, etc.)
- By Geography
- Asia-Pacific
- China
- India
- Japan
- South Korea
- ASEAN Countries
- Rest of Asia-Pacific
- North America
- United States
- Canada
- Mexico
- Europe
- Germany
- United Kingdom
- France
- Italy
- Spain
- NORDIC Countries
- Rest of Europe
- South America
- Brazil
- Argentina
- Rest of South America
- Middle East and Africa
- Saudi Arabia
- United Arab Emirates
- Qatar
- South Africa
- Nigeria
- Rest of Middle East and Africa
- Asia-Pacific
Data Sources, Market Sizing, and Validation
Desk Research
To set the starting structure, we review public information that helps explain where PVP is produced, where it is consumed, and what drives volume swings by application. Common references include trade and tariff statistics from UN Comtrade, manufacturing and industrial output indicators from sources such as the World Bank and OECD, and published health and drug-use statistics from the World Health Organization.
We also use standards and safety references from sources such as the US FDA, the European Medicines Agency, and the European Chemicals Agency to confirm typical use conditions and quality requirements that influence adoption. Company filings, investor presentations, technical datasheets, and reputable press are used to track capacity changes, plant utilization commentary, and product mix. Where needed for cross-checks, our team also uses paid subscriptions for company financials and intelligence, patent databases, and shipment-level import and export tracking. This list is illustrative, and many other sources were reviewed to collect data points and resolve unclear items.
Primary Interviews and Surveys
Primary work is used to translate broad indicators into realistic assumptions for the PVP volume model. We speak with a mix of manufacturers, distributors, and downstream users in pharmaceuticals, personal care, food, and industrial adhesives to validate demand pools, typical substitution behavior, and the pace of grade shifts. Coverage is kept global so regional supply tightness, import dependence, and pricing pass-through can be checked with local context.
Distribution of primary research fieldwork respondents
| Company type | Respondent position | Region |
|---|---|---|
| Top tier: 26% | CXOs: 17% | APAC: 46% |
| Mid tier: 54% | Functional/Unit leaders: 36% | EMEA: 33% |
| Smaller Players: 20% | Managers: 47% | Americas: 21% |
Market-Sizing & Forecasting
The core sizing is built using a top-down approach where production, trade flows, and end-use activity indicators are stitched into a single demand pool, and then converted into PVP consumption volume by application. To keep the output grounded, the totals are corroborated through selective bottom-up approximations, such as sampling supplier shipment discussions, channel checks with distributors, and volume consistency checks using typical dosage or formulation usage ranges.
Inputs are kept practical and market-specific, including pharmaceutical formulation intensity (solid dosage and excipient use), personal care and cosmetics output trends, adhesive and binder demand proxies in key industrial chains, and regional import reliance visible in customs patterns. We also track operating rate and capacity change signals, since debottlenecking and new capacity can change apparent supply quickly, which then affects realized consumption.
For forecasting, scenario analysis is used, with demand growth linked to a few clearly observed drivers that interviewees can agree on, such as pharma manufacturing expansion, consumer goods output trends, and regulation-driven grade requirements. Where direct data is missing for smaller countries, we estimate gaps by mapping consumption to comparable markets using manufacturing output and trade intensity, and then re-check the implied per-capita and per-industry usage levels so the numbers stay realistic.
Data Validation & Update Cycle
We validate the model in several passes so outliers are caught before results are finalized. Volume outputs are checked against independent signals like regional trade balances, plant announcements, and visible demand shifts in major end-use categories, and any large variance triggers a re-check of assumptions and units.
Before sign-off, the work is reviewed by another analyst, followed by a final consistency pass that checks growth rates, regional shares, and application splits for logical continuity across years. Reports are refreshed annually, and interim updates are done when there is a material event such as a capacity addition, a supply disruption, or a sharp currency move that can distort year-on-year comparisons. Right before delivery, we run a last update sweep so clients receive the most current view supported by traceable inputs.
Mordor Intelligence's Polyvinylpyrrolidone Market Size Compared With Other Published Estimates
Published market sizes for polyvinylpyrrolidone often do not match because sources use different units, different base years, and different ways of treating price changes versus real volume changes. Some reports also broaden the scope into adjacent chemistries or count internal transfers, which can inflate totals without being obvious to a reader.
Key gap drivers are usually tied to refresh timing and currency handling, since a model updated after major raw material moves will show a different implied ASP path than a model that holds earlier pricing. Another common difference is whether the estimate is built as revenue or volume, and whether average selling prices are normalized across regions and grades or applied as a single blended number. The table spread largely comes from these choices, where currency timing and ASP checks are refreshed close to publication and then validated through end-use reality checks in the approach used by Mordor Intelligence.
Benchmark comparison
| Source | Market Size | Gaps in Research Methodology |
|---|---|---|
| Mordor Intelligence | USD 101.85 B (2026) | |
| Global Consultancy A | USD 3.08 B (2025) | Reported as revenue, not volume, so it depends heavily on the assumed ASP curve by grade and region. The base year is earlier and the price path can shift materially if the refresh is not aligned to the latest feedstock and FX movements. |
| Industry Publisher B | USD 2.93 B (2025) | Uses a revenue base year and applies a blended pricing assumption that can understate premium pharma grades in higher priced regions. The timeframe and currency conversion points differ, which can change the 2025 starting value even if underlying demand is similar. |
Taken together, the comparison shows that unit choice and price handling explain most of the gap, even before geography and grade boundaries are debated. By keeping the steps clear, and by cross-checking the implied totals against trade signals, capacity changes, and end-use pull, we can maintain a balanced market view that is easier to repeat and update over time.
Key Questions Answered in the Report
How large will global PVP demand be by 2031?
Forecasts indicate consumption will reach 150.84 kilotons by 2031, reflecting an 8.17% CAGR from 2026.
Which segment adds the most incremental volume?
Pharmaceuticals will supply the largest absolute increase, expanding at 11.87% per year as generics and controlled-release formats multiply.
Why are powder grades preferred in tablet manufacturing?
Spray-dried powder flows consistently into direct-compression presses, lowers dust-explosion risk, and aligns with continuous-manufacturing protocols.
What is driving Asia-Pacific’s leadership?
China’s integrated monomer plants, India’s expanding CDMOs, and South Korea and Japan’s flexible-display investments propel regional demand growth above 11%.
How will 3D-printed drugs affect PVP suppliers?
Binder volumes are small today, but FDA-cleared pathways and ongoing partnership activity suggest a niche high-margin outlet that could gain momentum after 2026.