
Market Overview
| Study Period | 2020 - 2031 |
|---|---|
| Market Size (2026) | USD 2.12 Billion |
| Market Size (2031) | USD 3.03 Billion |
| Growth Rate (2026 - 2031) | 7.43 % |
| Fastest Growing Market | South America |
| Largest Market | Asia Pacific |
| Market Concentration | Medium |
Major Players *Disclaimer: Major Players sorted in no particular order Image © Mordor Intelligence. Reuse requires attribution under CC BY 4.0. | |
Polyurethane (PU) Hot-melt Adhesive Market Analysis by Mordor Intelligence
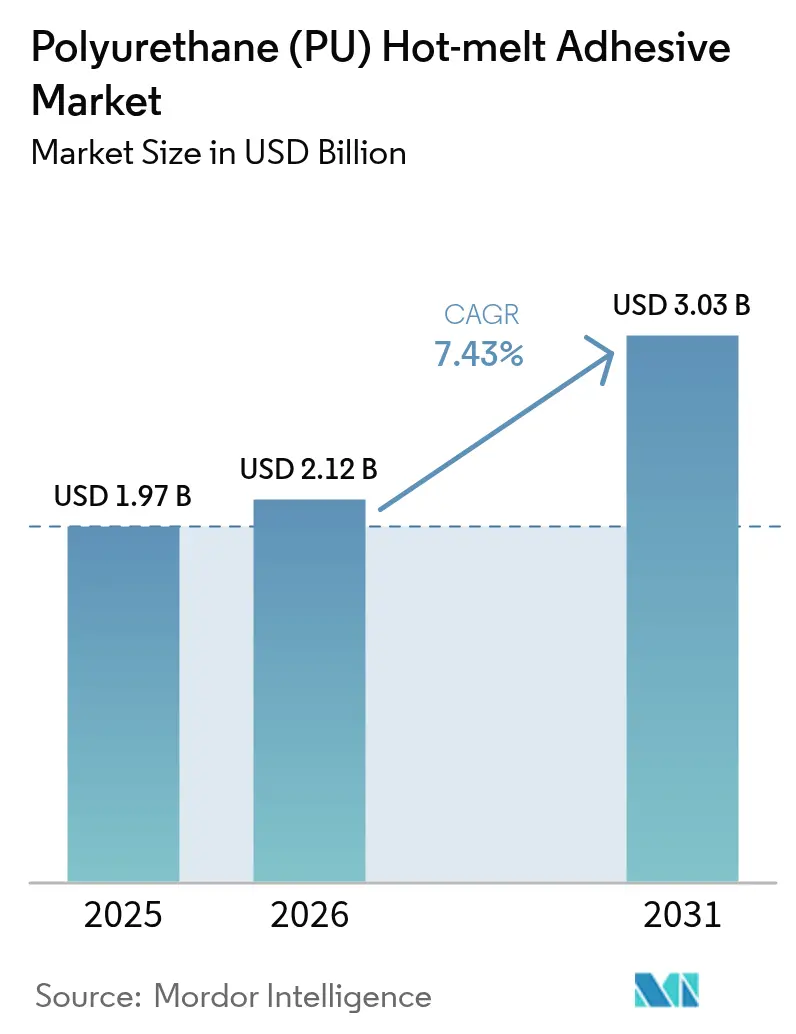
Polyurethane Hot-melt Adhesive Market size in 2026 is estimated at USD 2.12 billion, growing from 2025 value of USD 1.97 billion with 2031 projections showing USD 3.03 billion, growing at 7.43% CAGR over 2026-2031. Accelerating automation across e-commerce fulfillment centers, the miniaturization of consumer and medical electronics, and stringent limits on volatile organic compound emissions are reshaping adhesive selection and consistently steering demand toward moisture-curing reactive systems. Suppliers that can guarantee predictable rheology for robotics, low-temperature dispensing to protect heat-sensitive parts, and micro-emission formulations compliant with evolving occupational health laws are best positioned to capture share in the polyurethane hot melt adhesives market. Capacity additions for diphenyl-methane di-isocyanate (MDI) in the United States and Thailand signal upstream efforts to stabilize raw-material availability, yet the continued price swings for MDI and toluene di-isocyanate (TDI) keep formulators focused on diversification and bio-based polyol innovation. Regional momentum remains tilted toward Asia-Pacific, which accounts for nearly one-half of global volume, though South America now delivers the fastest expansion thanks to Brazilian infrastructure programs that prefer durable, heat-resistant bonding agents.
Key Report Takeaways
- By type, reactive polyurethane hot melts held 62.12% of the Polyurethane Hot Melt Adhesives market share in 2025, while non-reactive grades are projected to register the top CAGR of 7.89% through 2031.
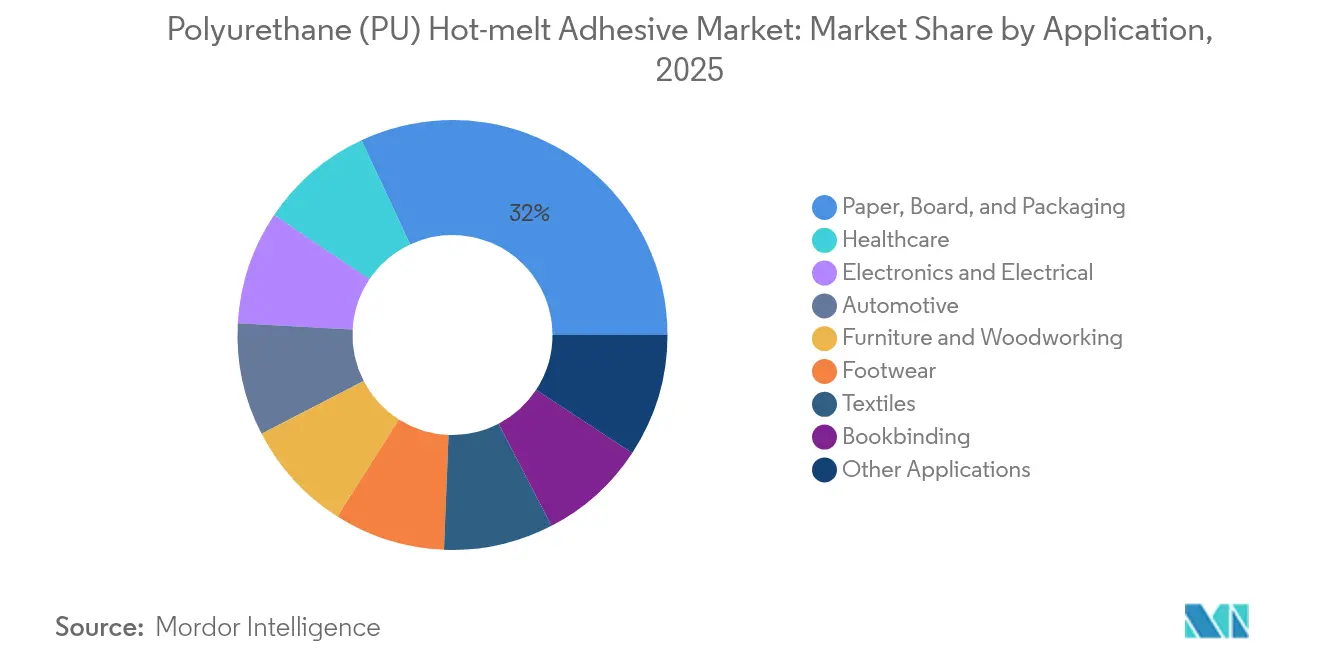
- By application, paper, board, and packaging led with 31.96% revenue share of the Polyurethane Hot Melt Adhesives market size in 2025, whereas healthcare is poised to log an 8.08% CAGR to 2031.
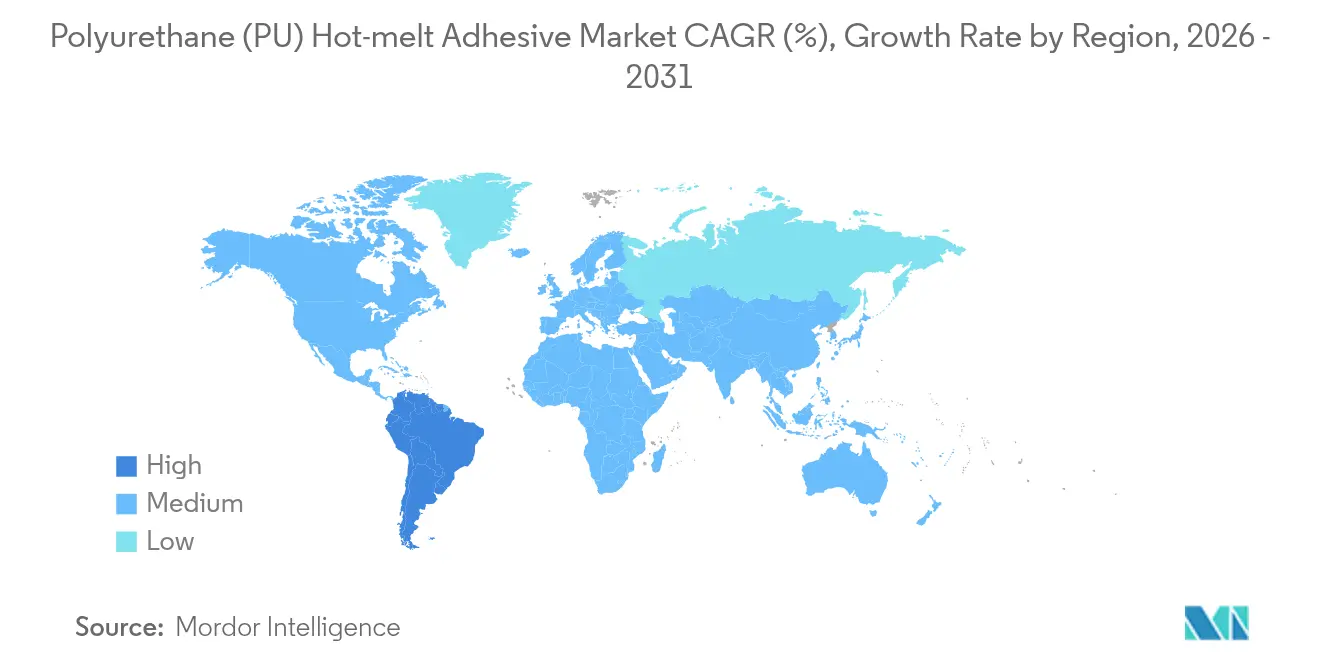
- By region, Asia-Pacific commanded 45.78% of the Polyurethane Hot Melt Adhesives market in 2025; South America is slated to post the quickest regional CAGR at 7.67% over the forecast horizon.
Note: Market size and forecast figures in this report are generated using Mordor Intelligence’s proprietary estimation framework, updated with the latest available data and insights as of 2026.
Global Polyurethane (PU) Hot-melt Adhesive Market Trends and Insights
Drivers Impact Analysis*
| Driver | (~) % Impact on CAGR Forecast | Geographic Relevance | Impact Timeline |
|---|---|---|---|
| E-commerce automation boosting case-sealing demand | +2.0% | Global, strongest in Asia-Pacific and North America | Medium term (2–4 years) |
| Electronics miniaturization requires low-temperature PUR HMAs | +1.2% | Asia-Pacific core, spillover to North America and Europe | Long term (≥ 4 years) |
| VOC-driven shift away from solvent-borne adhesives | +0.8% | Europe and North America, expanding to Asia-Pacific | Medium term (2–4 years) |
| Automotive lightweighting and modular interiors | +0.6% | Global, emphasis in Europe and North America | Long term (≥ 4 years) |
| Bio-based polyols win sustainability labels | +0.4% | Europe in front, North America following | Long term (≥ 4 years) |
| Source: Mordor Intelligence | |||
E-commerce Automation Boosting Case-Sealing Demand
Automated fulfillment centers operate around the clock and require adhesives that develop instant green strength so cartons can be moved downstream within seconds without causing line stoppages or tape rework. Reactive polyurethane hot melts outperform ethylene-vinyl acetate (EVA) grades by retaining cohesive strength across a wider temperature envelope, enabling consistent seals even in unconditioned distribution hubs[1]. Uniform viscosity also facilitates melt-on-demand dispensing equipment, which eliminates tank charring and reduces downtime for cleaning, a top metric tracked by integrators of high-speed case packers. Nordson has reported double-digit order growth for its plug-and-play melter series as logistics operators retrofit legacy lines to handle SKU proliferation while keeping labor inputs flat. Because many parcels now encounter conveyor acceleration, automated singulation, and robotic sortation, adhesives must withstand repetitive dynamic loads that can easily peel traditional hot melts. Therefore, the polyurethane hot melt adhesives market benefits each time an e-commerce warehouse adds new sort lanes or adopts IoT-enabled quality monitoring that flags even minor seal failures.
Electronics Miniaturization Requires Low-Temperature PUR HMAs
Handset makers, wearables specialists, and automotive Tier 1 suppliers increasingly design assemblies with sub-millimeter gaps that cannot tolerate the 160 °C-plus application temperatures associated with legacy hot melts. Newly formulated polyurethane grades flow at 100–120 °C, avoiding solder fatigue on fine-pitch ball-grid arrays while still crosslinking to provide permanence through thermal cycling. Foldable displays and flexible printed circuits generate shear and peel stresses during repeated bends, and polyurethane’s elongation at break satisfies that fatigue requirement better than epoxy or acrylic solutions. Device cabins that house 5G antennas must also meet electromagnetic compatibility tests; specialty PUR HMAs (Polyurethane Hot Melt Adhesives) now incorporate plate-like conductive fillers that create local shielding without adding weight. In medical electronics, sterilization via gamma irradiation or autoclave cycles makes polyurethane attractive because it resists hydrolytic degradation and retains bond line integrity. With edge-computing modules proliferating in every product category, the polyurethane hot melt adhesives market finds fresh outlets wherever small form factors and heat management converge.
VOC-Driven Shift Away from Solvent-Borne Adhesives
Canada’s 2024 regulations cap VOC content for adhesives at 30 g/L, a level practically unattainable for most solvent-based chemistries[2]. European REACH rules added curbs on photoinitiators and labeled di-isocyanates, prompting manufacturers to accelerate programs that ready micro-emission polyurethane grades delivering ≤ 0.1% free isocyanate. Automotive trim plants appreciate the switch because training and medical surveillance costs fall once operators no longer handle toluene-rich or xylene-rich products. Furniture OEMs (original equipment manufacturers) that produce for indoor-air-quality-certified catalogs likewise demand HMAs that minimize aldehyde off-gassing. Sustainable packaging projects lift the polyurethane hot melt adhesives market again as brand owners move toward mono-material laminates that necessitate solvent-free bonding so the finished article can re-enter recycling streams without deinking.
Automotive Lightweighting and Modular Interiors
Global automakers push adhesive bonding to replace welds and mechanical clips whenever material combinations span aluminum, high-strength steel, and carbon-fiber composites. Reactive polyurethane hot melts exhibit tensile properties that absorb vibration better than rigid structural epoxies, easing qualification for tough dynamic crash simulations. Interior trim modules, such as instrument panels with integrated ambient lighting and sensor arrays, rely on PUR bonding to reconcile differing coefficients of thermal expansion among substrates. For electric vehicles, battery pack producers employ low-viscosity PUR HMAs to secure cooling channels and gasket frames because the cured adhesive dampens resonant frequencies that shorten cell life. Such diverse adoption channels intensify the pull on the polyurethane hot melt adhesives market across design studios in Detroit, Wolfsburg, Shanghai, and Seoul.
Restraints Impact Analysis*
| Restraint | (~) % Impact on CAGR Forecast | Geographic Relevance | Impact Timeline |
|---|---|---|---|
| MDI/TDI price volatility squeezes margins | -1.80% | Global, with Asia-Pacific most affected | Short term (≤ 2 years) |
| Stricter free-isocyanate exposure regulations | -0.90% | Europe and North America leading, APAC following | Medium term (2-4 years) |
| Scarcity of specialty low-viscosity reactive tackifiers | -0.50% | Global, with North America and Europe most impacted | Medium term (2-4 years) |
| Source: Mordor Intelligence | |||
MDI/TDI Price Volatility Squeezes Margins
Prices for MDI swung 45% between 2023 and 2025 as outages in the United States and trade actions in China disrupted flows and pushed buyers into the spot market. Smaller adhesive converters without long-term contracts struggle to pass through such spikes to packaging or woodworking customers bound by annual price lists. Dow’s USD 500 million expansion in Texas came online in late 2024, yet logistical constraints and commissioning ramp-ups mean relief will phase in gradually. Currency fluctuations against the US dollar further eroded purchasing power for Brazil and India formulators, denominated in local contracts. The net effect trims gross margins and can delay capex for new blending lines, temporarily muting growth trajectories in the polyurethane hot melt adhesives market.
Stricter Free-Isocyanate Exposure Regulations
Since August 2023, European importers and downstream users of products containing more than 0.1% monomeric di-isocyanate must ensure worker training and certification every five years under REACH Annex XVII provisions. The administrative burden dissuades some end-users—particularly small furniture shops—from selecting standard PUR HMAs, nudging them toward non-isocyanate hybrids despite higher per-kilogram prices. North American regulators are considering similar thresholds, and an Occupational Safety and Health Administration rulemaking docket is expected by 2026. Medical device manufacturers face the additional requirement of revalidating biocompatibility whenever they reformulate adhesives, which can extend commercialization timelines by up to 18 months. Compliance complexity, therefore, suppresses uptake where product stewardship resources are scarce, tempering upside for the polyurethane hot melt adhesives market.
*Our forecasts treat driver/restraint impacts as directional, not additive. The impact forecasts reflect baseline growth, mix effects, and variable interactions.
Segment Analysis
By Type: Reactive Systems Sustain Dominance through Crosslinking Strength
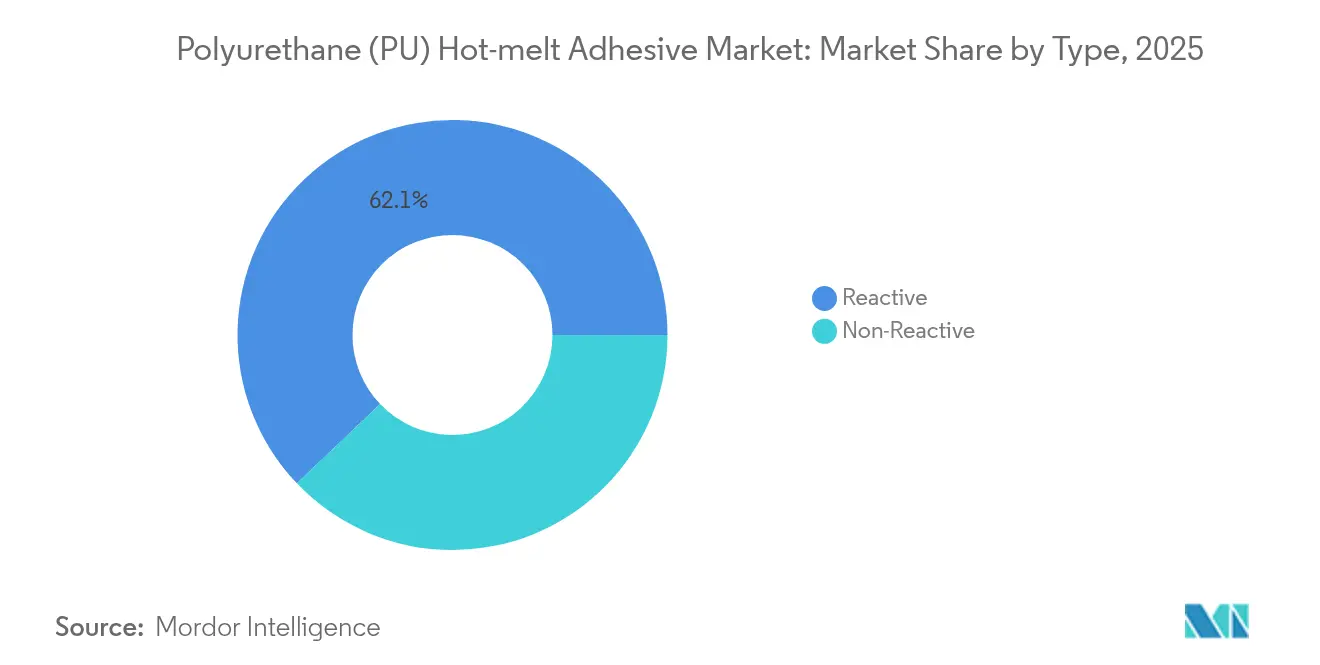
In 2025, reactive grades commanded 62.12% of worldwide value, a leadership position they will maintain because their moisture-induced crosslinking locks in heat, moisture, and chemical resistance unattainable with thermoplastic analogs. Market-leading suppliers now add silane scavengers that curb free-isocyanate release during dispensing, satisfying new European workplace thresholds without eroding performance. Non-reactive variants are forecast to record a 7.89% CAGR, illustrating that repositionability and recyclability also matter in sectors such as corrugated-case sealing or textile lamination, where permanent bonds are not mandatory.
Across both categories, investments in hybrid chemistries blur lines between instant tack and deferred cure. Henkel markets micro-emission reactive PUR HMAs that keep monomeric di-isocyanate below 0.1% yet achieve tensile shear greater than 10 MPa after 24 hours. Concurrently, formulators develop thermoplastic PUR blends with rapid crystallization that permit near-line-speed handling before complete moisture cure. Such innovation dynamics assure that the polyurethane hot melt adhesives market will continue funneling R&D into both performance extremes.

By Application: Packaging Supplies Scale; Healthcare Generates Momentum
Packaging accounted for 31.96% of 2025 revenue thanks to carton-closing lines in grocery e-commerce and frozen-food logistics that need rapid set speeds while resisting freezer condensation. Automated case erecting machinery often exceeds 400 units per minute, and reactive PUR HMAs keep seal integrity even when corrugated board carries high moisture from chilled storage. At the other end of the growth spectrum, healthcare bonding posts an 8.08% CAGR as catheter assemblies, transdermal patches, and bio-sensor housings adopt low-temperature PUR grades that pass ISO-10993 cytotoxicity tests.
Electronics remains another robust contributor, with handset ODMs (Original Design Manufacturers) using PUR to bond OLED (Organic Light Emitting Diode) displays and speaker modules where shock absorption is essential. Automotive applications cluster around interior trim, pillar garnishes, and acoustic insulation, each benefitting from polyurethane’s flexibility over –40 °C to 120 °C. Footwear and textile laminations rely on PUR webs to marry mesh, leather, and foam without stiffening the final assembly; here, non-reactive systems see heightened demand as brands set recyclability targets. Together, these diverse outlets cement the long-term health of the polyurethane hot melt adhesives market.
Geography Analysis
Asia-Pacific generated 45.78% of global turnover in 2025 as China’s handheld device exports and India’s auto assembly lines pulled tanker volumes of reactive PUR prepolymers. Japan’s mature medical-device ecosystem commands premium pricing for low-viscosity, ultra-pure grades that flow into micro-catheters and imaging probes. South Korea’s memory-chip fabs lean on low-stringing PUR HMAs for under-fill and lid-attach processes, bolstering consumption even during cyclical downturns.
North America maintains a large installed base of hot-melt equipment in corrugated packaging and furniture manufacturing. The region’s tight VOC regulations favor micro-emission PUR sticks that achieve LEED (Leadership in Energy and Environmental Design) indoor-air benchmarks, helping the polyurethane hot melt adhesives market defend share against hybrid hot melts. Mexico’s near-shoring wave encourages consumer-electronics suppliers to replicate Asian production lines, requiring the same low-application-temperature PUR formulas.
Europe differentiates itself through sustainability leadership. Adhesive buyers often request full cradle-to-gate carbon footprints, prompting PUR suppliers to certify bio-based content through independent labs. Automotive clusters in Germany and Spain specify adhesives compatible with polypropylene interior substrates to facilitate single-material recycling. South America exhibits the fastest regional CAGR at 7.67% because Brazilian construction and packaged-food plants are skipping solvent systems altogether and leaping straight to PUR to meet export-market safety codes. Even with macroeconomic volatility, these dynamics guarantee that the polyurethane hot melt adhesives market remains geographically diversified and opportunity-rich.
Regulatory Landscape
Polyurethane (PU) hot-melt adhesives operate under increasingly stringent chemical safety and emissions regimes, with the tightest compliance pull coming from diisocyanate and VOC controls. In the European Union, REACH (EC) No 1907/2006 Annex XVII restrictions on diisocyanates remain a key gatekeeper: since August 2023, products containing more than 0.1% monomeric diisocyanate require specific labeling and mandatory training for professional users. That requirement is pushing suppliers toward low-monomer, micro-emission reactive PUR systems.
In North America, chemical notification and use controls under the US EPA TSCA framework add compliance complexity for adhesive raw materials and new formulations. In May 2026, EPA issued Significant New Use Rules (SNURs) for certain chemical substances subject to prior premanufacture notice orders. This reinforces the need for manufacturers and importers to actively manage chemical inventories, downstream use conditions, and reporting obligations to keep industrial adhesive applications moving.
Value Chain Analysis
The value chain starts with upstream petrochemical and polyurethane intermediates, notably MDI and polyols (polyether/polyester and emerging bio-based polyols), along with catalysts and performance additives that tune open time, viscosity, and cure behavior. Integrated producers such as BASF supply isocyanates and polyols, while downstream formulators and brand owners (including Henkel, Sika, Jowat, and H.B. Fuller) convert these inputs into reactive and non-reactive PU hot-melt products through controlled prepolymer reaction, compounding, and packaging steps designed to protect moisture-sensitive materials.
Midstream manufacturing and application support are tightly coupled because reactive PUR HMAs must be dispensed with controlled temperature and moisture exposure, and shipped in sealed formats (cartridges, drums, and pails) to limit premature curing. Downstream, distributors and direct-to-OEM channels serve high-throughput packaging lines, electronics assembly, automotive interiors, and furniture/woodworking, where process reliability and scrap reduction are major buying criteria. Henkel highlighted this linkage in April 2026 with a Technomelt PUR grade positioned for appliance assembly and in-process debonding during rework. Logistics volatility and route disruptions also raise the premium on multi-regional sourcing of isocyanates and polyols, and on local blending capacity, particularly for shipments moving between Asia and Europe.
Competitive Landscape
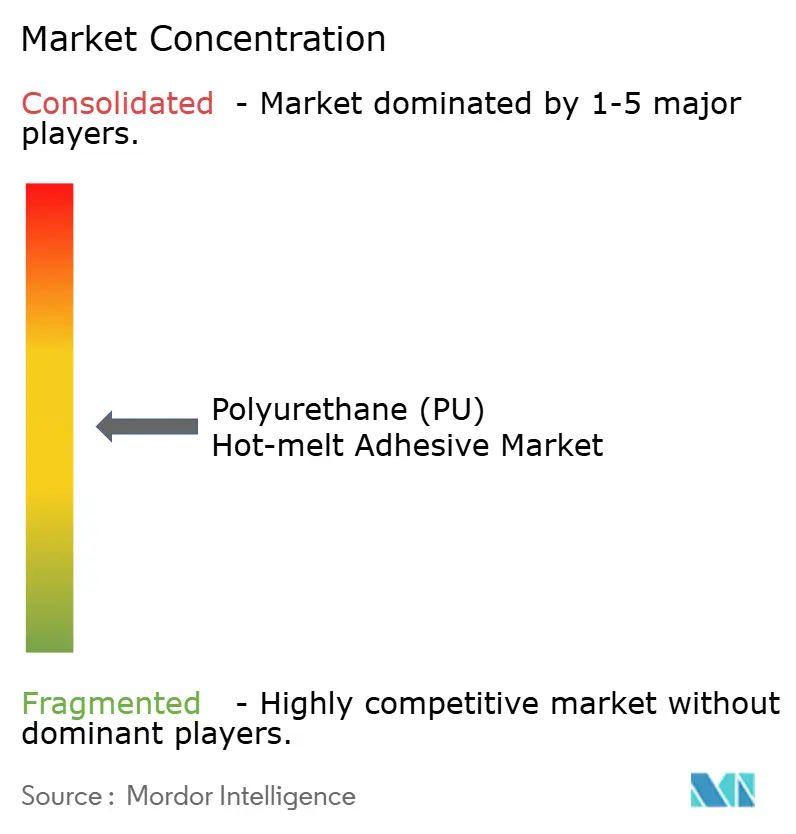
The Polyurethane Hot Melt Adhesives Market is moderately consolidated. Each pursues a two-pronged strategy: develop sustainable chemistries while adding regional production hubs that shorten lead times and hedge exchange-rate swings. H.B. Fuller opened a 13,000-ton PUR line in Shandong via its ADINO joint venture, bolstering supply security for Chinese smart-device plants. Henkel continues spotlighting its Technomelt Micro Emission series as a direct answer to REACH Annex XVII. Sika expanded Latin American blending capacity in late 2024 to capture civil-engineering adhesive demand tied to public-works upgrades. Capacity build-outs by Dow and BASF at the raw-material level underpin confidence in forward demand even as feedstock volatility complicates near-term pricing. All told, competitive maneuvering reiterates that innovation and regulatory fluency dictate long-run share capture within the polyurethane hot melt adhesives market.
Polyurethane (PU) Hot-melt Adhesive Industry Leaders
-
3M
-
Arkema
-
Henkel AG & Co. KGaA
-
H.B. Fuller Company
-
Jowat SE
- *Disclaimer: Major Players sorted in no particular order
Market Opportunities and Future Outlook
An opportunity sits at the intersection of regulation-driven stewardship and manufacturing productivity: reactive PUR hot melts formulated at or below the 0.1% monomeric diisocyanate threshold address REACH-related training and labeling burdens while maintaining performance across packaging, furniture, and durable goods. This linkage is reinforced by named product activity in 2026, including Henkel's April 2026 launch of Technomelt PUR 9015 BV/WV for appliance assembly, which added in-process debonding to reduce scrap and enable rework. That positioning ties adhesive selection directly to factory waste-reduction targets.
Feedstock security and localization remain another whitespace area as formulators manage cost and availability risks in isocyanates and derivatives that underpin polyurethane chemistries. Covestro's July 2026 acquisition of two former Vencorex production sites for HDI derivatives in Rayong, Thailand and Freeport, Texas shows continued investment to expand upstream capacity relevant to polyurethane coatings, adhesives, and sealants, supporting supply resilience for high-performance formulations. On technology, patent disclosures in 2026 on reactive PUR hot-melt compositions designed to improve adhesion to challenging metal substrates, such as mill-grade aluminum, indicate continued innovation that broadens PU HMA use in appliances, electronics housings, and lightweight assemblies where surface preparation is a cost and throughput constraint.
Recent Industry Developments
- July 2026: Covestro completed the acquisition of two former Vencorex production sites for HDI derivatives in Rayong, Thailand and Freeport, Texas. The move expands its polyurethane intermediates network that serves coatings, adhesives, and sealants, supporting supply resilience for downstream formulators that rely on stable isocyanate-derivative availability.
- December 2025: 3M launched the 3M Adhesive Mix Monitor, providing real-time feedback on mix quality during two-part adhesive dispensing. The launch strengthens process-control toolsets used by manufacturers to reduce waste and rework, and it supports broader adoption of automated dispensing where consistent bond quality is critical.
- September 2024: Arkema (Bostik) introduced its Kizen LIME range as part of its decarbonization and net-zero positioning for adhesives. The launch underscores continued product development around lower-impact formulations for packaging and related applications, widening the set of sustainability-labeled options that compete with conventional hot-melt systems.
Research Methodology Framework and Report Scope
Market Definition and Coverage
This market covers polyurethane (PU) hot melt adhesives sold as 100% solids, applied in a molten state, and used to bond substrates across industrial and consumer uses. We size the market in value terms and include revenues from reactive and non-reactive PU hot melt adhesive products.
Scope exclusions: We exclude non-PU hot melt chemistries, water-based and solvent-based liquid adhesives, and in-house transfer pricing that is not tied to an external sale.
Segmentation Overview
- By Type
- Reactive
- Non-Reactive
- By Application
- Paper, Board, and Packaging
- Electronics and Electrical
- Automotive
- Furniture and Woodworking
- Footwear
- Healthcare
- Textiles
- Bookbinding
- Other Applications
- By Geography
- Asia-Pacific
- China
- India
- Japan
- South Korea
- Rest of Asia-Pacific
- North America
- United States
- Canada
- Mexico
- Europe
- Germany
- United Kingdom
- France
- Italy
- Russia
- Rest of Europe
- South America
- Brazil
- Argentina
- Rest of South America
- Middle East and Africa
- Saudi Arabia
- South Africa
- Rest of Middle East and Africa
- Asia-Pacific
Data Sources, Market Sizing, and Validation
Desk Research
Desk work starts by pinning down the PU hot melt adhesive value chain, common units, and how demand shows up in end uses like packaging, footwear, and furniture. For this, we lean on public sources such as US Census manufacturing data, USITC trade statistics, Eurostat, UN Comtrade, and technical publications from standards bodies and peer reviewed polymer and adhesion journals.
Next, we cross-check these signals with company annual reports, investor presentations, product technical datasheets, and association websites that track adhesives and downstream activity. A paid subscription for company financials and intelligence is used to clarify business line splits where disclosures are limited, and a patent database is referenced to track product innovation and cure-chemistry shifts. The sources named here are illustrative only, and many other references were also used during data collection, validation, and clarification.
Primary Interviews and Surveys
Primary work is used to confirm what gets purchased as PU hot melt adhesive in real projects, and to stress-test pricing and mix changes that are hard to see in public data. We spoke with a spread of raw material participants, adhesive formulators, converters, and downstream users across major regions so assumptions on reactive versus non-reactive adoption and application demand can be tightened.
Distribution of primary research fieldwork respondents
| Company type | Respondent position | Region |
|---|---|---|
| Top tier: 38% | CXOs: 12% | APAC: 50% |
| Mid tier: 40% | Functional/Unit leaders: 33% | EMEA: 32% |
| Smaller Players: 22% | Managers: 55% | Americas: 18% |
Market-Sizing & Forecasting
Sizing begins with a top-down build that reconstructs the demand pool from adhesives consumption signals in key end uses (packaging lines, footwear assembly, woodworking and furniture output, and selected automotive and electronics bonding needs), which is then converted into value using application-level pricing logic. After the demand pool is shaped, we corroborate totals with selective bottom-up approximations, including supplier revenue sampling, channel checks, and sanity tests using average selling price ranges multiplied by implied volume for large applications.
Inputs used in the model include reactive versus non-reactive mix, regional manufacturing output trends, export and import movement for related adhesive preparations, typical PU hot melt application rates in major uses, and observed pricing movements tied to isocyanate and polyol cost direction. When bottom-up checks are incomplete for smaller countries or fragmented channels, we use proxy indicators such as downstream production and conversion capacity before normalizing totals back to the global view. Forecasts rely mainly on scenario analysis, where base case demand growth is linked to packaging throughput, e-commerce fulfillment intensity, and shifting preferences toward fast setting and low-VOC bonding, and then reviewed with primary inputs to keep the trajectory consistent with end-use production trends.
Data Validation & Update Cycle
Outputs are validated through triangulation across independent signals, where apparent demand, revenue-side checks, and trade and manufacturing indicators are compared for consistency. Outliers are flagged and reworked, and any large variance triggers a follow-up check on assumptions such as application rates, pricing cadence, or the reactive share by region.
Before sign-off, the full model goes through a multi-step analyst review so formulas, conversions, and regional rollups remain traceable. The report is refreshed annually, and interim updates are made when material events change cost curves, supply availability, or demand outlook. Right before delivery, a fresh pass is completed so clients receive the most current view available.
Mordor Intelligence's Polyurethane Pu Hot Melt Adhesive Market Estimate Compared With Other Published Estimates
Published market values for PU hot melt adhesives can look far apart because the scope and the counting rules are not always aligned, even when the titles read similarly. Differences usually come from what chemistries are included, whether the number is global or selectively regional, and how pricing is handled across reactive and non-reactive products.
The main gap comes from mixing broader hot melt adhesive chemistries into the same total, where Mordor Intelligence counts only polyurethane hot melt adhesives (reactive and non-reactive) and keeps out other hot melt families that are often used in packaging and woodworking. Another driver is year selection and currency timing, since some sources quote earlier base years and then apply a single growth rate without re-checking application demand signals. We also see variation when forecasts assume aggressive reactive penetration without validating it against end-use production trends and practical adoption barriers.
Benchmark comparison
| Source | Market Size | Gaps in Research Methodology |
|---|---|---|
| Mordor Intelligence | USD 2.12 B (2026) | |
| Industry Publisher A | USD 6.70 B (2024) | This figure appears to represent a wider hot melt adhesive scope under a PU label, which can pull in adjacent hot melt families and inflate totals versus a PU-only cut. It also uses an earlier base year, so pricing and mix changes in 2025-2026 may not be fully revalidated. |
| Market Research Portal B | USD 2.25 B (2025) | The year is closer, but the model likely uses broader application coverage and a different reactive adoption path, which can shift the weighted average price and the implied demand pool. Regional allocation choices and conversion assumptions can also move the total when smaller markets are not checked against manufacturing and trade signals. |
The spread in the table mostly comes down to scope discipline and how demand is reconstructed from real end-use activity before price is applied. By keeping the counting rules explicit and then cross-checking with supplier-side and application-side signals, we arrive at a market value that can be followed and repeated rather than being driven by broad category rollups.
Key Questions Answered in the Report
How large is the polyurethane hot melt adhesives market in 2026?
The polyurethane hot melt adhesives market size stands at USD 2.12 billion in 2026 and is forecast to reach USD 3.03 billion by 2031.
Which segment is growing fastest within polyurethane hot melt adhesives?
Healthcare bonding applications register the highest CAGR at 8.08% thanks to medical-device miniaturization and the need for biocompatible, sterilizable adhesives.
What share do reactive polyurethane hot melts hold?
Reactive grades account for 62.12% of worldwide revenue, leading the field by virtue of their moisture-curing crosslinking capability.
Why is Asia-Pacific dominant in demand?
Electronics manufacturing scale in China, rising automotive production in India, and strong packaging growth across the region push Asia-Pacific to 45.78% market share.
What is the primary restraint on market growth?
Volatility in MDI/TDI feedstock pricing, with swings up to 45% in recent years, squeezes margins and complicates procurement planning.