Market Overview
| Study Period | 2021 - 2031 |
|---|---|
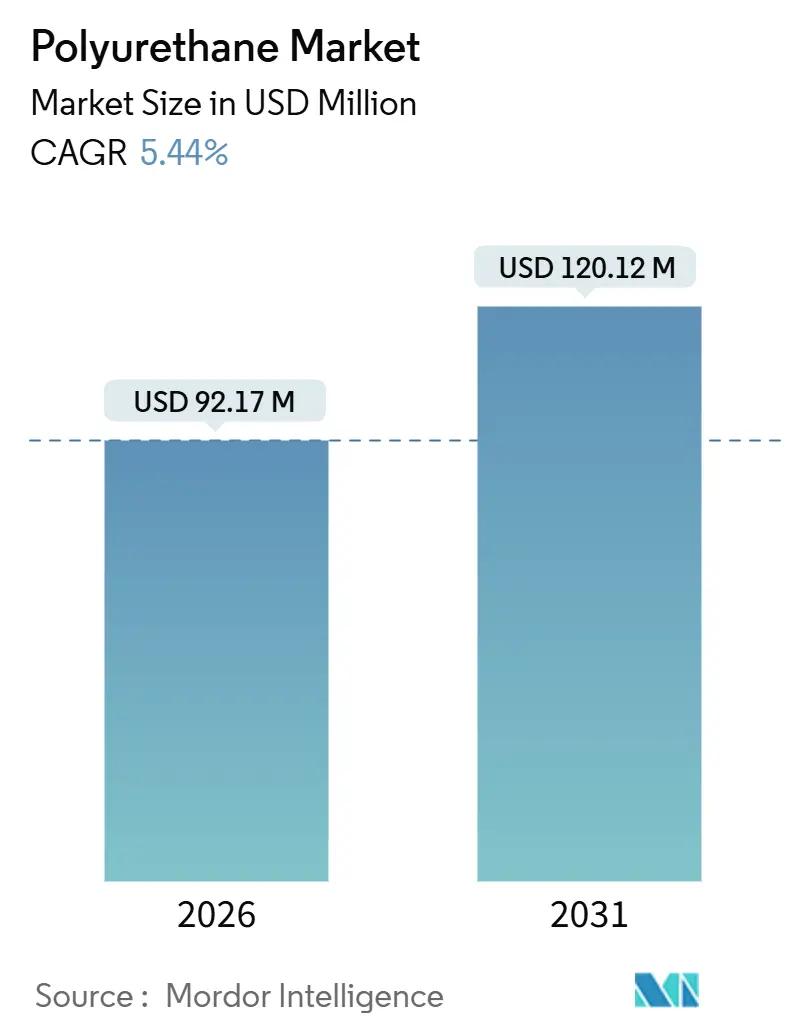
| Market Size (2026) | USD 92.17 Million |
| Market Size (2031) | USD 120.12 Million |
| Growth Rate (2026 - 2031) | 5.44% CAGR |
| Fastest Growing Market | Asia-Pacific |
| Largest Market | Asia-Pacific |
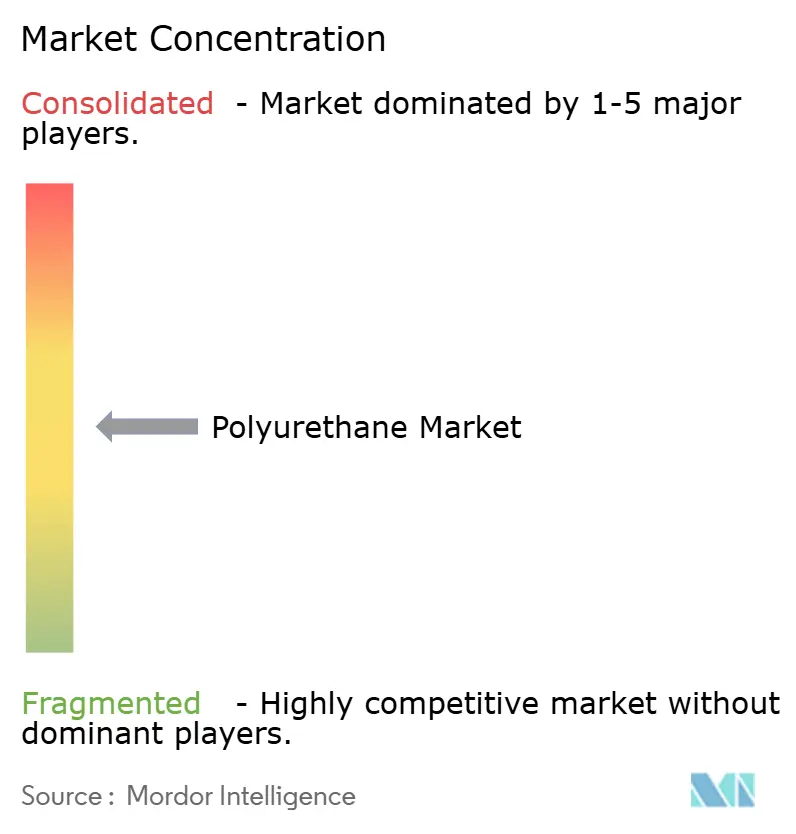
| Market Concentration | Medium |
Major Players *Disclaimer: Major Players sorted in no particular order Image © Mordor Intelligence. Reuse requires attribution under CC BY 4.0. | |
Polyurethane Market Analysis by Mordor Intelligence
The Polyurethane Market size is estimated at USD 92.17 million in 2026, and is expected to reach USD 120.12 million by 2031, at a CAGR of 5.44% during the forecast period (2026-2031). Regulatory shifts in building insulation, automotive lightweighting, and offshore wind drive the polyurethane market toward higher-performance rigid and flexible foams, even as volatile isocyanate costs pressure margins. Bio-based polyols are advancing rapidly, and Asia-Pacific capacity additions are recalibrating global trade flows. At the same time, oversupply in toluene di-isocyanate (TDI) is intensifying price competition, prompting Western producers to reassess European assets. Downstream converters continue to fragment, which complicates pricing power but creates room for specialty grades and service-driven solutions in construction and furniture applications.
Key Report Takeaways
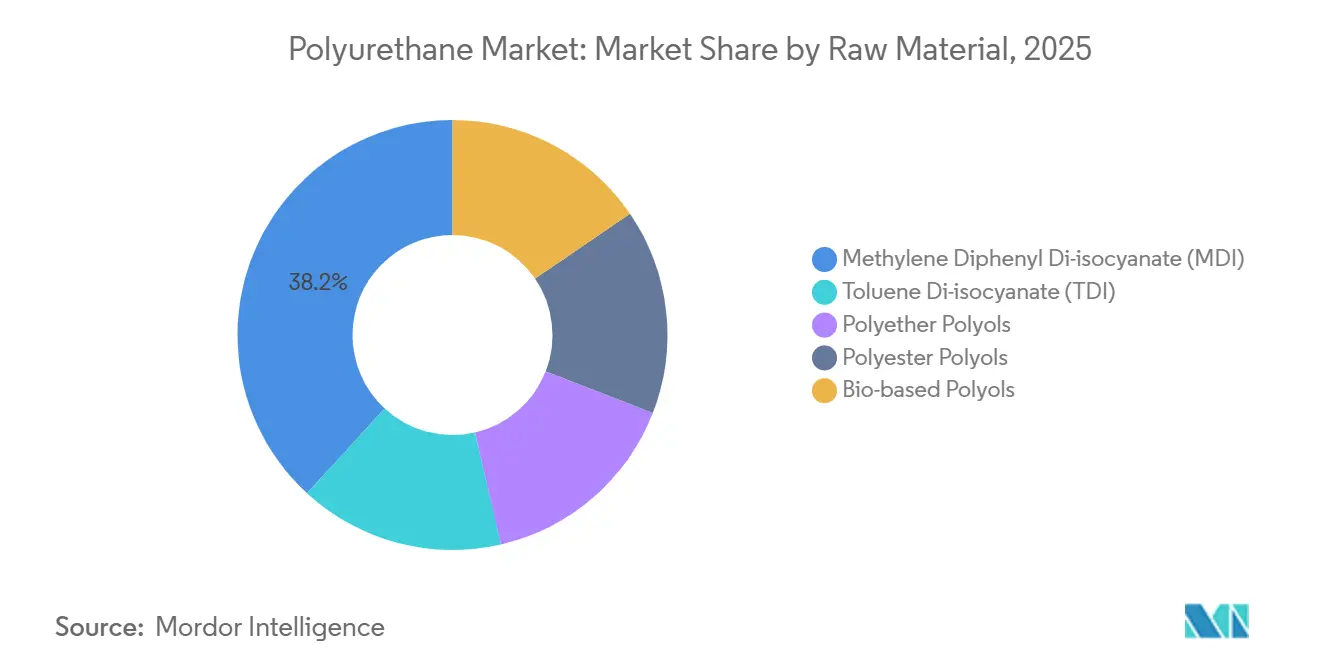
- By raw material, methylene diphenyl di-isocyanate held 38.17% of the polyurethane market share in 2025, while bio-based polyols are advancing at a 12.60% CAGR to 2031.
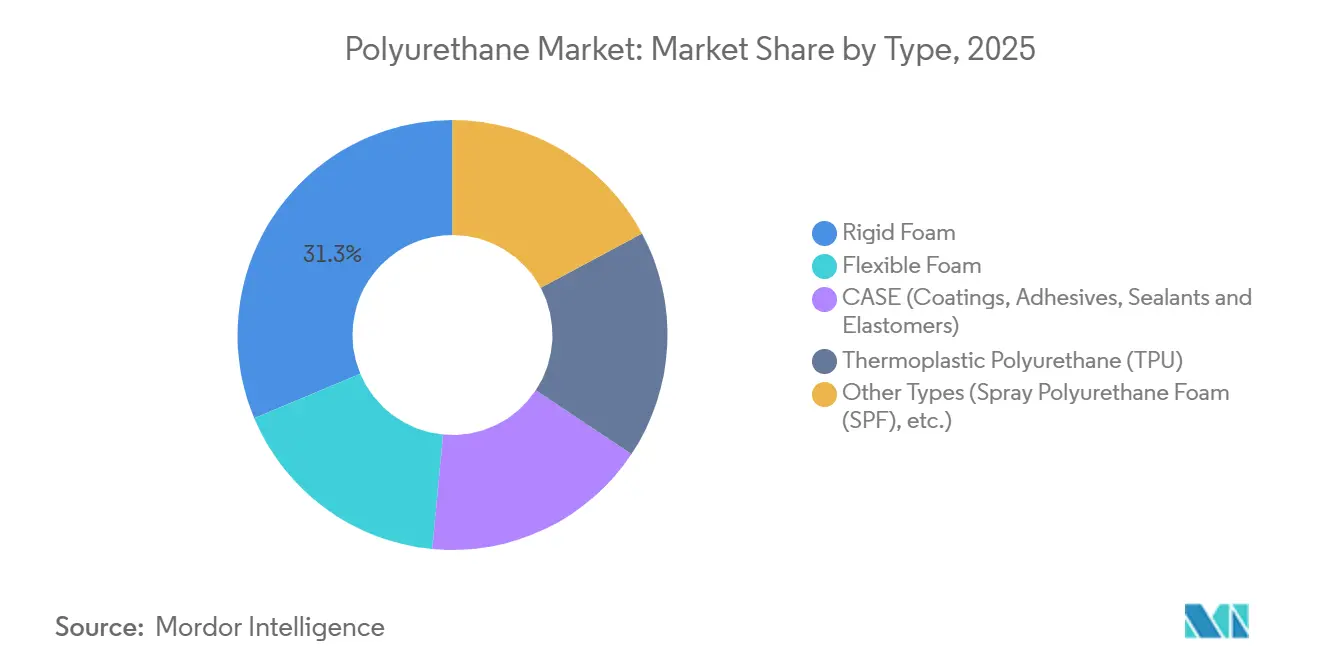
- By type, rigid foam commanded 31.33% share of the polyurethane market in 2025, while flexible foam is forecast to expand at a 7.80% CAGR through 2031.
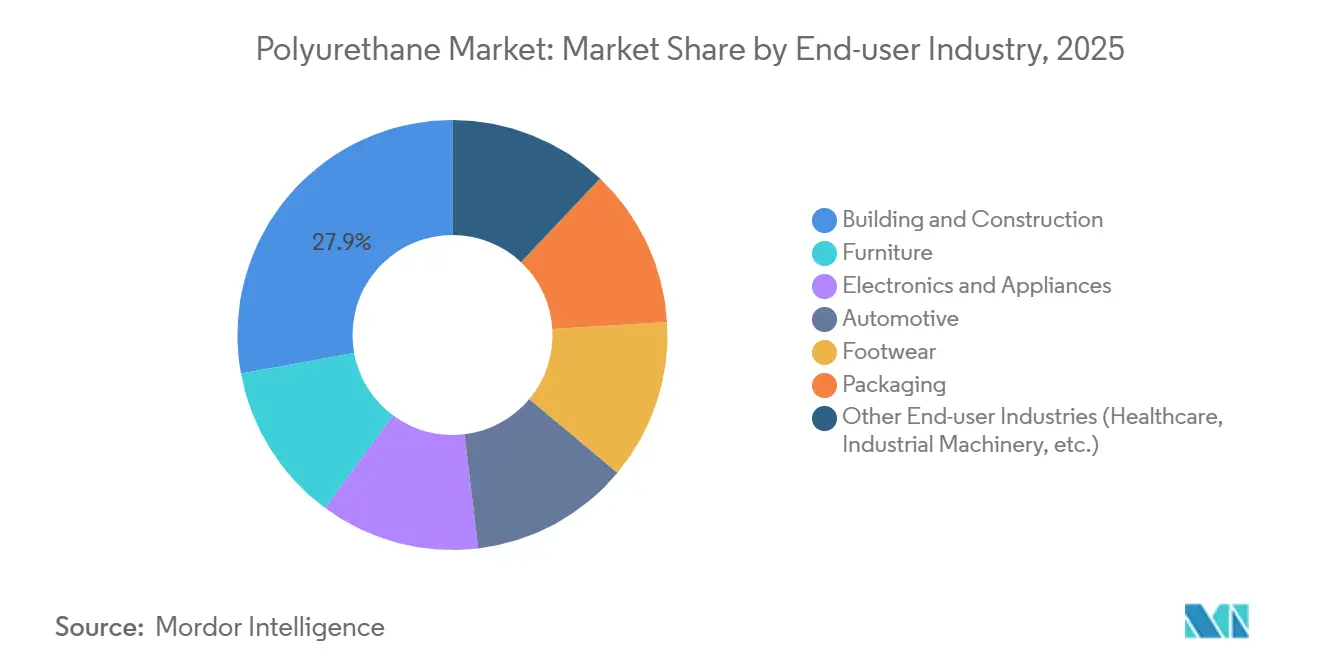
- By end-user industry, building and construction accounted for a 27.87% share of the polyurethane market size in 2025 and is advancing at an 8.90% CAGR to 2031.
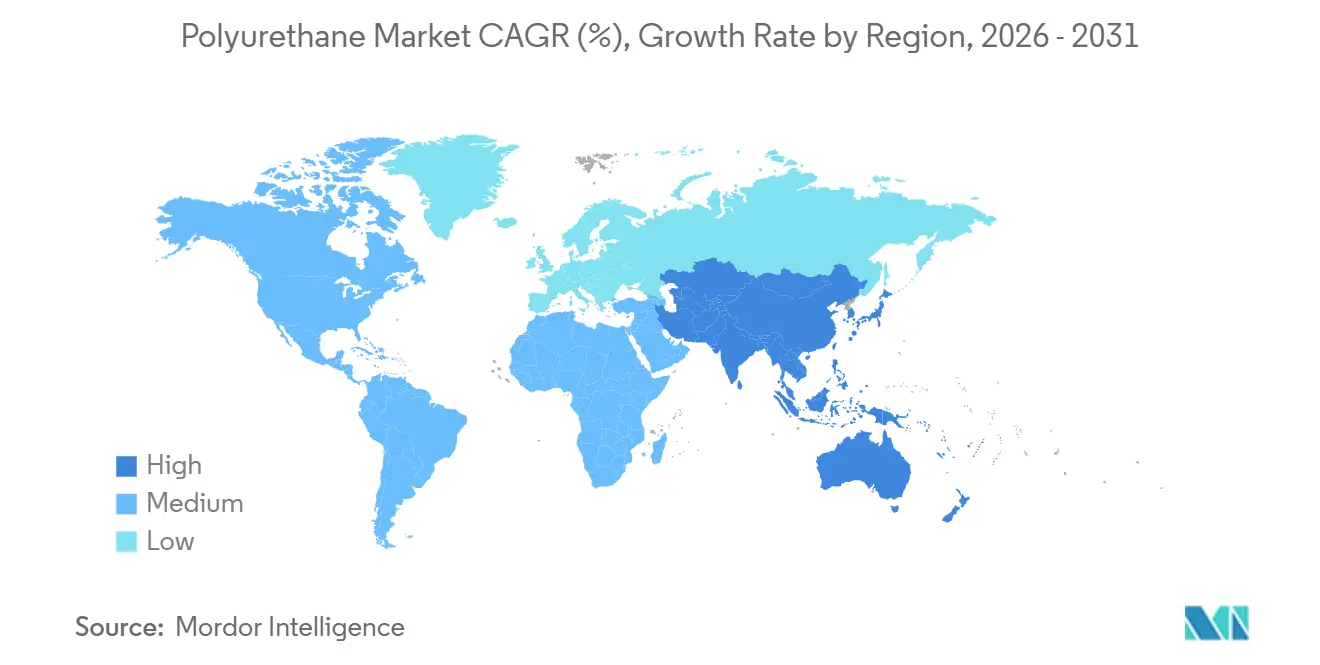
- By geography, Asia-Pacific led with 47.05% revenue share in 2025; the region is projected to grow at a 6.80% CAGR through 2031.
Note: Market size and forecast figures in this report are generated using Mordor Intelligence’s proprietary estimation framework, updated with the latest available data and insights as of January 2026.
Global Polyurethane Market Trends and Insights
Drivers Impact Analysis
| Driver | (~) % Impact on CAGR Forecast | Geographic Relevance | Impact Timeline |
|---|---|---|---|
| Growing demand from automotive lightweighting | +1.2% | Global, with concentration in North America, Europe, and China | Medium term (2-4 years) |
| Booming building and construction insulation demand | +1.5% | Global, led by EU renovation wave and Middle East mega-projects | Long term (≥ 4 years) |
| Surge in high-resilience furniture and bedding foams | +0.8% | Global, particularly North America and Asia-Pacific | Medium term (2-4 years) |
| Adoption of PU in offshore wind turbine blades and nacelle covers | +0.4% | APAC and Europe, with spillover to North America | Long term (≥ 4 years) |
| Mass-customization of footwear using PU additive manufacturing | +0.3% | Global, early gains in North America and Europe | Short term (≤ 2 years) |
| Source: Mordor Intelligence | |||
Understand The Key Trends Shaping This Market
Download PDF
Growing Demand from Automotive Lightweighting
Automakers are replacing steel and aluminum with polyurethane composites to meet the European Union’s 93.6 g/km fleet-average CO₂ target for 2025 and the United States’ corporate average fuel-economy standard of 49 mpg for 2026. BASF’s spray-transfer molding cut the Ford F-150 Lightning front crossmember mass by 30% without sacrificing crash safety. Jeep’s Grand Cherokee 4xe uses a polyurethane composite tailgate that is 18% lighter than stamped steel, and Toyota trims 2.4 kg per Tundra hybrid using polyurethane seat frames. Each kilogram saved extends battery-electric-vehicle range by 1–2 km, a benefit that amplifies as battery packs grow.
Booming Building and Construction Insulation Demand
Directive 2024/1275 obliges EU members to report life-cycle global-warming potential for insulation and mandates zero-operational-emission buildings by 2030. Rigid polyurethane foam, with thermal conductivity of 0.022 W/m·K, enables thin-wall retrofits where floor-space premiums are high. The U.S. EPA’s hydrofluorocarbon phase-down caps blowing agents at GWP 150 from 2025, pushing formulators toward costlier hydrofluoroolefins[1]U.S. Environmental Protection Agency, “Phasedown of Hydrofluorocarbons,” epa.gov . Saudi Arabia’s USD 144.3 billion 2024 contract awards specify rigid polyurethane panels for desert passive-house performance. Together, these policies lift demand faster than flexible foam, explaining the 1.5 percentage-point boost to the polyurethane market CAGR despite rising production costs.
Surge in High-Resilience Furniture and Bedding Foams
Consumers favor mattresses that retain loft over a decade and seating that resists bottoming. Tempur Sealy expanded gross margin 120 bps in 2025 by shifting to higher-density viscoelastic foams. Purple Innovation’s hybrid beds combine polyurethane support layers with a gel-flex grid, capitalizing on e-commerce channels that now exceed 35% of U.S. mattress sales. Automotive seat suppliers Adient and Lear specify 50–60 kg/m³ high-resilience foam to manage battery-pack weight concentrations. These trends contribute 0.8 percentage points to polyurethane market growth and draw capacity investments to Asia-Pacific, where labor costs remain lower.
Adoption of PU in Offshore Wind Turbine Blades and Nacelle Covers
Covestro, Goldwind, and LZ Blades reached the thousand-blade milestone in 2024 with a 64.2 m polyurethane blade approved by DNV GL. Polyurethane’s glass-transition of −40 °C sustains modulus in Arctic and North Sea sites, while elongation at break above 200% absorbs gust loads. Erosion-resistant polyurethane leading-edge coatings double inspection intervals and save up to USD 25,000 per turbine annually. Asia-Pacific installed 7.4 GW of offshore wind in 2024, concentrating demand and adding 0.4 percentage points to the polyurethane market CAGR.
Restraints Impact Analysis
| Restraint | (~) % Impact on CAGR Forecast | Geographic Relevance | Impact Timeline |
|---|---|---|---|
| Volatile isocyanate feedstock prices | -0.9% | Global, with acute impact in Asia-Pacific and Europe | Short term (≤ 2 years) |
| Tightening global PFAS and di-isocyanate exposure regulations | -0.7% | EU and North America, with spillover to APAC | Medium term (2-4 years) |
| Competition from bio-based thermoplastic polymers | -0.5% | Global, concentrated in packaging and textiles | Long term (≥ 4 years) |
| Source: Mordor Intelligence | |||
Volatile Isocyanate Feedstock Prices
MDI and TDI prices declined 18–22% year-on-year in April 2025 as Chinese overcapacity met muted downstream demand. ResourceWise confirmed sustained weakness in November 2025, compelling integrated producers to curb rates. Smaller converters, exposed to spot markets, face feedstock swings that can equal 60% of cost of goods. Demand destruction ensues when spikes prompt builders to delay projects or shift to mineral wool, knocking 0.9 percentage points from the polyurethane market CAGR.
Tightening Global PFAS and Di-Isocyanate Exposure Regulations
EU REACH limits di-isocyanate exposure to 6 µg NCO/m³, requiring closed-loop dispensing that costs USD 200,000–500,000 per line. OSHA has proposed a 1 ppb ceiling in the United States, implying USD 1.2 million per mid-sized facility for controls. California’s Proposition 65 warnings dampen spray-foam retrofit demand, and a pending EU PFAS ban threatens fluorinated catalysts and blowing agents. These measures trim 0.7 percentage points from polyurethane market growth as specifiers pivot to mineral wool or vacuum-insulation panels.
Segment Analysis
By Raw Material: MDI Anchors Volume as Bio-Polyols Accelerate
Methylene diphenyl di-isocyanate secured 38.17% of polyurethane market share in 2025, underscoring its position in rigid insulation and thermoplastic polyurethane. TDI remains essential for flexible furniture foam, though oversupply has suppressed prices since mid-2024. Polyether and polyester polyols fill mainstream formulations, while bio-based polyols advance at a 12.60% CAGR on the back of Cargill soybean oils and Covestro cardyon CO₂ technology. The resulting mix points to a future where conventional feedstocks protect volume through economies of scale, and renewable polyols capture niches demanding verified low carbon footprints.
Bio-polyol penetration aligns with EU Scope 3 reporting and U.S. brand commitments, lifting margins despite a 20–30% cost premium. Covestro’s inaugural commercial cardyon® grades incorporate 20% captured CO₂, illustrating how process innovation can offset fossil-based intermediates and differentiate offerings. Polyester polyols gain share in wind-turbine resin infusion and automotive adhesive films where aromatic chemistry enhances UV stability. Meanwhile, price-driven TDI dynamics force Western producers to rationalize assets, evidenced by Dow’s European strategic review. The polyurethane market absorbs these shifts by balancing low-cost Asian isocyanates with high-margin specialty systems in North America and Europe.
Get Detailed Market Forecasts at the Most Granular Levels
Download PDF
By Type: Flexible Foam Outpaces Rigid on E-Commerce Tailwinds
Rigid foam held 31.33% of polyurethane market size in 2025, but flexible foam is expected to rise faster at a 7.80% CAGR as online retail drives demand for protective cushioning below 30 kg/m³. CASE formulations provide abrasion-resistant coatings and elastomers for industrial floors and automotive underbodies, securing premium margins. Thermoplastic polyurethane expands into smartphone cases and electric-vehicle battery covers, offering melt reprocessability. Spray polyurethane foam addresses retrofit insulation, though stricter U.S. exposure limits may temper immediate uptake. Overall, the polyurethane market continues to diversify across foam, elastomer, and dispersion technologies.
Flexible foam’s ascent is tied to high-resilience furniture and mattress upgrades that fetch a 30–40% price premium over commodity grades. Rigid foam growth skews toward the Middle East and Europe, where mega-projects and renovation mandates override softness in North American housing starts. Thermoplastic polyurethane benefits from shorter injection-molding cycles under 30 seconds, lowering scrap below 3% and enabling mass-customized footwear midsoles. CASE applications, such as polyurea sealants, remain resilient because performance specifications resist substitution.
Get Detailed Market Forecasts at the Most Granular Levels
Download PDF
By End-User Industry: Construction Leads, Automotive Gains
Building and construction represented 27.87% of polyurethane market size in 2025 and advances at an 8.90% CAGR thanks to zero-emission building codes and Middle Eastern mega-projects. Automotive accounts for meaningful volume through lightweight composites that reduce carbon intensity per vehicle. Furniture and bedding leverage high-resilience foam to deliver longer warranty cycles and e-commerce shipping durability. Appliances demand cyclopentane-blown rigid insulation to meet tightened energy labels. Footwear, although smaller, showcases additive manufacturing’s role in premium athletic products.
Construction uptake hinges on rigid-foam panels with R-values of 6–7 per inch, essential for space-constrained retrofits in Europe and high-cooling-load climates in the Gulf. Automotive platforms use polyurethane composites to offset battery mass; every kilogram saved translates to 20 Wh of range. Electronics manufacturers invest USD 50–100 million per plant to retrofit blowing-agent lines compliant with GWP 150 limits, deepening rigid foam’s moat versus polystyrene. Furniture capacity shifts to Asia-Pacific, where labor efficiencies cut contour-cutting costs by up to 50%. Packaging remains the wildcard, as polyurethane must justify its price premium through demonstrable damage-reduction metrics.
Get Detailed Market Forecasts at the Most Granular Levels
Download PDF
Geography Analysis
Asia-Pacific captured 47.05% of polyurethane market revenue in 2025 and is set for a 6.80% CAGR to 2031 as Wanhua expands MDI capacity by another 400,000 tpa at Ningbo and eyes a similar addition in Fujian by 2027. China’s dominance rests on integrated coal-to-aniline routes, while India’s 25.9 million vehicle output in fiscal 2024 drives dual demand for seat foam and building insulation. ASEAN construction booms in Indonesia and Vietnam augment regional pull on flexible-foam imports. Japan and South Korea, though mature, pioneer bio-based polyols to meet corporate net-zero pledges.
In North America housing starts remain 20% below 2020 highs, muting rigid-foam momentum. The EPA’s GWP 150 limit adds USD 0.15–0.25 per board foot to costs, pressuring smaller spray-foam applicators. Canada’s climate-zone codes require R-30–40 walls, steering builders toward high-performance foams. Mexico benefits from nearshoring of appliances and electronics, stimulating demand for both flexible and rigid polyurethane systems.
Europe sits at a crossroads where Directive 2024/1275 underpins a renovation wave, but elevated energy and compliance costs erode producer competitiveness. Residential permits fell 8% in 2024, yet Nordic retrofit incentives cover 40% of insulation costs, spurring spray-foam demand. REACH exposure limits compel investments that favor integrated multinationals, while Dow’s asset review hints at potential consolidation.
South America and the Middle East and Africa hinge on mega-projects. Saudi Arabia’s USD 144.3 billion in 2024 awards includes passive-house-spec rigid panels for NEOM. The UAE’s USD 81.3 billion contract slate boosts spray-foam waterproofing in tunneling. Brazil and Argentina recover flexible-foam demand as consumer credit loosens. Nigeria deploys rigid foam in pharmaceutical cold-chain warehouses, signaling embryonic but strategic growth nodes.
Get Analysis on Important Geographic Markets
Download PDF
Competitive Landscape
The polyurethane market is moderately concentrated: BASF, Covestro, Wanhua, Dow, and Huntsman command an estimated 52% of global polyurethane capacity, but thousands of converters keep downstream structures fragmented. Integrated players leverage backward links into aniline and propylene oxide to enjoy 15–20% cost advantages over spot buyers. Wanhua’s coal-to-MDI route delivers cash costs near USD 1,200 per ton versus USD 1,500–1,700 in Western Europe, enabling aggressive pricing in export markets.
BASF’s Materials segment volume rose 0.7% in 2024 despite a 4.5% sales decline, highlighting price pressure rather than demand loss[2]BASF, “Q4 2024 Earnings Release,” basf.com . Covestro volumes slipped 0.4% in Q1 2025 as TDI oversupply sent Chinese spot prices back to 2015 levels. Dow’s European review underscores how energy-cost disparities and tighter exposure rules force Western rationalization. Specialty focus—bio-polyols, thermoplastic polyurethane, and waterborne dispersions—offers margin relief.
Emerging disruptors target additive manufacturing and bio-based chemistries. Carbon’s million-plus 4D midsoles show how Digital Light Synthesis bypasses tooling bottlenecks, while Henkel’s 60% renewable polyurethane adhesive widens options for electric-vehicle battery packs. Chinese formulators invest in lower-cost systems for e-commerce packaging, whereas European players develop PFAS-free catalysts. Overall, strategic moves revolve around integration, specialty chemistry, and regional-footprint optimization.
Polyurethane Industry Leaders
Covestro AG
Huntsman International LLC
Wanhua
Dow
BASF
- *Disclaimer: Major Players sorted in no particular order
Need More Details on Market Players and Competitors?
Download PDF
Recent Industry Developments
- December 2025: BASF expanded its spray polyurethane foam (SPF) portfolio with WALLTITE RSB, an advanced closed-cell spray polyurethane foam. WALLTITE RSB integrated recycled and renewable raw materials, resulting in a reduced product carbon footprint (PCF) compared to traditional formulations.
- April 2025: Rymbal introduced FluidX, a polyurethane that was 100% recyclable through physical and chemical processes. It featured a fully water-blown system, providing the benefits of a low carbon footprint and reduced environmental impact.
Research Methodology Framework and Report Scope
Market Definitions and Key Coverage
Our study sizes the global polyurethane market as revenue and volume from freshly produced flexible foams, rigid foams, CASE products (coatings, adhesives, sealants, elastomers), thermoplastic polyurethane, and smaller specialty grades created by reacting polyols with di-isocyanates and sold up to the first converter.
Scope exclusion: recycled or re-bonded scrap and downstream finished articles such as mattresses, footwear, or molded car seats are not included.
Segmentation Overview
- By Raw Material
- Methylene Diphenyl Di-isocyanate (MDI)
- Toluene Di-isocyanate (TDI)
- Polyether Polyols
- Polyester Polyols
- Bio-based Polyols
- By Type
- Rigid Foam
- Flexible Foam
- CASE (Coatings, Adhesives, Sealants and Elastomers)
- Thermoplastic Polyurethane (TPU)
- Other Types (Spray Polyurethane Foam (SPF), etc.)
- By End-user Industry
- Building and Construction
- Furniture
- Electronics and Appliances
- Automotive
- Footwear
- Packaging
- Other End-user Industries (Healthcare, Industrial Machinery, etc.)
- By Geography
- Asia-Pacific
- China
- India
- Japan
- South Korea
- ASEAN Countries
- Rest of Asia-Pacific
- North America
- United States
- Canada
- Mexico
- Europe
- Germany
- United Kingdom
- France
- Italy
- Spain
- NORDIC Countries
- Rest of Europe
- South America
- Brazil
- Argentina
- Rest of South America
- Middle East and Africa
- Saudi Arabia
- South Africa
- United Arab Emirates
- South Africa
- Nigeria
- Rest of Middle East and Africa
- Asia-Pacific
Detailed Research Methodology and Data Validation
Primary Research
Mordor analysts supplement desk work with interviews and short surveys of resin formulators, foam fabricators, and procurement leads across Asia-Pacific, North America, Europe, and the Middle East. These interactions validate regional price spreads, substitution trends, and near-term order books that statistics alone cannot reveal.
Desk Research
We begin with open, tier-1 datasets, including UN Comtrade trade codes for MDI, TDI, and polyols, Eurostat PRODCOM output tables, US EIA feedstock curves, OECD and China NBS construction indices, and OICA vehicle assembly counts. Annual reports, 10-Ks, and investor decks from leading producers, plus news captured through Dow Jones Factiva, clarify capacity shifts. Patent searches via Questel and dashboards from PlasticsEurope and the American Chemistry Council anchor technology uptake and demand pools. These examples illustrate, yet do not exhaust, the secondary sources consulted.
Market-Sizing & Forecasting
We rebuild demand through a top-down model that reconciles regional resin production and net trade, then balances them with end-use intensity ratios refined via primary calls. Targeted bottom-up checks, such as average selling price multiplied by sampled foam volumes, calibrate totals. Key variables feeding our multivariate regression include MDI/TDI operating rates, housing starts, light-vehicle assemblies, furniture exports, and insulation thickness mandates. Scenario analysis frames upside and downside paths, while any data gaps are bridged with weighted geographic analogs.
Data Validation & Update Cycle
Outputs pass variance screens, peer cross-checks, and a two-step internal review. We refresh each model annually, with interim updates after material events such as major plant shutdowns.
Why Mordor's Polyurethane Baseline Earns Dependability
Published estimates often diverge because firms vary product boundaries, price assumptions, and refresh cadence.
Our disciplined scope setting and yearly update keep Mordor's 2025 baseline of USD 87.48 billion grounded in observable trade and production signals.
Benchmark comparison
| Market Size | Anonymized source | Primary gap driver |
|---|---|---|
| USD 87.48 B (2025) | Mordor Intelligence | - |
| USD 78.07 B (2024) | Global Consultancy A | CASE omitted; historic five-year average prices applied |
| USD 91.49 B (2024) | Industry Journal B | Recycled foam and seat imports counted |
| USD 89.82 B (2025) | Regional Consultancy C | Constant 2020 FX; GDP-only forecasting |
Taken together, while other publishers provide useful signals, Mordor's balanced mix of open statistics, expert validation, and transparent variable tracking yields a baseline decision-makers can retrace with confidence.
Need A Different Region or Segment?
Customize Now
Key Questions Answered in the Report
What is the current value of the polyurethane market?
The polyurethane market size is USD 92.17 million in 2026 and is forecast to reach USD 120.12 million by 2031.
Which segment is growing fastest within polyurethane applications?
Flexible foam is projected to expand at a 7.80% CAGR through 2031, outpacing rigid foam and CASE segments.
Why is Asia-Pacific so dominant in polyurethane supply?
Asia-Pacific advantages stem from Wanhua’s integrated 3.3 million tpa MDI capacity and lower cash costs, driving 47.05% revenue share in 2025.
How are regulations affecting polyurethane insulation?
EU Directive 2024/1275 and the U.S. EPA’s GWP 150 limit are raising rigid-foam demand but increasing production costs via new blowing-agent requirements.


