
Polystyrene Foam Market Size and Share
Market Overview
| Study Period | 2020 - 2031 |
|---|---|
| Market Size (2026) | USD 44.98 Billion |
| Market Size (2031) | USD 57.22 Billion |
| Growth Rate (2026 - 2031) | 4.92 % |
| Fastest Growing Market | Asia-Pacific |
| Largest Market | Asia-Pacific |
| Market Concentration | Medium |
Major Players *Disclaimer: Major Players sorted in no particular order Image © Mordor Intelligence. Reuse requires attribution under CC BY 4.0. | |
Polystyrene Foam Market Analysis by Mordor Intelligence
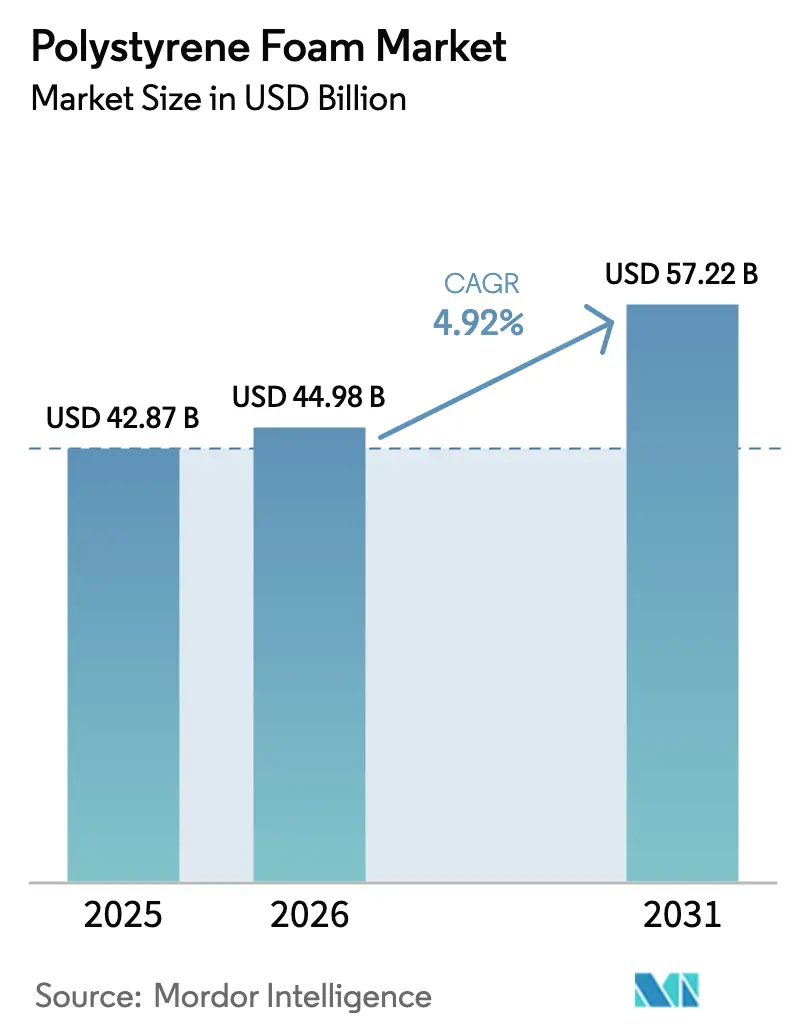
The polystyrene foam market size was valued at USD 42.87 billion in 2025 and estimated to grow from USD 44.98 billion in 2026 to reach USD 57.22 billion by 2031, at a CAGR of 4.92% during the forecast period (2026-2031). Demand resilience stems from the material’s light weight, thermal-insulation performance and cost advantage, qualities that keep it embedded in construction and protective-packaging supply chains even as single-use food-service bans tighten. Expanded polystyrene (EPS) remained the volume leader with 62.15% share in 2024, while extruded polystyrene (XPS) is expanding more quickly at 6.56% CAGR on the back of premium continuous-insulation needs. Asia-Pacific held the largest regional position at 43.65% share in 2024 and is also the fastest-growing territory at 6.91% CAGR, supported by China’s dominance in styrene consumption and subsidy-driven appliance replacements. Regulatory frameworks that reward low-global-warming-potential blowing agents and promote circular-economy recycling are accelerating product reformulations rather than eroding total demand, helping to underpin the polystyrene foam market outlook.
Key Report Takeaways
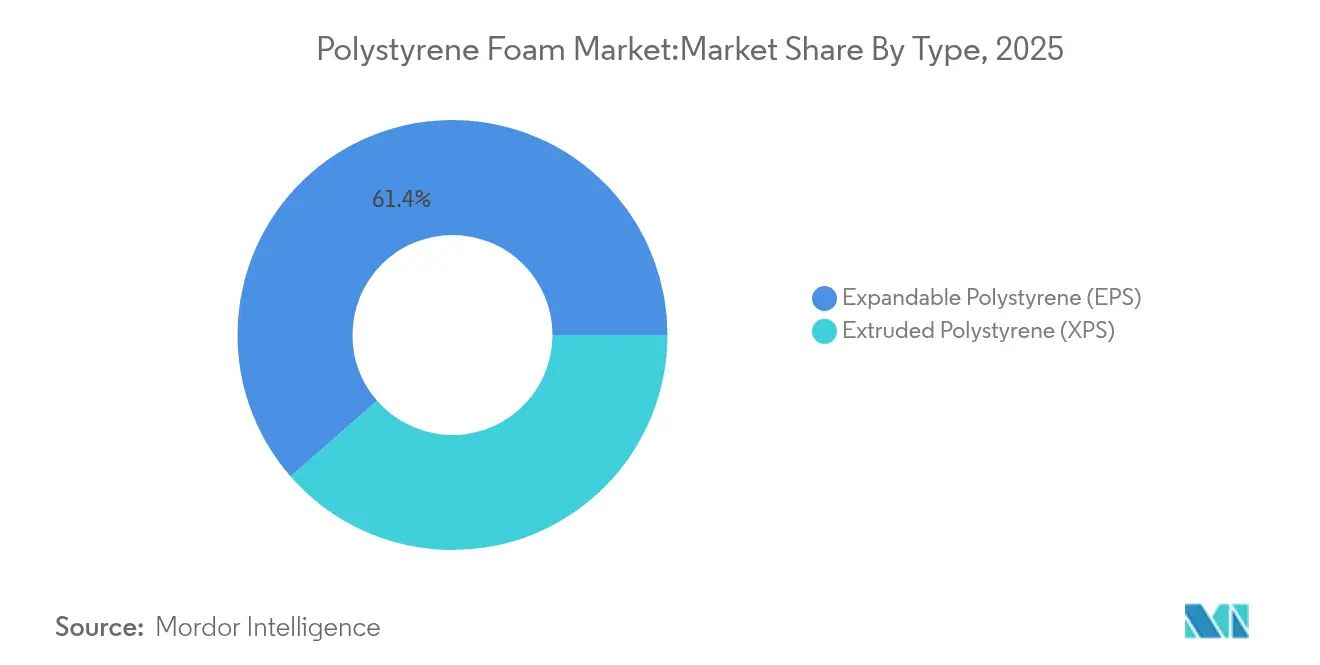
- By type, EPS held 61.43% of the polystyrene foam market share in 2025; XPS is projected to advance at a 6.22% CAGR through 2031.
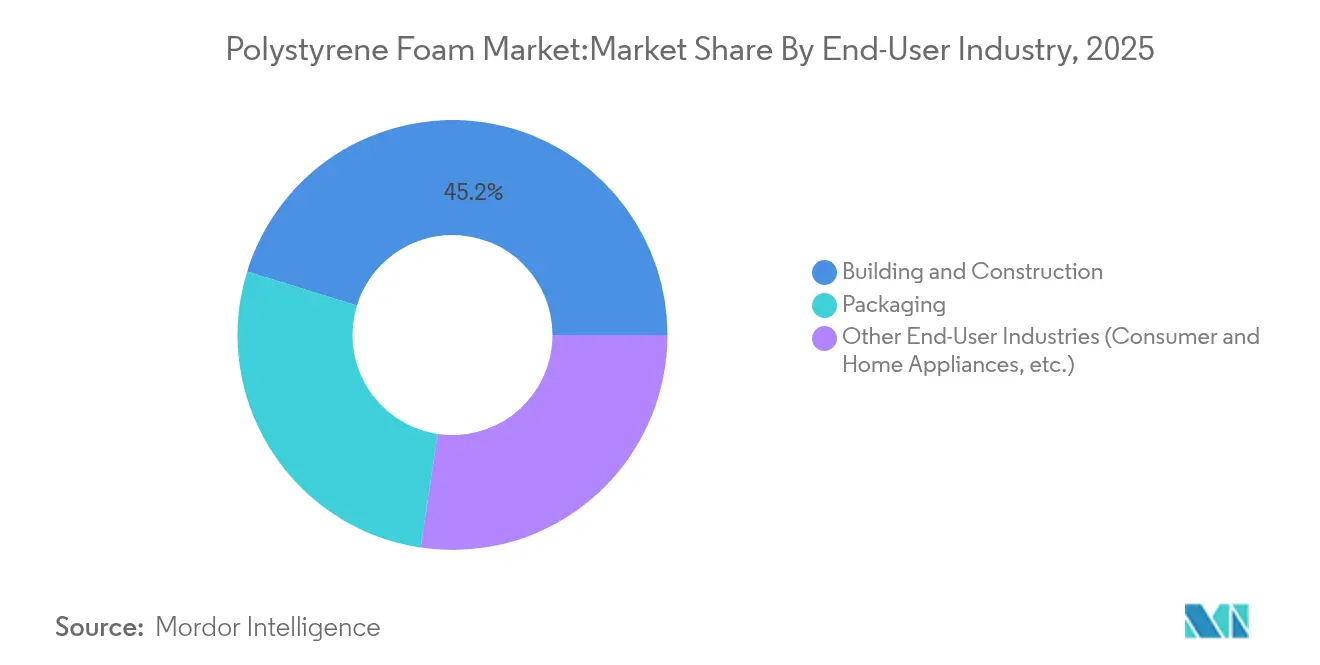
- By end-user industry, building and construction commanded 45.22% of the polystyrene foam market size in 2025, while “other applications” led growth at a 6.88% CAGR to 2031.
- By geography, Asia-Pacific secured 43.12% revenue share in 2025 and is set to grow at a 6.55% CAGR, sustaining its dual leadership position.
Note: Market size and forecast figures in this report are generated using Mordor Intelligence’s proprietary estimation framework, updated with the latest available data and insights as of 2026.
Market Trends and Insights
Drivers Impact Analysis of Polystyrene Foam Market*
| Driver | (~) % Impact on CAGR Forecast | Geographic Relevance | Impact Timeline |
|---|---|---|---|
| Green-building insulation mandates | +1.2% | Global; early gains in North America and EU | Medium term (2-4 years) |
| E-commerce protective-packaging boom | +0.8% | Global; strongest in North America and Asia-Pacific | Short term (≤ 2 years) |
| Cold-chain and pharma-logistics expansion | +0.6% | Global; spill-over to emerging markets | Medium term (2-4 years) |
| Geofoam use in seismic or lightweight embankments | +0.4% | Asia-Pacific core; North America infrastructure projects | Long term (≥ 4 years) |
| Graphite-infused EPS for thin-retrofit insulation | +0.7% | Europe and North America premium markets | Medium term (2-4 years) |
| Source: Mordor Intelligence | |||
Green-building Insulation Mandates
Building-energy codes now require continuous insulation, increasing polystyrene-foam uptake in both new construction and retrofits. The International Building Code recognises foam-plastic insulation when fire-safety layers are integrated, enabling LEED credits and up to 30% HVAC-energy savings. DuPont’s low-GWP XPS reformulation cut embodied carbon 94%, illustrating how regulation spurs innovation while safeguarding addressable demand. Nordic policy success with halogen-free flame retardants offers a blueprint for safer EPS adoption worldwide[1]. Such regulatory clarity keeps the polystyrene foam market on a growth path while supporting environmental goals.
E-commerce Protective-Packaging Boom
Parcel volumes continue to climb, driving demand for shock-absorbing, low-density protective shapes. Amazon’s guidelines encourage right-sizing, making EPS moulded parts attractive for fragile items. At the same time, bio-based contenders such as Ecovative’s mycelium packaging are winning sustainability-minded contracts, highlighting a transition rather than a sudden shift. The net effect is incremental growth for the polystyrene foam market as e-tailers balance cost, performance, and environmental targets.
Cold-chain & Pharma-logistics Expansion
Vaccines and biologics rely on consistent 2 °C-8 °C windows during transit. Approved EPS shippers hold that range for up to 23 hours, a critical feature for direct-to-patient delivery models. Thermo Fisher’s recyclable paper cooler shows the direction of travel, yet healthcare suppliers still prioritise proven thermal stability in life-critical lanes, maintaining near-term EPS demand.
Geofoam Adoption for Seismic/Lightweight Embankments
EPS geofoam, roughly 100 times lighter than soil, mitigates settlement and seismic loads in bridge approaches and slide-prone slopes. Italy’s two-decade track record in road restorations and the I-15 rebuild in Utah provide real-world validation, while Germany’s FGSV code standardises specifications, lowering engineering risk and expanding project pipelines[2].
Restraints Impact Analysis of Polystyrene Foam Market*
| Restraint | (~) % Impact on CAGR Forecast | Geographic Relevance | Impact Timeline |
|---|---|---|---|
| Styrene-monomer price volatility | -0.9% | Global; most acute in Asia-Pacific hubs | Short term (≤ 2 years) |
| Single-use-plastic bans on EPS food-service | -0.6% | North America and Europe regulatory leaders | Medium term (2-4 years) |
| Mushroom or mycelium packaging substitution | -0.3% | Global; early use in premium niches | Long term (≥ 4 years) |
| Source: Mordor Intelligence | |||
Styrene-monomer Price Volatility
Rising benzene costs transmit directly to styrene and then to polystyrene, pushing producers to announce USD 110 per-ton surcharges in multiple regions in early 2024[3]. Europe’s shift from net exporter to net importer, with 2023 inflows near 400 kilotons, added supply-chain risk. These swings squeeze converter margins and temper near-term expansion in the polystyrene foam market.
Single-use-Plastic Bans on EPS Food-service
Oregon’s January 2025 prohibition on EPS take-away containers exemplifies tightening curbs. France considered a parallel ban before pausing to align with EU law. Such measures redirect foam demand away from casual dining toward higher-value, longer-life uses, trimming 0.6 percentage points from forecast growth.
*Our forecasts treat driver/restraint impacts as directional, not additive. The impact forecasts reflect baseline growth, mix effects, and variable interactions.
Polystyrene Foam Market Segment Analysis
By Type:
EPS Dominance Meets XPS InnovationEPS captured 61.43% of polystyrene foam market share in 2025 on the strength of broad use in building envelopes and molded packaging. The polystyrene foam market size for EPS amounted to USD 26.34 billion in 2025, and the segment is slated to post mid-single-digit gains as recyclability programmes expand. EPS’s low cost and versatility underpin a lasting edge even as regulations favour flame-retardant-free formulations.
XPS generates higher unit margins and is advancing at 6.22% CAGR to 2031. It features thermal conductivity between 0.032-0.037 W/(m·K), outperforming EPS, which ranges 0.035-0.040 W/(m·K). Continuous-insulation codes, space constraints and premium façade designs therefore tilt toward XPS, lifting the polystyrene foam market trajectory in energy-efficient retrofits. DuPont’s AIM-Act-compliant boards and BASF’s sale of its Styrodur line to Karl Bachl sharpen product focus while facilitating capacity adds that sustain competitive intensity.

By End-User Industry:
Construction Leadership Amid DiversificationBuilding and construction applications generated 45.22% of the overall 2025 revenue. Code-mandated continuous insulation and geofoam fills in seismic regions keep the segment at the heart of polystyrene foam market demand. Energy savings of 15-30% in properly insulated buildings provide a clear payback despite higher upfront material spends.
Other applications, covering consumer electronics, appliances and niche modifiers for foamed concrete, lead future growth at 6.88% CAGR. Chinese subsidy programmes that moved 29.64 million consumers into replacement appliances in 2024 lifted styrene demand, indirectly bolstering polystyrene production. Protective shipping forms for smartphones and kitchen appliances reinforce this trend and cushion the polystyrene foam market against softness in food-service packaging.
Geography Analysis
APAC Polystyrene Foam Market
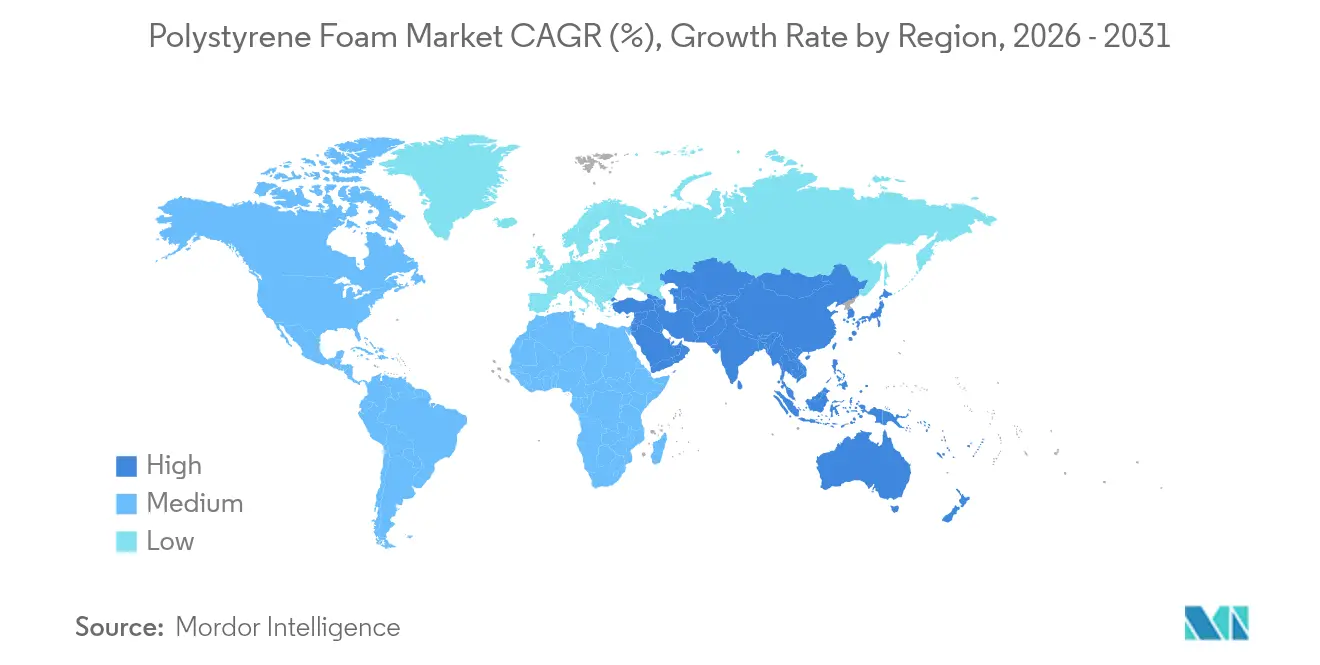
Asia-Pacific’s polystyrene foam market size topped USD 18.49 billion in 2025, equal to 43.12% of global value, and is predicted to post a 6.55% CAGR to 2031. China’s 35% slice of worldwide styrene imports drives resin availability, while appliance-replacement subsidies funnel additional EPS into packaging and insulation lines. India is on track to more than double nameplate capacity by 2028, with Styrenix Performance Materials and Supreme Petrochem riding robust consumer-electronics and automotive plastics demand.
North America Polystyrene Foam Market
North America retained a solid revenue base close to USD 10.21 billion in 2025. A string of producer price increases in 2024 signalled recovering construction demand, even as AIM-Act rules prompted fast reformulation to ultra-low-GWP blowing-agent systems. Government infrastructure spending and energy-retrofit incentives keep the region an important pillar of the polystyrene foam market.
Europe Polystyrene Foam Market
Europe accounted for roughly USD 7.63 billion and saw imports hit 400 kilotons in 2023 after older styrene units shut. The EU Packaging and Packaging Waste Regulation mandates full recyclability by 2030, spurring investments in depolymerisation and mechanically recycled EPS food-contact grades now under review. These transitions sustain domestic converters but tighten economic margins.
MEA and South America Polystyrene Foam Market
South America and the Middle East & Africa combined delivered slightly under USD 6.54 billion, with demand tied to road building, cold-chain start-ups and disposable-income growth. Lower regulation and expanding grocery e-commerce underpin first-wave EPS penetration, setting the stage for future XPS upgrades as code enforcement strengthens.
Value Chain Analysis
The value chain starts with upstream petrochemical feedstocks (benzene and ethylene) that convert to ethylbenzene and then styrene monomer, which makes resin economics closely tied to crude-linked and benzene-driven volatility. Polymer producers supply polystyrene resin and expandable grades, followed by foam converters that expand EPS bead into molded protective packaging and geofoam blocks, or extrude XPS insulation boards using blowing-agent systems. Given foam's high volume-to-weight ratio, conversion and fabrication are typically regional to limit freight and handling costs.
Downstream channels include building-material distributors, OEM packaging supply chains, and project-based civil engineering contractors. Logistics and trade exposure show up most clearly in Europe as styrenics supply tightens and import dependence rises, increasing lead-time risk for converters. Regulatory shifts in the United States also redirect volumes away from food-service uses and toward construction and specialty applications, where compliance is driven by energy codes, fire-safety system requirements, and insulation performance specifications.
Competitive Landscape
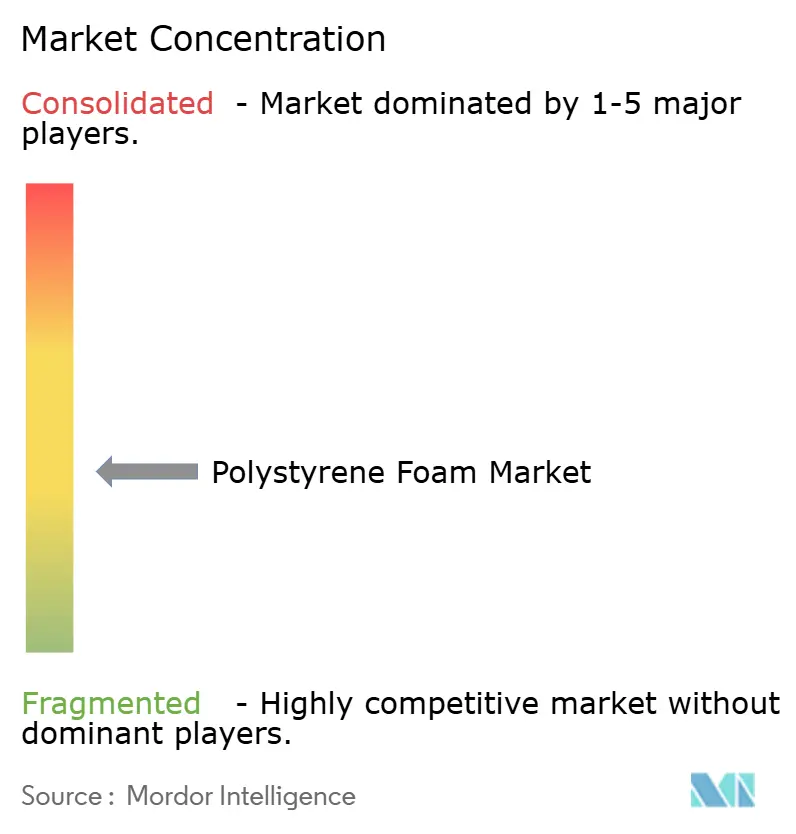
The polystyrene foam market is moderately fragmented. Technological advancements are driving differentiation. BASF’s Neopor Plus boards reduce cooling energy by 30% and earn LEED credits, while DuPont’s Styrofoam brand has adopted blowing agents that cut embodied carbon by 94%. Regional players like JSP Corporation focus on bead innovations for automotive applications, and Styrenix Performance Materials is expanding capacity to meet rising domestic demand in India.
Bio-based disruptors, though limited in volume, are influencing branding. Companies like Ecovative Design secure contracts for compostable mycelium packaging, prompting traditional players to invest in circular solutions and emphasize recyclability to maintain market share.
Polystyrene Foam Industry Leaders
-
Alpek S.A.B. de C.V.
-
BASF
-
INEOS Styrolution Group GmbH
-
Synthos
-
TotalEnergies
- *Disclaimer: Major Players sorted in no particular order
Polystyrene Foam Market Companies Covered in this Report
- Alpek S.A.B. de C.V.
- Atlas Molded Products
- BASF
- Epsilyte LLC
- INEOS Styrolution Group GmbH
- JSP
- KANEKA CORPORATION
- Kumho Petrochemical
- Owens Corning
- Styropek
- SUNPOR
- Synthos
- TotalEnergies
- Trinseo
- Versalis S.p.A.
- Wuxi Xingda foam plastic new material Limited
Market Opportunities and Future Outlook
Circularity and compliant packaging are creating scope for higher-value polystyrene foam offerings that can document recycled content and food-contact quality. The EU Packaging and Packaging Waste Regulation (PPWR) entered into force in February 2025 and starts applying from August 2026, pushing packaging supply chains toward harmonized labeling and stronger recyclability performance grading. That, in turn, supports investment in both mechanical recycling and depolymerisation routes that can return polystyrene to styrene monomer. A commercialization step is visible in May 2026, when Technip Energies and Agilyx launched TruStyrenyx, positioned to produce high-purity recycled styrene monomer and broaden the feedstock base beyond virgin styrene.
In construction, opportunities center on premium insulation where low-GWP and ozone-compliant blowing-agent systems are increasingly expected, supporting XPS upgrades and graphite-enhanced EPS adoption in thin-retrofit applications. Substitution pressure in food-service foams is also intensifying, highlighted by TotalEnergies Corbion's July 2026 launch of a PLA foam grade marketed as an alternative for polystyrene foam food packaging. Taken together, tighter packaging rules and alternative-material launches point toward higher-value EPS/XPS demand that couples insulation or protection performance with end-of-life pathways and traceability across regions.
Recent Industry Developments in Polystyrene Foam Market
- July 2026: TotalEnergies Corbion launched Luminy FOAM 50F, a high melt strength PLA grade positioned as a low-carbon circular alternative to polystyrene in foam food packaging. The introduction raises competitive pressure in single-use food-service formats where EPS faces bans, and it accelerates material substitution discussions. It also reinforces the need for polystyrene foam suppliers to differentiate through recyclability, collection, and food-contact quality pathways.
- September 2025: INEOS Styrolution reported receiving the first commercial-scale delivery of recycled styrene monomer from Indaver's depolymerisation plant in Antwerp, Belgium. The move advances chemical recycling as a viable feedstock source for styrenics, supporting brand owners and converters as they build circular-content claims without giving up polystyrene performance. It also signals closer coordination between waste processors and polymer producers in Europe.
- October 2024: BASF announced an investment to expand Neopor graphite-containing EPS capacity by 50,000 metric tons per year at Ludwigshafen, with startup targeted for early 2027. The expansion is aimed at higher-performance EPS insulation that enables thinner building envelopes and improved energy efficiency. It also points to a shift toward differentiated insulation grades as regulatory pressure reduces commodity food-service foam volumes.
Polystyrene Foam Market Report Scope and Research Methodology
Market Definition and Coverage
For this study, the polystyrene foam market is defined as revenue earned from selling polystyrene-based foam materials used mainly for insulation and protective packaging across major regions, measured at the point of sale for foam products.
Scope exclusions: We exclude non-foam polystyrene resins and most downstream converted goods where the value is largely from added processing rather than the foam itself.
Segments Covered in This Report
- By Type
- Expandable Polystyrene (EPS)
- Extruded Polystyrene (XPS)
- By End-User Industry
- Building and Construction
- Packaging
- Other End-User Industries (Consumer and Home Appliances, etc.)
- By Geography
- Asia-Pacific
- China
- Japan
- India
- South Korea
- Rest of Asia-Pacific
- North America
- United States
- Canada
- Mexico
- Europe
- Germany
- United Kingdom
- France
- Italy
- Rest of Europe
- South America
- Brazil
- Argentina
- Rest of South America
- Middle East and Africa
- Saudi Arabia
- South Africa
- Middle East and Africa
- Asia-Pacific
Data Sources, Market Sizing, and Validation
Desk Research
Desk research was used to build the first structure of the market, especially for mapping end uses, trade flows, and policy signals that directly impact insulation and packaging demand. We referred to public sources such as USGS for petrochemical and feedstock context, UN Comtrade for trade direction checks on plastics-related flows, and the International Energy Agency for building energy efficiency indicators that link with insulation consumption. For building activity and construction outlook, sources such as the World Bank and national statistics agencies were used to anchor macro demand drivers.
Along with these, we reviewed company annual reports, investor presentations, and reputable press coverage to understand capacity additions, plant utilization themes, and pricing commentary. Patent databases were also used to track shifts in foam formulations and blowing-agent related changes that can influence product mix between EPS and XPS. We also used paid subscriptions for company financials and news screening, and for shipment-level import and export checks where public trade codes were too broad. The sources listed above are illustrative and not exhaustive, since many other references were also consulted to collect data, validate assumptions, and clarify open questions.
Primary Interviews and Surveys
Primary work was done through expert interviews and structured surveys with manufacturers, converters, distributors, and large buyers in insulation and packaging, so that secondary assumptions could be corrected with real market behavior. We also spoke with industry participants across the major consuming regions to validate demand drivers such as construction cycles, cold-chain packaging needs, and regulation-led material substitutions. The respondent input was then used to confirm product mix, check whether price movement logic matched how firms actually pass through resin costs, and estimate the practical split between new build and renovation demand.
Distribution of primary research fieldwork respondents
| Company type | Respondent position | Region |
|---|---|---|
| Top tier: 34% | CXOs: 14% | APAC: 46% |
| Mid tier: 45% | Functional/Unit leaders: 42% | EMEA: 34% |
| Smaller Players: 21% | Managers: 44% | Americas: 20% |
Market-Sizing & Forecasting
The sizing model starts with a top-down build where construction and packaging demand pools are reconstructed by region, and then translated into foam consumption using penetration and intensity factors that were validated in interviews. For example, building floor area trends, insulation code tightening, and renovation activity are used to estimate insulation boards and panels demand, which is then converted into polystyrene foam value using typical density and price ranges. Packaging demand is similarly guided using indicators such as cold-chain expansion, appliance and electronics shipment trends, and protective packaging substitution patterns.
After the top-down totals are formed, we corroborate them with selective bottom-up checks using supplier roll-ups and channel checks, such as sampled average selling prices multiplied by estimated volumes for EPS and XPS, and sanity checks against announced capacity, operating rates, and trade direction signals. Where bottom-up detail is missing for smaller local players, gaps are handled through region-specific coverage ratios derived from distributor feedback and import reliance patterns, and then reviewed again during validation.
For forecasting, scenario analysis was used to reflect different paths for construction starts, insulation retrofits, and regulatory pressure on materials and blowing agents, and then one central case was selected based on the most consistent expert consensus. Variables that were tracked through the forecast include EPS versus XPS mix shifts, resin and energy cost pass-through behavior, construction output growth, packaging activity tied to appliances and cold chain, and regional price spreads driven by supply additions.
Data Validation & Update Cycle
Triangulation is done by comparing modeled market totals against independent signals such as construction output direction, capacity announcements, and observed price trends, and then checking whether the implied volumes remain realistic. When a region or segment shows a sharp jump that cannot be explained by a driver, we revisit assumptions and re-contact a small set of interviewees to confirm whether a demand shock, plant outage, or regulatory change is responsible.
Before sign-off, the model goes through multiple analyst review steps, including variance checks across regions and a consistency review between product mix, prices, and end-use shares. Reports are refreshed annually, and interim updates are completed when material events occur, such as large capacity additions, major policy changes affecting insulation, or a clear pricing regime shift. Right before delivery, we complete a final update pass using the latest public information and primary feedback so the output reflects the most recent market view.
Mordor Intelligence's Polystyrene Foam Market Sizing Compared With Other Published Estimates
Published market sizes for polystyrene foam do not always match because product boundaries and pricing points used in different models can differ, even when the topic name sounds the same. Differences also come from how authors treat recycled content, how they split EPS and XPS, and how frequently assumptions are refreshed when resin prices and construction activity move.
Converted packaging items and finished assemblies are often included by some publishers, but they sit outside Mordor Intelligence's scope, which keeps the count focused on EPS and XPS foam product value rather than broader fabricated goods. Other gaps typically come from using aggressive versus conservative price progression, mixing constant currency with current currency, or projecting demand from construction growth without checking insulation code impacts and renovation intensity at the regional level.
Benchmark comparison
| Source | Market Size | Gaps in Research Methodology |
|---|---|---|
| Mordor Intelligence | USD 44.98 B (2026) | |
| Global Consultancy A | USD 47.60 B (2026) | This estimate appears to include a wider converted-packaging and fabricated-foam value layer, which lifts revenue beyond foam product sales, and it also assumes a faster near-term price pass-through. |
| Industry Association B | USD 41.20 B (2025) | This figure is closer to resin-to-foam producer revenue in selected member regions, which can understate informal supply and some non-member volumes, and it is also reported for a different base year. |
Overall, the spread is mainly explained by what is counted as foam market value, where the pricing point is taken, and whether the year being quoted is aligned. By tying the total to clear demand drivers like insulation intensity and packaging activity, and then cross-checking with supply and price signals, the benchmark total stays traceable and repeatable.
Key Questions Answered in the Report
What is the current Polystyrene Foam Market size?
The polystyrene foam market size reached USD 44.98 billion in 2026 and is forecast to grow steadily at a 4.92% CAGR during 2026-2031.
Which product type leads the polystyrene foam market?
Expanded polystyrene dominates with 61.43% share in 2025, while extruded polystyrene is the faster-growing segment at 6.22% CAGR through 2031.
Why is Asia-Pacific crucial for future growth?
The region holds 43.12% revenue share and posts the highest 6.55% CAGR to 2031, driven by China’s styrene demand and India’s capacity expansions.
How are producers addressing sustainability pressures?
Companies are reformulating blowing agents to ultra-low-GWP levels, commercialising graphite-enhanced EPS, investing in mechanical and chemical recycling, and exploring bio-based alternatives to meet circular-economy mandates.