
Polyphenol Market Size and Share
Market Overview
| Study Period | 2021 - 2031 |
|---|---|
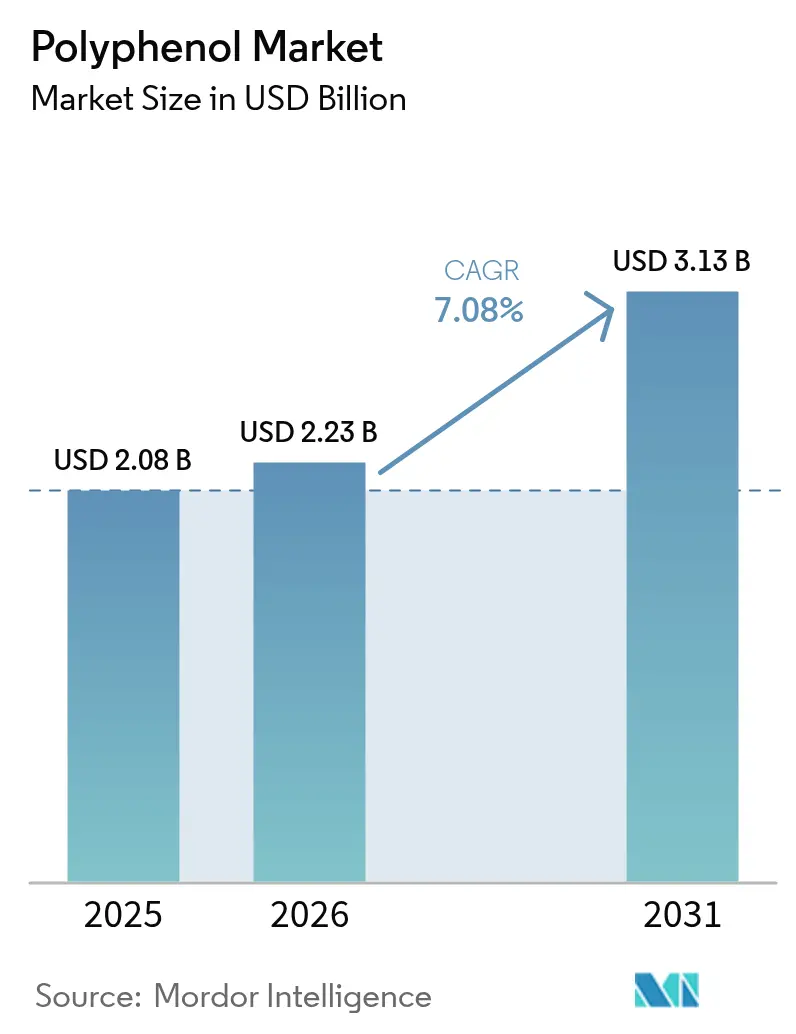
| Market Size (2026) | USD 2.23 Billion |
| Market Size (2031) | USD 3.13 Billion |
| Growth Rate (2026 - 2031) | 7.08 % |
| Fastest Growing Market | Asia Pacific |
| Largest Market | Europe |
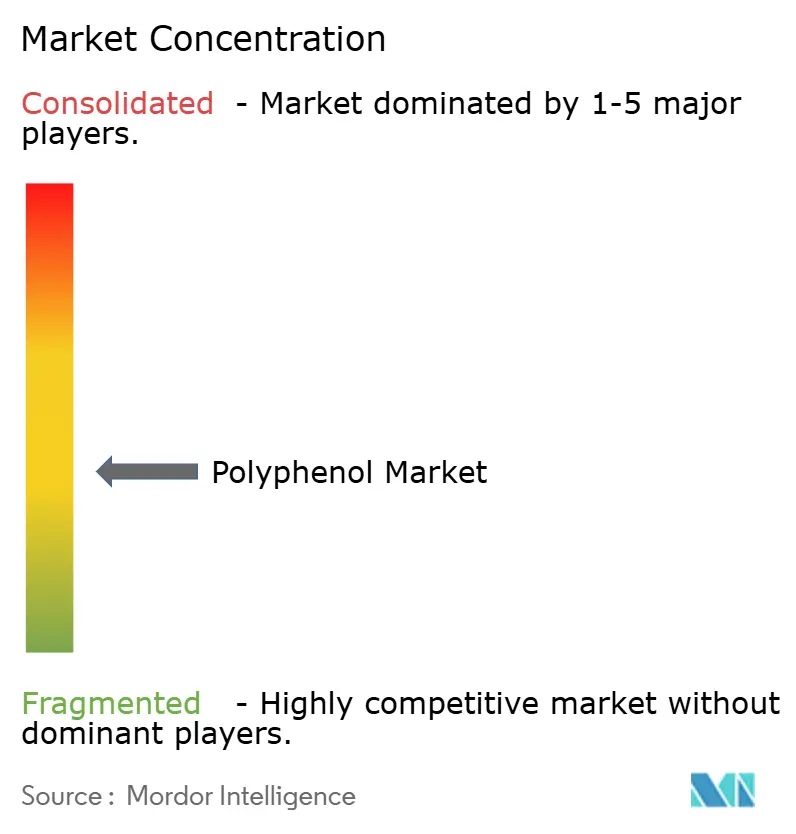
| Market Concentration | Medium |
Major Players *Disclaimer: Major Players sorted in no particular order Image © Mordor Intelligence. Reuse requires attribution under CC BY 4.0. | |
Polyphenol Market Analysis by Mordor Intelligence
The polyphenol market size in 2026 is estimated at USD 2.23 billion, growing from 2025 value of USD 2.08 billion with 2031 projections showing USD 3.13 billion, growing at 7.08% CAGR over 2026-2031. This growth trajectory reflects the market's maturation beyond traditional antioxidant applications, driven by breakthrough encapsulation technologies that address the fundamental bioavailability challenge that has historically limited polyphenol efficacy in consumer products. These advancements tackle the bioavailability challenges that have long hindered the effectiveness of polyphenols in consumer products. The FDA's 2028 rollout of updated "healthy" food labeling criteria, as highlighted by the U.S. Department of Health and Human Services [1] , is set to open new avenues for polyphenol-enhanced products. This regulatory shift, coupled with a surge in demand for functional beverages and nutricosmetics, underscores the market's evolution. Furthermore, firms are not just racing to innovate; they're also investing in sustainable extraction methods from waste streams, bolstering supply resilience and mitigating input risks. Early adopters are setting themselves apart with proprietary nano-delivery systems, ensuring traceability through vertical integration, and swiftly adapting to the tightening "healthy" labeling regulations across the U.S., Canada, and the EU. The Asia-Pacific region, buoyed by a burgeoning middle class and governmental pushes for self-sufficiency in nutraceuticals, promises a significant long-term growth trajectory for the polyphenol market.
Key Report Takeaways
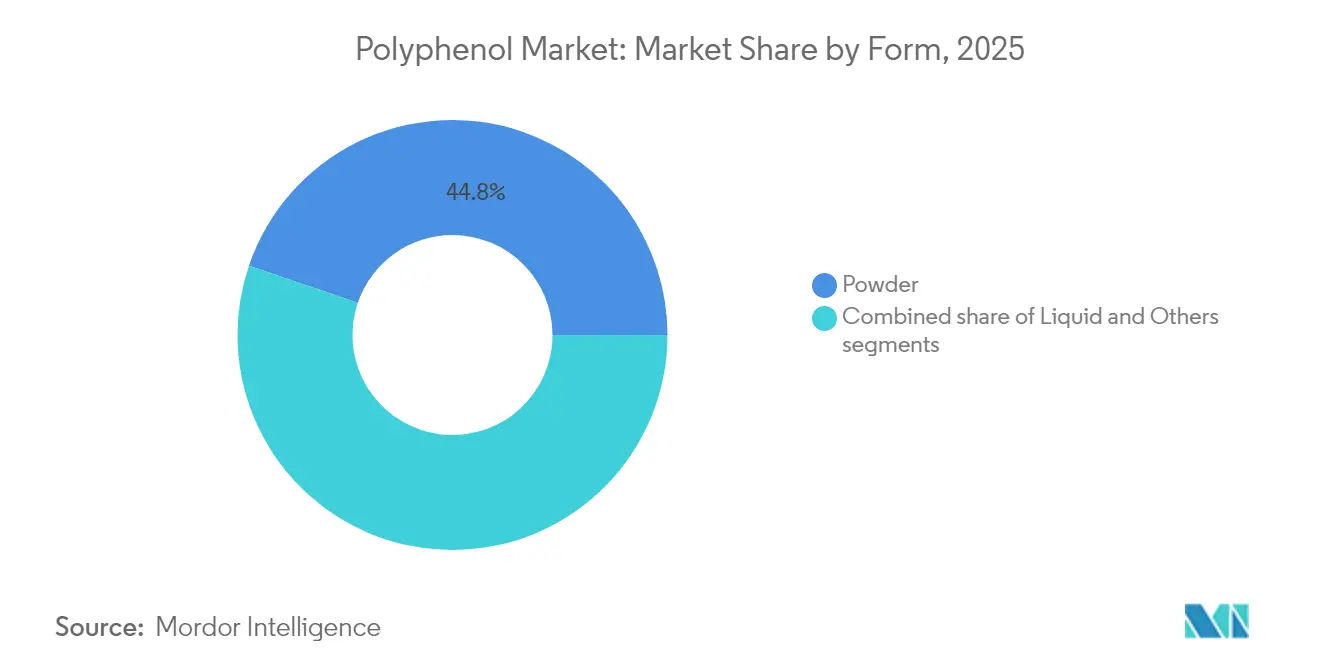
- By form, powders led with 44.78% of polyphenol market share in 2025, whereas liquids are poised for the fastest 8.08% CAGR through 2031.
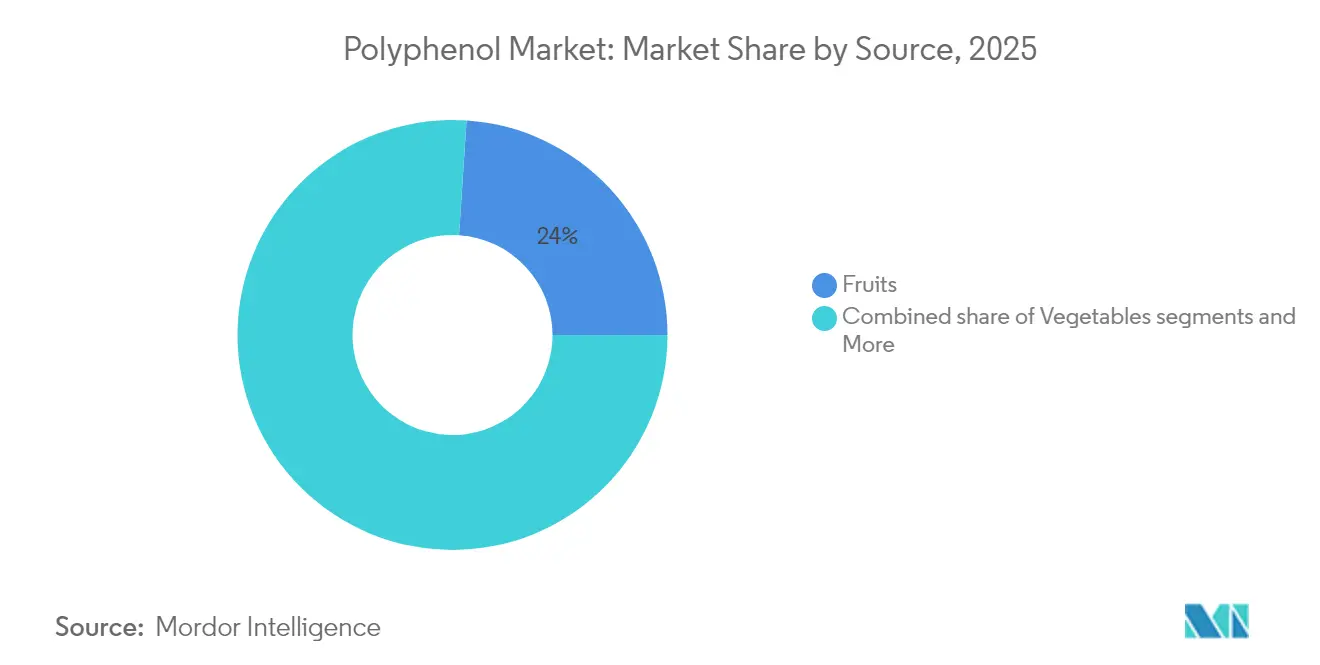
- By source, fruits held 23.96% of the polyphenol market in 2025, while the vegetables category, built around seaweed and agricultural residues, is set to rise at an 8.48% CAGR.
- By application, dietary supplements dominated with 32.96% contribution to the polyphenol market size in 2025; cosmetics and personal care is projected to outpace all other uses at an 8.63% CAGR to 2031.
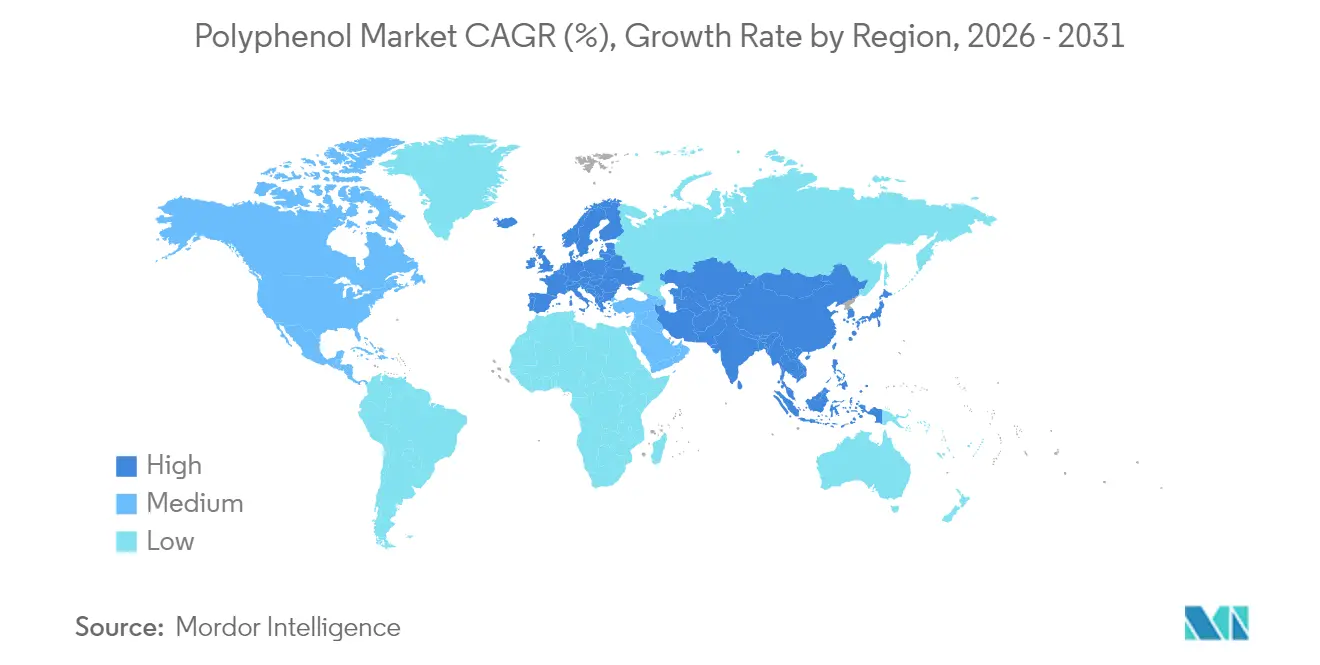
- By geography, Europe held 33.88% of the polyphenol market in 2025, while the Asia-Pacific is set to rise at an 8.22% CAGR.
Note: Market size and forecast figures in this report are generated using Mordor Intelligence’s proprietary estimation framework, updated with the latest available data and insights as of 2026.
Market Trends and Insights
Drivers Impact Analysis of Polyphenol Market*
| DRIVER | (~) % IMPACT ON CAGR FORECAST | GEOGRAPHIC RELEVANCE | IMPACT TIMELINE |
|---|---|---|---|
| Rising popularity of natural antioxidants in dietary supplements | +1.8% | Global; strongest in North America and Europe | Medium term (2-4 years) |
| Growing awareness of anti-inflammatory and cardiovascular benefits | +1.5% | Global; pronounced in Asia-Pacific aging cohorts | Long term (≥ 4 years) |
| High demand for plant-based ingredients in cosmetic formulations | +1.2% | Europe and North America, expanding to Asia-Pacific | Short term (≤ 2 years) |
| Shifting consumer preferences toward organic and clean labels | +1.0% | North America and Europe core; urban Asia-Pacific spillover | Medium term (2-4 years) |
| Innovation in polyphenol extraction and encapsulation technologies | +0.9% | Global; research and development centered in developed markets | Long term (≥ 4 years) |
| Polyphenols as natural food preservatives | +0.8% | Global; regulatory scope varies | Medium term (2-4 years) |
| Source: Mordor Intelligence | |||
Rising popularity of natural antioxidants in dietary supplements
The dietary supplement industry's pivot toward natural antioxidants is reshaping polyphenol demand patterns, with manufacturers increasingly positioning these compounds as scientifically-validated alternatives to synthetic antioxidants. Recent research demonstrates that polyphenol-rich extracts exhibit dose-dependent efficacy, with optimal consumption levels varying significantly based on individual metabolic profiles. This personalized nutrition approach is driving premium product development, as companies recognize that standardized dosing fails to maximize therapeutic potential. Regulatory clarity is accelerating adoption, with the FDA's 75-day premarket notification system providing clearer pathways for polyphenol-based dietary ingredients [2]. The shift toward evidence-based marketing is compelling manufacturers to invest in clinical trials, creating a competitive advantage for companies with robust research capabilities. Additionally, the rising consumer awareness of the health benefits associated with polyphenols is further fueling market growth. The increasing prevalence of chronic diseases, such as cardiovascular disorders and diabetes, is also driving demand for polyphenol-enriched products.
Growing awareness of anti-inflammatory and cardiovascular benefits
Cardiovascular health applications are emerging as a primary growth driver, with polyphenols demonstrating measurable impacts on heart failure and cardiac hypertrophy through multiple molecular pathways. Clinical evidence shows polyphenols regulate heart failure-related molecules, prevent mitochondrial dysfunction, and improve lipid profiles, positioning them as viable alternatives to pharmaceutical interventions. The Mediterranean diet's association with longevity has elevated olive polyphenols specifically, with hydroxytyrosol and oleuropein showing promise in mitigating neurological complications associated with COVID-19. Nano-drug delivery methods are addressing bioavailability limitations that have historically constrained therapeutic applications, enabling more precise dosing and enhanced treatment outcomes. The aging global population is driving demand for preventive healthcare solutions, with polyphenols positioned as accessible interventions for age-related cardiovascular decline. Regulatory bodies are increasingly recognizing cardiovascular health claims, with the FDA's Significant Scientific Agreement standard providing pathways for validated health claims
High demand for plant-based ingredients in cosmetic formulations
The convergence of food and cosmetics industries is creating unprecedented opportunities for polyphenol applications, driven by consumer demand for "nutricosmetics" that deliver beauty benefits from within. This trend reflects a fundamental shift in consumer perception, where beauty products are increasingly viewed as extensions of health and wellness regimens rather than purely aesthetic solutions. Polyphenols' antioxidant and anti-inflammatory properties make them ideal for addressing skin aging, with formulations increasingly incorporating food-derived compounds to enhance efficacy and consumer appeal. The sustainability narrative is particularly compelling, as cosmetic manufacturers leverage food industry byproducts to create eco-friendly formulations that resonate with environmentally conscious consumers. Regulatory advantages favor plant-based ingredients, as natural compounds face fewer restrictions compared to synthetic alternatives, enabling faster product development cycles. As consumers become more discerning, the demand for transparency in ingredient sourcing and formulation processes has surged, pushing brands to prioritize clarity in their marketing.
Shifting consumer preferences toward organic and clean labels
Clean-label positioning has become a competitive necessity rather than a differentiation strategy, with consumers increasingly scrutinizing ingredient lists and demanding transparency in product formulations. This shift is particularly pronounced in developed markets, where regulatory frameworks support organic certification and clean-label claims, creating market premiums for compliant products. The functional beverages sector is experiencing rapid growth as manufacturers respond to consumer demand for natural ingredients with recognizable health benefits. Polyphenols' natural origin and established safety profiles position them advantageously against synthetic alternatives, particularly as regulatory scrutiny of artificial additives intensifies. The plant-based food market's challenges with taste and texture are driving innovation in polyphenol applications, as these compounds can enhance both nutritional profiles and sensory characteristics. Supply chain transparency is becoming increasingly important, with consumers demanding traceability from source to shelf, creating opportunities for vertically integrated polyphenol producers.
Restraints Impact Analysis of Polyphenol Market*
| RESTRAINT | (~) % IMPACT ON CAGR FORECAST | GEOGRAPHIC RELEVANCE | IMPACT TIMELINE |
|---|---|---|---|
| Low bioavailability of polyphenols in native form | -1.5% | Global, with varying regulatory responses | Medium term (2-4 years) |
| High cost of extraction and purification processes | -1.2% | Global, with cost pressures highest in price-sensitive markets | Short term (≤ 2 years) |
| Limited shelf stability in end-product application | -1.7% | Global, especially in Asia-Pacific and North America | Short term (≤ 2 years) |
| Bitterness and astringency affecting broader consumer appeal | -1.4% | Global, with more impact on Asia-Pacific | Medium term (2-4 years) |
| Source: Mordor Intelligence | |||
Low bioavailability of polyphenols in native form
The bioavailability challenge represents the most significant technical barrier to polyphenol market expansion, with native forms demonstrating limited absorption and rapid degradation that constrains therapeutic efficacy. Research indicates that polyphenol bioavailability varies significantly due to chemical structure and individual metabolism, with daily intake estimated at approximately 1 gram but actual absorption rates remaining disappointingly low. This limitation has historically prevented polyphenols from achieving pharmaceutical-grade applications, relegating them to nutraceutical and functional food categories with less stringent efficacy requirements. Advanced delivery systems, including nanoencapsulation and targeted formulations, are emerging as solutions, but these technologies add significant cost and complexity to product development. The challenge is particularly acute in liquid formulations, where polyphenol stability is compromised by environmental factors including pH, temperature, and light exposure. Regulatory bodies are increasingly demanding bioavailability data to support health claims, creating additional compliance burdens for manufacturers seeking to market polyphenol-based products with therapeutic positioning.
High cost of extraction and purification processes
Production cost pressures are constraining market growth, particularly in price-sensitive segments where polyphenol premiums cannot be justified by consumer willingness to pay. Conventional extraction methods require significant energy inputs and solvent consumption, while advanced techniques like supercritical fluid extraction demand substantial capital investment that many smaller producers cannot afford. The challenge is compounded by raw material variability, with polyphenol content fluctuating based on source quality, seasonal factors, and processing conditions, creating supply chain inefficiencies that increase production costs. Purification requirements for pharmaceutical and high-end cosmetic applications demand additional processing steps that further escalate costs, limiting market accessibility for price-conscious consumers. Economies of scale remain elusive for many polyphenol producers, as market fragmentation prevents the volume consolidation necessary to achieve cost-competitive production. The sustainability imperative is adding complexity, as environmentally responsible extraction methods often carry premium costs that must be absorbed by manufacturers or passed to consumers.
*Our forecasts treat driver/restraint impacts as directional, not additive. The impact forecasts reflect baseline growth, mix effects, and variable interactions.
Polyphenol Market Segment Analysis
By Form:
Powder Dominance Challenged by Liquid InnovationPowder formulations maintain market leadership with 44.78% share in 2025, driven by superior stability profiles and cost-effective manufacturing processes that enable broad commercial adoption across dietary supplements and functional food applications. The established supply chain infrastructure for powder handling provides logistical advantages, while extended shelf life reduces inventory risks for manufacturers and retailers. However, liquid formulations are experiencing the fastest growth at 8.08% CAGR through 2031, reflecting breakthrough innovations in stabilization technologies and consumer preference for convenient, ready-to-consume formats.
Liquid polyphenol products are gaining traction in the functional beverages, where manufacturers are leveraging advanced encapsulation techniques to overcome traditional stability challenges. The "Others" category, encompassing innovative delivery formats like gummies and fortified foods, represents emerging opportunities as manufacturers explore novel applications to differentiate their offerings. Microencapsulation technology is enabling powder formulations to achieve enhanced bioavailability while maintaining cost advantages, with spray drying and emulsion-based methods becoming industry standards. The convergence of form and function is creating hybrid products that combine the stability of powders with the convenience of liquids, positioning the market for continued innovation in delivery mechanisms.

By Application:
Supplements Lead While Cosmetics AccelerateIn 2025, dietary supplements command a dominant 32.96% share of the polyphenol market, bolstered by regulatory frameworks endorsing health claims and a growing consumer trust in polyphenols as scientifically-backed wellness agents. This segment reaps the rewards of well-established distribution channels and savvy marketing strategies that spotlight preventive healthcare benefits. Meanwhile, the cosmetics and personal care sector emerges as the fastest-growing application, boasting an impressive 8.63% CAGR through 2031. This surge is fueled by the rising nutricosmetics trend and a consumer shift towards natural ingredients celebrated for their antioxidant prowess. As consumers increasingly prioritize health and wellness, the demand for polyphenol-infused products is set to soar, further solidifying their market position.
Functional foods and beverages are experiencing steady growth as manufacturers incorporate polyphenols to enhance nutritional profiles and support clean-label positioning. The berry beverage market illustrates this trend, with products leveraging natural sweetness and bioactive compounds to address diabetes management and weight control applications. Animal feed applications remain niche but show potential as livestock producers seek natural alternatives to synthetic additives for improving animal health and product quality. The convergence of applications is creating cross-category opportunities, with companies developing polyphenol ingredients that serve multiple end-use markets simultaneously. Regulatory harmonization across applications could accelerate growth, as standardized safety assessments and health claim procedures reduce market entry barriers for innovative polyphenol products.
By Source:
Fruit Leadership Faces Waste Stream DisruptionFruits command the largest source segment with 23.96% market share in 2025, benefiting from established extraction infrastructure and consumer familiarity with fruit-derived health benefits. Traditional sources like grapes, berries, and citrus fruits continue to dominate due to well-documented polyphenol profiles and regulatory approval for health claims. As the market matures, there's a growing emphasis on educating consumers about lesser-known fruits, potentially broadening the market's scope. Vegetable sources are gaining momentum, growing at a CAGR of 8.48% during the forecast years as manufacturers recognize the untapped potential of processing byproducts, with fruit and vegetable waste representing supply chain losses that can be converted into valuable polyphenol extracts. The increasing demand for clean-label and natural ingredients in food and beverages further supports the dominance of fruit-derived polyphenols.
However, the other category is expanding through 2031, driven by innovative utilization of agricultural waste streams and exploration of novel sources like seaweed and industrial byproducts. The circular economy imperative is driving investment in waste valorization technologies, with companies developing sustainable extraction methods that transform agricultural residues into high-value polyphenol ingredients. As industries grapple with waste management challenges, the push towards valorization not only addresses environmental concerns but also opens new revenue streams. Additionally, partnerships between agricultural producers and tech firms are becoming commonplace, accelerating the development and adoption of these sustainable extraction methods. The growing interest in plant-based diets is further encouraging the exploration of alternative polyphenol sources.
Geography Analysis
Europe Polyphenol Market
Europe holds 33.88% of the market share, supported by stringent regulatory standards that favor natural ingredients and comprehensive sustainability initiatives that align with polyphenol production from agricultural waste streams. The European Commission'sinvestment in seaweed polyphenol research illustrates regional commitment to innovative applications, with projects demonstrating commercial viability in both dietary supplements and personal care products. Germany's leadership in plant-based innovation and the UK's post-Brexit regulatory flexibility are creating competitive advantages for polyphenol producers.
APAC Polyphenol Market
Asia-Pacific emerges as the fastest-growing region through 2031 with a CAGR of 8.22%, with China and India driving demand through expanding middle classes and increasing health consciousness. The Indian nutraceutical market reached USD 6.1 billion in 2023 with 11.4% projected growth, creating substantial opportunities for polyphenol-based dietary supplements, according to Protein Foods and Nutrition Development Association of India. Japan's aging population and advanced regulatory framework for functional foods position the country as a premium market for innovative polyphenol applications.
North America Polyphenol Market
North America maintains regional market leadership in 2024, driven by established dietary supplement infrastructure and consumer willingness to pay premiums for scientifically-validated health ingredients. The region benefits from clear regulatory frameworks that support health claims, with the FDA's updated "healthy" food labeling criteria creating new opportunities for polyphenol-fortified products. Canada's significant government investment in plant-based research and the U.S. biomass supply chain initiative are creating favorable conditions for polyphenol market expansion.
Note: Segment shares of all Individual segments will be available upon report purchase
Regulatory Landscape
Regulation for polyphenols remains split between ingredient safety pathways and claims controls, with increasing scrutiny on botanicals used in foods, dietary supplements, and cosmetics. In the United States, polyphenol ingredients typically rely on GRAS positioning and related FDA compliance processes. In 2026, the FDA Human Foods Program listed a proposed rule to require submission of GRAS notices for all new substances claimed to be GRAS, raising the documentation bar for new polyphenol extracts and delivery systems. Ingredient suppliers also continue to use the FDA GRAS Notice Inventory as a practical compliance reference point for specific botanical-derived extracts.
In Europe, the regulatory burden concentrates on health-claim substantiation and authorization under the Nutrition and Health Claims framework. The Court of Justice of the European Union ruled in Case C-386/23 (2025) that health claims for botanical substances cannot be used in commercial advertising without prior authorization, even when claims sit in a pending evaluation context. This narrows go-to-market options for polyphenol-enriched foods and supplements. Parallel to claims enforcement, EFSA activity continues to influence data expectations for botanicals, including EFSA NDA Panel opinions on olive oil polyphenol-related claims and the EFSA Scientific Committee consultation (June to August 2026) on draft cross-sectoral guidance for botanical safety assessment across the food and feed chain.
Value Chain Analysis
The polyphenol value chain starts with biomass sourcing from fruit and byproducts such as grapes, berries, and citrus peels, pomace, and seeds, followed by preprocessing (drying, milling, stabilization), extraction, purification and standardization, and formulation into powders, liquids, and encapsulated systems for end uses across dietary supplements, functional foods and beverages, and cosmetics and personal care. Downstream, ingredient distributors and contract manufacturers blend polyphenols into branded products, where quality control, traceability, and claim substantiation requirements shape supplier selection and long-term contracts.
Anchor: In 2026, EU and national programs accelerate valorization of agro-industrial residues under the Circular Economy Action Plan, with funding directed at improving extraction yields and reducing waste in Spain, Italy, and Greece. This reinforces supply security and sustainability narratives across Europe and North America.
Competitive Landscape
The polyphenol market exhibits moderate fragmentation, indicating significant consolidation opportunities as established players seek to capture market share through strategic acquisitions and vertical integration. Competition intensity remains manageable due to technical barriers in extraction and purification processes, which create natural moats for companies with proprietary technologies and established supply chains. Major players in the market include Cargill, Incorporated, Givaudan SA, International Flavors & Fragrances Inc., and DSM-Firmenich AG.
Opportunities abound in emerging sectors such as animal feed and industrial preservatives, where polyphenols stand poised to supplant synthetic alternatives, all while aligning with sustainability mandates. Notably, patent activity surrounding nano-formulations and delivery systems underscores a robust research and development investment trend, with firms pioneering proprietary encapsulation technologies to tackle bioavailability challenges. The growing demand for natural and clean-label products further drives the adoption of polyphenols in these applications. Additionally, the increasing awareness of the environmental impact of synthetic chemicals is pushing industries to explore sustainable alternatives like polyphenols.
As technology adoption emerges as a pivotal competitive edge, firms boasting advanced extraction methods are reaping benefits: heightened yields, superior product quality, and diminished production costs. Borregaard's biorefinery model serves as a testament, showcasing how businesses harness sustainable production techniques to carve out advantages in eco-aware markets. Companies investing in innovative extraction technologies are also better positioned to meet the rising demand for high-purity polyphenols. Furthermore, collaborations between industry players and research institutions are accelerating the development of cost-effective and scalable production methods.
Polyphenol Industry Leaders
-
Botanic Healthcare
-
Givaudan SA
-
International Flavors and Fragrances (IFF)
-
A. Holliday and Company Inc.
-
DSM-Firmenich AG
- *Disclaimer: Major Players sorted in no particular order
Polyphenol Market Companies Covered in this Report
- Botanic Healthcare
- Givaudan SA
- International Flavors and Fragrances (IFF)
- A. Holliday and Company Inc.
- DSM-Firmenich AG
- MB-Holding GmbH and Co KG
- Indena SpA
- YARROW CHEM PRODUCTS
- Fengchen Group Co.,Ltd
- Lyan Natural Ingredients
- Sami-Sabinsa Group
- Kemin Industries, Inc.
- TOKIWA PHYTOCHEMICAL CO.,LTD.
- Zibo Anquan Chemical Co., Ltd.
- Taiyo International
- Vidya Pvt. Ltd.
- Botaniex, Inc.
- Biolink Group (Polyphenols AS)
- Groupe GRAP'SUD (Grapsud)
- ProviNord Group (Alsiano)
Market Opportunities and Future Outlook
Encapsulation and advanced delivery systems are a core whitespace area because they address polyphenols' stability and bioavailability limitations across beverages, functional foods, and nutricosmetics. Commercial formulation toolkits now emphasize microencapsulation, complex coacervation, and nano-emulsification to reduce degradation from pH, temperature, and light, while improving taste management and controlled release in complex matrices. This creates differentiation room for ingredient suppliers and brand owners through validated performance, particularly as evidence-based marketing and health-claim requirements tighten.
Capacity additions and greener processing are another opportunity track as customers seek high-purity, clean-label extracts with more consistent supply. In February 2026, HealthTech BioActives (HTBA) announced a EUR 6 million investment in a new plant at its Murcia, Spain center to increase diosmin production capacity by more than 40%, reflecting continued investment in dedicated polyphenol-related manufacturing and cleaner production approaches. Separately, circular-economy sourcing from agro-industrial residues, such as citrus peels and pomace streams, supports both cost and sustainability narratives, aligning with brand requirements for traceability and waste valorization in Europe and North America.
Recent Industry Developments in Polyphenol Market
- June 2026: Botanic Healthcare announced plans to launch new men's health ingredient innovations, expanding its botanical portfolio beyond traditional beauty-from-within positioning. The initiative targets a demographic segment that ingredient suppliers increasingly treat as under-served, supporting new product development pipelines for polyphenol-adjacent actives with clearer consumer benefit framing.
- April 2025: International Flavors and Fragrances (IFF) opened a 30,000 square foot Citrus Innovation Center in Lakeland, Florida, in partnership with Florida Polytechnic University. The center strengthens botanical R&D and application development capabilities tied to citrus-derived ingredients, supporting faster translation of extraction and formulation work into food, beverage, and wellness launches.
- December 2024: The US Food and Drug Administration finalized updated healthy nutrient content claim criteria, with implementation scheduled for February 2028. This finalized timeline pushed brands and ingredient suppliers to reassess product reformulation and substantiation strategies, including how polyphenol-fortified foods and beverages can fit into future on-pack positioning.
Polyphenol Market Report Scope and Research Methodology
Market Definition and Coverage
This market covers revenues earned from polyphenols sold as ingredients, whether they are supplied in liquid or powder form, and used in applications such as foods, supplements, beverages, animal feed, and personal care. The sizing is done at a global level and then reconciled across major regions.
Scope exclusions: We exclude finished consumer products where polyphenols are only an embedded component, and we also exclude non-commercial or purely research-grade laboratory use.
Segments Covered in This Report
- By Form
- Liquid
- Powder
- Others
- By Source
- Fruits
- Vegetables
- Cocoa
- Others
- By Application
- Functional Foods
- Beverages
- Dietary Supplements
- Animal Feed
- Cosmetics and Personal Care
- Others
- By Geography
- United States
- Canada
- Mexico
- Rest of North America
- Europe
- United Kingdom
- Germany
- Spain
- France
- Italy
- Russia
- Rest of Europe
- Asia-Pacific
- China
- India
- Japan
- Australia
- Rest of Asia-Pacific
- South America
- Brazil
- Argentina
- Rest of South America
- Middle East and Africa
- Saudi Arabia
- South Africa
- Rest of Middle East and Africa
- United States
Data Sources, Market Sizing, and Validation
Desk Research
Desk research started with building a clean demand and supply view for polyphenols, then aligning terminology across form factors, source materials, and end-use pull. We used public references such as FDA labeling and ingredient guidance, the USDA food composition and agricultural statistics series, UN Comtrade trade flows for relevant extracts and ingredient categories, and peer-reviewed journals that discuss extraction yields, stability, and bioavailability. We also reviewed company annual reports, investor decks, and reputable press coverage to understand capacity additions, sourcing changes, and portfolio emphasis.
To make the model operational, a paid subscription for company financials and intelligence was used selectively to map operating footprints, ownership links, and broad revenue disclosures, and then the figures were treated as directional checks rather than direct inputs. Patent databases were also used to identify areas where encapsulation or extraction methods are being improved, since that can affect average selling price movement over time. The sources listed here are illustrative only, and other public references were used for clarification, cross-checking, and final validation.
Primary Interviews and Surveys
Primary work focused on speaking with ingredient suppliers, distributors, contract manufacturers, and downstream buyers who specify polyphenol content for product formulations. The discussions were used to validate typical price bands by form, confirm how sourcing from fruits, vegetables, and cocoa affects availability, and stress-test adoption assumptions across APAC, EMEA, and the Americas. When responses conflicted on a point, we re-checked outliers with follow-up calls to reduce the risk of biased inputs.
Distribution of primary research fieldwork respondents
| Company type | Respondent position | Region |
|---|---|---|
| Top tier: 32% | CXOs: 16% | APAC: 46% |
| Mid tier: 51% | Functional/Unit leaders: 37% | EMEA: 35% |
| Smaller Players: 17% | Managers: 47% | Americas: 19% |
Market-Sizing & Forecasting
The core sizing logic uses top-down modeling, where we reconstruct the value pool by starting from ingredient demand in key end uses and then applying penetration and usage-rate assumptions for polyphenol enriched formulations. After that first view is built, results are corroborated with selective bottom-up approximations, such as sampled supplier sell-out discussions, distributor channel checks, and volume-by-price sanity checks by form (liquid versus powder), which are used to adjust totals where gaps show up.
Key inputs used in the model include application mix shifts (functional foods, supplements, beverages, feed, and personal care), typical inclusion rates for polyphenol ingredients, changes in extraction yields and raw material availability by source, average selling price movement by form and purity expectations, and regional consumption signals that align with health and wellness product launches. For forecasting, we rely mainly on scenario analysis, since near-term pricing and adoption can change with raw material cycles and product reformulation decisions. These scenarios are anchored to what interviewees expect for capacity, sourcing, and demand momentum. Where bottom-up checks are incomplete, for example smaller local suppliers with limited disclosures, we use conservative assumptions and keep them bounded by trade signals and regional demand indicators.
Data Validation & Update Cycle
Validation is done through multiple checks so that one data stream does not drive the full outcome. We compare outputs with independent signals such as trade movement direction, stated capacity changes, and observed price ranges, and then investigate sharp variance by re-reading assumptions at the region and application level. Before sign-off, the model and write-up go through analyst reviews, and re-contact is triggered when primary responses conflict on a key metric like inclusion rate or typical pricing.
The report is refreshed annually, and interim updates are made when material events occur, such as large capacity expansions, major regulatory shifts tied to claims, or a clear step change in raw material availability. Right before delivery, we run a final review pass so the figures reflect the most recent confirmed information.
Mordor Intelligence's Polyphenol Market Size Compared With Other Published Estimates
Published market numbers for polyphenols can vary even when the topic label appears to match, because the included ingredient types, treatment of adjacent phytonutrients, and the year used for sizing are not always aligned. Differences also come from how each model turns usage assumptions into revenue, particularly when pricing differs widely by source and form.
The table shows a tighter cluster around the mid-2020s, but it also highlights a meaningful spread that is usually driven by scope and year selection, followed by pricing logic and refresh timing. Some estimates appear to include broader plant extract revenues or count portions of finished product value, while others rely heavily on a single base year and extrapolate using a uniform CAGR even as form mix and purity expectations change.
Benchmark comparison
| Source | Market Size | Gaps in Research Methodology |
|---|---|---|
| Mordor Intelligence | USD 2.23 B (2026) | |
| Global Consultancy A | USD 2.07 B (2025) | Uses a different base year and may apply a broader ingredient basket across plant extracts, which can shift totals when mapped back to polyphenols only. |
| Industry Publisher B | USD 1.42 B (2025) | Shows a lower starting value that can occur when only selected sources and mainstream food and supplement demand are counted, with more conservative price bands for higher-purity grades. |
The spread is easier to explain when the year and counted revenue pool are made explicit, then checked against realistic usage and pricing by form and application. The table shows that in Mordor Intelligence's model, revenues are counted at the ingredient level across functional foods, dietary supplements, beverages, animal feed, and personal care, rather than attributing value from finished products. This keeps the total more traceable to demand indicators and makes the cross-checks repeatable.
Key Questions Answered in the Report
What is the current value of the polyphenol market?
The polyphenol market size is valued at USD 2.23 billion in 2026 and is projected to reach USD 3.13 billion by 2031.
Which segment holds the largest share of the polyphenol market?
Powder formulations lead with 44.78% of global polyphenol market share, owing to their stability and cost efficiency.
Why are encapsulation technologies important for polyphenols?
Encapsulation boosts bioavailability and stability, enabling polyphenols to perform effectively in beverages, supplements, and cosmetics.
Which region is expected to witness the highest growth?
Asia-Pacific is the fastest-growing region through 2031 with a CAGR of 8.22%, propelled by expanding middle-class consumers in China and India and supportive functional-food regulations.