| Study Period | 2017 - 2029 |
| Base Year For Estimation | 2023 |
| Forecast Data Period | 2024 - 2029 |
| Market Size (2024) | USD 5.46 Billion |
| Market Size (2029) | USD 7.60 Billion |
| CAGR (2024 - 2029) | 6.83 % |
| Market Concentration | Low |
Major Players*Disclaimer: Major Players sorted in no particular order |
 Market Size")
Polyimides (PI) Market Analysis
The Polyimides (PI) Market size is estimated at 5.46 billion USD in 2024, and is expected to reach 7.60 billion USD by 2029, growing at a CAGR of 6.83% during the forecast period (2024-2029).
The polyimide industry is experiencing significant transformation driven by technological advancements and changing consumer preferences. The surge in digitalization and remote working culture has catalyzed unprecedented demand for electronic devices, with global consumer electronics revenue projected to reach USD 1103 billion in 2023. This shift has prompted manufacturers to focus on developing high-performance materials capable of meeting the stringent requirements of modern electronic devices. The integration of advanced technologies like 5G, artificial intelligence, and the Internet of Things (IoT) in consumer electronics has further accelerated the need for sophisticated materials with superior thermal and electrical properties.
Manufacturing capabilities and production technologies have evolved substantially to meet growing industry demands. The aerospace components sector, a significant consumer of high-performance materials, demonstrated robust growth with production revenue reaching USD 466 billion in 2022. This growth has been accompanied by innovations in manufacturing processes, including the development of new polyimide grades with enhanced properties and improved processing characteristics. Manufacturers are increasingly investing in research and development to create materials that offer better thermal stability, mechanical strength, and chemical resistance.
Regional industrial policies and investments are reshaping the global polyimide market landscape. Governments worldwide are implementing supportive policies to boost domestic manufacturing capabilities, particularly in the electronics and advanced materials sectors. For instance, the UAE's ambitious industrial development plans have positioned it as an emerging hub for electronics manufacturing, with its electronics market projected to reach USD 3.32 billion by 2027. Similar initiatives across various regions are creating new opportunities for market expansion and technological innovation.
The industry is witnessing significant developments in supply chain optimization and distribution networks. Manufacturers are adopting vertical integration strategies to ensure consistent raw material supply and maintain quality standards. The consumer electronics sector, growing at an annual rate of 2.17% between 2023 and 2027, has prompted suppliers to establish robust distribution networks capable of meeting dynamic market demands. Companies are also investing in sustainable manufacturing practices and eco-friendly alternatives to align with global environmental regulations and changing consumer preferences.
Global Polyimides (PI) Market Trends
Technological advancements in electronics industry may foster the growth
- The rapid pace of technological innovation in electronic products is driving the consistent demand for new and fast electrical and electronic products. In 2022, the global revenue of electrical and electronics stood at USD 5,807 billion, with Asia-Pacific holding a 74% market share, followed by Europe with a 13% share. The global electrical and electronics market is expected to record a CAGR of 6.61% during the forecast period.
- In 2018, the Asia-Pacific region witnessed strong economic growth owing to rapid industrialization in China, South Korea, Japan, India, and ASEAN countries. In 2020, due to the pandemic, there was a slowdown in global electrical and electronics production due to the shortage of chips and inefficiencies in the supply chain, which led to a stagnant growth rate of 0.1% in revenue compared to the previous year. This growth was driven by the demand for consumer electronics for remote working and home entertainment as people were forced to remain indoors during the pandemic.
- The demand for advanced technologies, such as digitalization, robotics, virtual reality, augmented reality, IoT (Internet of Things), and 5G connectivity, is expected to grow during the forecast period. Global electrical and electronics production is expected to register a growth rate of 5.9% in 2027. As a result of technological advancements, the demand for consumer electronics is expected to rise during the forecast period. For instance, the global consumer electronics industry is projected to witness a revenue reach of around USD 904.6 billion in 2027, compared to USD 719.1 billion in 2023. As a result, technological development is projected to lead the demand for electrical and electronic products during the forecast period.

Understand The Key Trends Shaping This Market
Download PDF
OTHER KEY INDUSTRY TRENDS COVERED IN THE REPORT
- Fast-paced growth of aviation industry and increased aircraft contracts may aid market growth
- Fast-paced urbanization and investments in Asia-Pacific region may boost the industry
- Growing demand for electric vehicles may boost automobile industry growth
- Demand for flexible packaging from the food and beverage industry boosting market growth
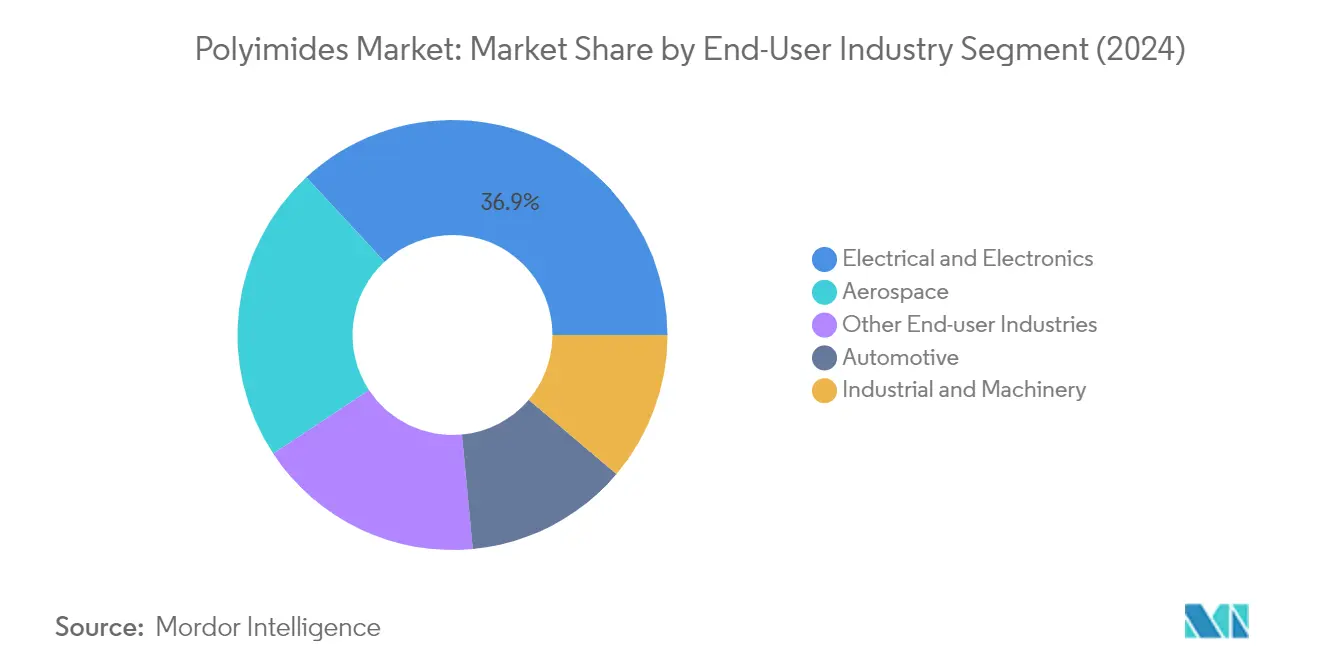
Segment Analysis: End User Industry
Electrical & Electronics Segment in Polyimides (PI) Market
The electrical and electronics segment dominates the global polyimide market, accounting for approximately 37% of the total market share in 2024. This significant market position is primarily driven by polyimide's excellent dielectric and insulating properties, making it essential in various electronic applications. The segment's strong performance is supported by the rapidly advancing electrical and electronics industry, with production revenue reaching USD 6.6 trillion in 2024. The growing demand for consumer electronics, coupled with emerging trends like AI, AR/VR, advanced materials, and the Internet of Things, continues to fuel the consumption of polyimide in electrical and electronic devices. The segment's dominance is particularly pronounced in Asia-Pacific, where countries like China and Japan are leading manufacturers of electronic components and devices.
Aerospace Segment in Polyimides (PI) Market
The aerospace segment is projected to exhibit the highest growth rate in the polyimide plastic market during 2024-2029, with an expected CAGR of approximately 8%. This robust growth is primarily driven by increasing demand for lightweight and high-performance materials in aircraft manufacturing. According to Boeing Commercial Outlook forecasts, there is a projected global demand for 48,575 new commercial jets by 2042, which is expected to significantly boost the consumption of polyimide resins market. The expansion of the aviation industry and substantial aircraft contracts from countries like India and China are driving the production of aircraft components in Europe and the United States. The segment's growth is particularly strong in South America, where Brazil's largest commercial aviation manufacturer, Embraer, serves as one of the major airplane parts and component suppliers.
Remaining Segments in End User Industry
The automotive, industrial and machinery, and other end-user industries segments collectively represent significant portions of the polyimide film market. The automotive sector utilizes PI polymer for its high thermal stability and mechanical properties in various vehicle components, particularly in electric vehicles and high-performance applications. The industrial and machinery segment leverages polyimide's wear resistance and thermal properties in manufacturing equipment and components. Other end-user industries, including medical equipment, consumer goods, and marine applications, contribute to market diversity through specialized applications requiring high-performance materials. These segments benefit from ongoing technological advancements and increasing demand for high-performance materials across various industrial applications.
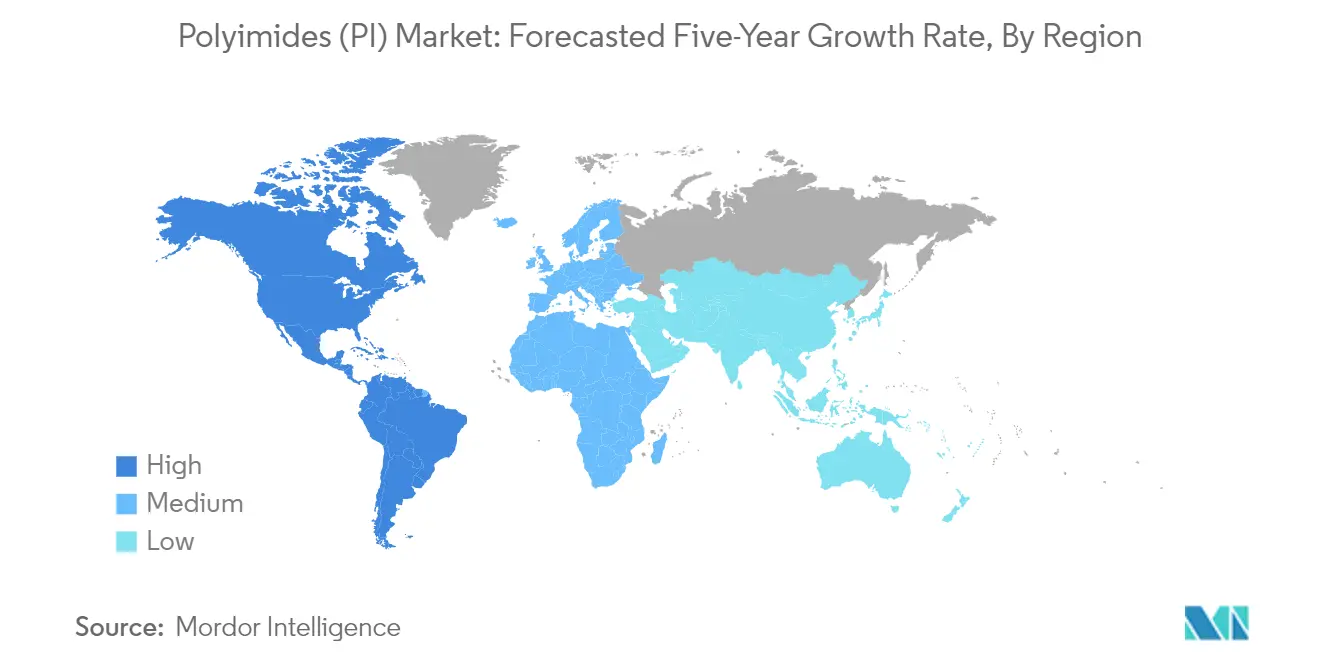
Polyimides (PI) Market Geography Segment Analysis
Polyimides (PI) Market in Africa
The African PI market demonstrates a growing presence in the global landscape, with key activities concentrated in South Africa and Nigeria. The region's market dynamics are primarily driven by developments in electrical and electronics manufacturing, automotive production, and increasing investments in industrial machinery. Both countries are witnessing increased adoption of polyimides across various end-user industries, particularly in electronics manufacturing and automotive applications.
Polyimides (PI) Market in South Africa - Regional Leader
South Africa stands as the dominant force in Africa's polyimide market, commanding approximately 25% of the regional consumption. The country's market leadership is anchored in its robust electrical and electronics industry, which represents the largest end-user segment. South Africa's strong position is further reinforced by its well-established manufacturing infrastructure and growing demand from medical device production. The country has also witnessed significant growth in consumer electronics demand, particularly in laptops, mobile phones, and smart wearable devices, driven by the increasing adoption of work-from-home models and home office setups.
Polyimides (PI) Market in South Africa - Growth Leader
South Africa also leads the region in terms of growth, with a projected CAGR of approximately 7% during 2024-2029. This growth trajectory is primarily fueled by the country's rapidly expanding electrical and electronics segment, which continues to evolve with emerging technologies like artificial intelligence and IoT. The medical device sector has emerged as another significant growth driver, with polyimides finding extensive applications in catheters, endoscopy equipment, and various other medical devices. The country's focus on technological advancement and industrial development, particularly in consumer electronics and medical equipment manufacturing, continues to create new opportunities for PI market applications.
Polyimides (PI) Market in Asia-Pacific
The Asia-Pacific region represents a dominant force in the global PI market, encompassing major industrial economies including China, Japan, India, South Korea, Australia, and Malaysia. The region's market is characterized by its diverse industrial base, strong manufacturing capabilities, and technological advancement across various sectors. Each country contributes uniquely to the market dynamics, with China and Japan leading in electronics manufacturing, while India and South Korea show strong growth in automotive and industrial applications.
Polyimides (PI) Market in China - Regional Leader
China dominates the Asia-Pacific PI market, holding approximately 59% of the regional consumption. The country's market leadership is built on its massive manufacturing base, particularly in electrical and electronics, automotive, and industrial machinery sectors. China's position is strengthened by its role as the region's manufacturing hub, with extensive production capabilities across multiple end-user industries. The country has established itself as a global leader in electronics manufacturing, with a strong focus on consumer electronics and advanced electronic components.
Polyimides (PI) Market in India - Growth Leader
India emerges as the fastest-growing market in the Asia-Pacific region, with a projected CAGR of approximately 7% during 2024-2029. The country's growth is driven by rapid industrialization and increasing domestic manufacturing capabilities, particularly in electronics and automotive sectors. India's expansion is supported by government initiatives like 'Digital India' and 'Smart City' projects, which are creating new opportunities for polyimide market applications. The country's focus on technological innovation and manufacturing self-reliance is expected to further accelerate market growth.
Polyimides (PI) Market in Europe
The European polyimides market encompasses a sophisticated industrial landscape across key economies including Germany, France, Italy, Russia, and the United Kingdom. The region's market is characterized by its advanced manufacturing capabilities, particularly in aerospace, automotive, and electronics sectors. Each country contributes distinct strengths to the market, with Germany leading in industrial applications and the UK showing promising growth potential.
Polyimides (PI) Market in Germany - Regional Leader
Germany stands as the cornerstone of the European PI market, commanding approximately 41% of the regional consumption. The country's leadership position is built on its robust manufacturing sector, particularly in electrical and electronics, aerospace, and industrial machinery. Germany's market dominance is reinforced by its high-tech manufacturing capabilities and strong presence in automotive and industrial applications. The country maintains its leading position through continuous technological innovation and strong industrial output.
Polyimides (PI) Market in United Kingdom - Growth Leader
The United Kingdom emerges as the fastest-growing market in Europe, with a projected CAGR of approximately 8% during 2024-2029. The UK's growth is primarily driven by increasing investments in aerospace and industrial machinery sectors. The country's expansion is supported by its strong focus on research and development, particularly in advanced materials and manufacturing processes. The UK's market growth is further enhanced by its increasing focus on defense infrastructure and rising demand for automated solutions across various industries.
Polyimides (PI) Market in Middle East
The Middle Eastern polyimides market demonstrates growing potential across its key markets, particularly in Saudi Arabia and the United Arab Emirates. The region's market is characterized by increasing investments in electronics manufacturing, automotive sector, and industrial applications. Saudi Arabia leads the regional market in terms of consumption, while the UAE shows the highest growth potential, driven by its rapid industrial development and technological advancement initiatives.
Polyimides (PI) Market in North America
The North American polyimides market encompasses a mature industrial landscape across the United States, Canada, and Mexico. The region demonstrates strong market fundamentals supported by advanced manufacturing capabilities and technological innovation. The United States leads the regional market with its extensive industrial base and strong presence in aerospace and electronics sectors, while Mexico emerges as the fastest-growing market driven by its expanding manufacturing capabilities and increasing investments in electronics and automotive sectors.
Polyimides (PI) Market in South America
The South American polyimides market shows promising development across its key markets, particularly in Brazil and Argentina. The region's market is characterized by growing industrial capabilities and increasing investments in manufacturing sectors. Brazil leads the regional market with its strong automotive and aerospace industries, while Argentina demonstrates the highest growth potential, driven by its expanding automotive sector and increasing focus on electronics manufacturing.
Get Analysis on Important Geographic Markets
Download PDF
Polyimides (PI) Industry Overview
Top Companies in Polyimides (PI) Market
The global polyimide market is characterized by companies focusing on strategic expansion and innovation to maintain their competitive positions. Leading polyimide manufacturers are actively expanding their market footprint through mergers and acquisitions, partnerships, and production capacity expansions, particularly in high-growth regions. Product innovation remains a key focus area, with companies developing specialized grades for emerging applications in the electronics and aerospace sectors. Several market players are investing in research and development to create next-generation polyimide materials, particularly targeting 5G and semiconductor applications. Manufacturing capacity enhancement has emerged as a prominent strategy, with multiple companies installing new production lines and upgrading existing facilities to meet growing demand. Additionally, companies are strengthening their distribution networks and forming strategic alliances to penetrate new geographical markets and industry segments.
Fragmented Market with Regional Manufacturing Hubs
The global polyimide material market exhibits a fragmented structure with a mix of large multinational corporations and specialized regional manufacturers. The top five manufacturers collectively occupy only about one-third of the market share in terms of production capacity, indicating low market concentration. Major players include both chemical conglomerates with diversified product portfolios and specialized manufacturers focused exclusively on polyimide products. The market is characterized by strong regional manufacturing clusters, particularly in Asia-Pacific, where several domestic players have established significant production capabilities.
The industry has witnessed strategic consolidation through mergers and acquisitions, particularly involving technology-focused companies and regional players seeking to expand their global presence. Companies are increasingly pursuing vertical integration strategies to secure raw material supply and strengthen their market position. The competitive landscape is further shaped by partnerships between manufacturers and end-users, especially in high-tech applications where customized solutions are required. Regional players are gradually expanding their presence through joint ventures and technical collaborations with established global manufacturers.
Innovation and Market Adaptability Drive Success
Success in the PI market increasingly depends on technological capabilities and the ability to develop application-specific solutions. Companies must invest in research and development to create innovative products that meet evolving industry requirements, particularly in emerging applications like flexible electronics and aerospace components. Building strong relationships with key end-users, especially in the electronics and aerospace sectors, is crucial for maintaining market share. Manufacturers need to focus on operational efficiency and supply chain optimization to remain competitive in a market characterized by price sensitivity and raw material cost fluctuations.
For new entrants and smaller players, success lies in identifying and serving niche market segments with specialized products. Companies must develop strategies to address the growing demand for environmentally sustainable solutions while maintaining product performance. Geographic expansion into emerging markets, particularly in Asia-Pacific and the Middle East, presents significant growth opportunities. The ability to navigate regulatory requirements, particularly in aerospace and electronics applications, will become increasingly important for market success. Companies must also maintain flexibility in their manufacturing processes to adapt to changing market demands and technological advancements in end-use industries.
Polyimides (PI) Market Leaders
-
DuPont
-
Kaneka Corporation
-
PI Advanced Materials Co., Ltd.
-
Toray Industries, Inc.
-
UBE Corporation
- *Disclaimer: Major Players sorted in no particular order
Market/1708339669874_Polyimides(PI)Market_market_concentration.svg)
Need More Details on Market Players and Competitors?
Download PDF
Polyimides (PI) Market News
- September 2022: PI Advanced Materials Co. Ltd invested KRW 80 billion for the expansion of the fourth production line at its Gumi production facility in Korea to expand annual production by 750 tons.
- November 2020: Kaneka Corporation developed a super heat-resistant polyimide film under the trademark Pixeo IB for application in 5G millimeter wave zones.
- October 2019: Taimide Technology Inc. completed the construction of its second-phase polyimide film production project and aims to target applications in 5G and flexible displays.
Free With This Report
We provide a complimentary and exhaustive set of data points on global and regional metrics that present the fundamental structure of the industry. Presented in the form of 15+ free charts, the section covers rare data on various end-user production trends including passenger vehicle production, commercial vehicle production, motorcycle production, aerospace components production, electrical and electronics production, and regional data for engineering plastics demand etc.


Polyimides (PI) Market Report - Table of Contents
1. EXECUTIVE SUMMARY & KEY FINDINGS
2. REPORT OFFERS
3. INTRODUCTION
- 3.1 Study Assumptions & Market Definition
- 3.2 Scope of the Study
- 3.3 Research Methodology
4. KEY INDUSTRY TRENDS
-
4.1 End User Trends
- 4.1.1 Aerospace
- 4.1.2 Automotive
- 4.1.3 Building and Construction
- 4.1.4 Electrical and Electronics
- 4.1.5 Packaging
-
4.2 Regulatory Framework
- 4.2.1 Argentina
- 4.2.2 Australia
- 4.2.3 Brazil
- 4.2.4 Canada
- 4.2.5 China
- 4.2.6 EU
- 4.2.7 India
- 4.2.8 Japan
- 4.2.9 Malaysia
- 4.2.10 Mexico
- 4.2.11 Nigeria
- 4.2.12 Russia
- 4.2.13 Saudi Arabia
- 4.2.14 South Africa
- 4.2.15 South Korea
- 4.2.16 United Arab Emirates
- 4.2.17 United Kingdom
- 4.2.18 United States
- 4.3 Value Chain & Distribution Channel Analysis
5. MARKET SEGMENTATION (includes market size in Value in USD and Volume, Forecasts up to 2029 and analysis of growth prospects)
-
5.1 End User Industry
- 5.1.1 Aerospace
- 5.1.2 Automotive
- 5.1.3 Electrical and Electronics
- 5.1.4 Industrial and Machinery
- 5.1.5 Other End-user Industries
-
5.2 Region
- 5.2.1 Africa
- 5.2.1.1 By Country
- 5.2.1.1.1 Nigeria
- 5.2.1.1.2 South Africa
- 5.2.1.1.3 Rest of Africa
- 5.2.2 Asia-Pacific
- 5.2.2.1 By Country
- 5.2.2.1.1 Australia
- 5.2.2.1.2 China
- 5.2.2.1.3 India
- 5.2.2.1.4 Japan
- 5.2.2.1.5 Malaysia
- 5.2.2.1.6 South Korea
- 5.2.2.1.7 Rest of Asia-Pacific
- 5.2.3 Europe
- 5.2.3.1 By Country
- 5.2.3.1.1 France
- 5.2.3.1.2 Germany
- 5.2.3.1.3 Italy
- 5.2.3.1.4 Russia
- 5.2.3.1.5 United Kingdom
- 5.2.3.1.6 Rest of Europe
- 5.2.4 Middle East
- 5.2.4.1 By Country
- 5.2.4.1.1 Saudi Arabia
- 5.2.4.1.2 United Arab Emirates
- 5.2.4.1.3 Rest of Middle East
- 5.2.5 North America
- 5.2.5.1 By Country
- 5.2.5.1.1 Canada
- 5.2.5.1.2 Mexico
- 5.2.5.1.3 United States
- 5.2.6 South America
- 5.2.6.1 By Country
- 5.2.6.1.1 Argentina
- 5.2.6.1.2 Brazil
- 5.2.6.1.3 Rest of South America
6. COMPETITIVE LANDSCAPE
- 6.1 Key Strategic Moves
- 6.2 Market Share Analysis
- 6.3 Company Landscape
-
6.4 Company Profiles (includes Global Level Overview, Market Level Overview, Core Business Segments, Financials, Headcount, Key Information, Market Rank, Market Share, Products and Services, and Analysis of Recent Developments).
- 6.4.1 China Wanda Group
- 6.4.2 DuPont
- 6.4.3 Jiaozuo Tianyi Technology Co., Ltd.
- 6.4.4 Kaneka Corporation
- 6.4.5 Mitsui Chemicals, Inc.
- 6.4.6 PI Advanced Materials Co., Ltd.
- 6.4.7 SZRH Film Technology Group
- 6.4.8 Taimide Tech. Inc.
- 6.4.9 Toray Industries, Inc.
- 6.4.10 UBE Corporation
7. KEY STRATEGIC QUESTIONS FOR ENGINEERING PLASTICS CEOS
8. APPENDIX
-
8.1 Global Overview
- 8.1.1 Overview
- 8.1.2 Porter’s Five Forces Framework (Industry Attractiveness Analysis)
- 8.1.3 Global Value Chain Analysis
- 8.1.4 Market Dynamics (DROs)
- 8.2 Sources & References
- 8.3 List of Tables & Figures
- 8.4 Primary Insights
- 8.5 Data Pack
- 8.6 Glossary of Terms
You Can Purchase Parts Of This Report. Check Out Prices For Specific Sections
Get Price Break-up Now
List of Tables & Figures
- Figure 1:
- PRODUCTION REVENUE OF AEROSPACE COMPONENTS, USD, GLOBAL, 2017 - 2029
- Figure 2:
- PRODUCTION VOLUME OF AUTOMOBILES, UNITS, GLOBAL, 2017 - 2029
- Figure 3:
- FLOOR AREA OF NEW CONSTRUCTION, SQUARE FEET, GLOBAL, 2017 - 2029
- Figure 4:
- PRODUCTION REVENUE OF ELECTRICAL AND ELECTRONICS, USD, GLOBAL, 2017 - 2029
- Figure 5:
- PRODUCTION VOLUME OF PLASTIC PACKAGING, TONS, GLOBAL, 2017 - 2029
- Figure 6:
- VOLUME OF POLYIMIDE (PI) CONSUMED, TONS, GLOBAL, 2017 - 2029
- Figure 7:
- VALUE OF POLYIMIDE (PI) CONSUMED, USD, GLOBAL, 2017 - 2029
- Figure 8:
- VOLUME OF POLYIMIDE (PI) CONSUMED BY END USER INDUSTRY, TONS, GLOBAL, 2017 - 2029
- Figure 9:
- VALUE OF POLYIMIDE (PI) CONSUMED BY END USER INDUSTRY, USD, GLOBAL, 2017 - 2029
- Figure 10:
- VOLUME SHARE OF POLYIMIDE (PI) CONSUMED BY END USER INDUSTRY, %, GLOBAL, 2017, 2023, AND 2029
- Figure 11:
- VALUE SHARE OF POLYIMIDE (PI) CONSUMED BY END USER INDUSTRY, %, GLOBAL, 2017, 2023, AND 2029
- Figure 12:
- VOLUME OF POLYIMIDE (PI) CONSUMED IN AEROSPACE INDUSTRY, TONS, GLOBAL, 2017 - 2029
- Figure 13:
- VALUE OF POLYIMIDE (PI) CONSUMED IN AEROSPACE INDUSTRY, USD, GLOBAL, 2017 - 2029
- Figure 14:
- VALUE SHARE OF POLYIMIDE (PI) CONSUMED IN AEROSPACE INDUSTRY BY REGION, %, GLOBAL, 2022 VS 2029
- Figure 15:
- VOLUME OF POLYIMIDE (PI) CONSUMED IN AUTOMOTIVE INDUSTRY, TONS, GLOBAL, 2017 - 2029
- Figure 16:
- VALUE OF POLYIMIDE (PI) CONSUMED IN AUTOMOTIVE INDUSTRY, USD, GLOBAL, 2017 - 2029
- Figure 17:
- VALUE SHARE OF POLYIMIDE (PI) CONSUMED IN AUTOMOTIVE INDUSTRY BY REGION, %, GLOBAL, 2022 VS 2029
- Figure 18:
- VOLUME OF POLYIMIDE (PI) CONSUMED IN ELECTRICAL AND ELECTRONICS INDUSTRY, TONS, GLOBAL, 2017 - 2029
- Figure 19:
- VALUE OF POLYIMIDE (PI) CONSUMED IN ELECTRICAL AND ELECTRONICS INDUSTRY, USD, GLOBAL, 2017 - 2029
- Figure 20:
- VALUE SHARE OF POLYIMIDE (PI) CONSUMED IN ELECTRICAL AND ELECTRONICS INDUSTRY BY REGION, %, GLOBAL, 2022 VS 2029
- Figure 21:
- VOLUME OF POLYIMIDE (PI) CONSUMED IN INDUSTRIAL AND MACHINERY INDUSTRY, TONS, GLOBAL, 2017 - 2029
- Figure 22:
- VALUE OF POLYIMIDE (PI) CONSUMED IN INDUSTRIAL AND MACHINERY INDUSTRY, USD, GLOBAL, 2017 - 2029
- Figure 23:
- VALUE SHARE OF POLYIMIDE (PI) CONSUMED IN INDUSTRIAL AND MACHINERY INDUSTRY BY REGION, %, GLOBAL, 2022 VS 2029
- Figure 24:
- VOLUME OF POLYIMIDE (PI) CONSUMED IN OTHER END-USER INDUSTRIES INDUSTRY, TONS, GLOBAL, 2017 - 2029
- Figure 25:
- VALUE OF POLYIMIDE (PI) CONSUMED IN OTHER END-USER INDUSTRIES INDUSTRY, USD, GLOBAL, 2017 - 2029
- Figure 26:
- VALUE SHARE OF POLYIMIDE (PI) CONSUMED IN OTHER END-USER INDUSTRIES INDUSTRY BY REGION, %, GLOBAL, 2022 VS 2029
- Figure 27:
- VOLUME OF POLYIMIDE (PI) CONSUMED BY REGION, TONS, GLOBAL, 2017 - 2029
- Figure 28:
- VALUE OF POLYIMIDE (PI) CONSUMED BY REGION, USD, GLOBAL, 2017 - 2029
- Figure 29:
- VOLUME SHARE OF POLYIMIDE (PI) CONSUMED BY REGION, %, GLOBAL, 2017, 2023, AND 2029
- Figure 30:
- VALUE SHARE OF POLYIMIDE (PI) CONSUMED BY REGION, %, GLOBAL, 2017, 2023, AND 2029
- Figure 31:
- VOLUME OF POLYIMIDE (PI) CONSUMED BY COUNTRY, TONS, AFRICA, 2017 - 2029
- Figure 32:
- VALUE OF POLYIMIDE (PI) CONSUMED BY COUNTRY, USD, AFRICA, 2017 - 2029
- Figure 33:
- VOLUME SHARE OF POLYIMIDE (PI) CONSUMED BY COUNTRY, %, AFRICA, 2017, 2023, AND 2029
- Figure 34:
- VALUE SHARE OF POLYIMIDE (PI) CONSUMED BY COUNTRY, %, AFRICA, 2017, 2023, AND 2029
- Figure 35:
- VOLUME OF POLYIMIDE (PI) CONSUMED, TONS, NIGERIA, 2017 - 2029
- Figure 36:
- VALUE OF POLYIMIDE (PI) CONSUMED, USD, NIGERIA, 2017 - 2029
- Figure 37:
- VALUE SHARE OF POLYIMIDE (PI) CONSUMED BY END USER INDUSTRY, %, NIGERIA, 2022 VS 2029
- Figure 38:
- VOLUME OF POLYIMIDE (PI) CONSUMED, TONS, SOUTH AFRICA, 2017 - 2029
- Figure 39:
- VALUE OF POLYIMIDE (PI) CONSUMED, USD, SOUTH AFRICA, 2017 - 2029
- Figure 40:
- VALUE SHARE OF POLYIMIDE (PI) CONSUMED BY END USER INDUSTRY, %, SOUTH AFRICA, 2022 VS 2029
- Figure 41:
- VOLUME OF POLYIMIDE (PI) CONSUMED, TONS, REST OF AFRICA, 2017 - 2029
- Figure 42:
- VALUE OF POLYIMIDE (PI) CONSUMED, USD, REST OF AFRICA, 2017 - 2029
- Figure 43:
- VALUE SHARE OF POLYIMIDE (PI) CONSUMED BY END USER INDUSTRY, %, REST OF AFRICA, 2022 VS 2029
- Figure 44:
- VOLUME OF POLYIMIDE (PI) CONSUMED BY COUNTRY, TONS, ASIA-PACIFIC, 2017 - 2029
- Figure 45:
- VALUE OF POLYIMIDE (PI) CONSUMED BY COUNTRY, USD, ASIA-PACIFIC, 2017 - 2029
- Figure 46:
- VOLUME SHARE OF POLYIMIDE (PI) CONSUMED BY COUNTRY, %, ASIA-PACIFIC, 2017, 2023, AND 2029
- Figure 47:
- VALUE SHARE OF POLYIMIDE (PI) CONSUMED BY COUNTRY, %, ASIA-PACIFIC, 2017, 2023, AND 2029
- Figure 48:
- VOLUME OF POLYIMIDE (PI) CONSUMED, TONS, AUSTRALIA, 2017 - 2029
- Figure 49:
- VALUE OF POLYIMIDE (PI) CONSUMED, USD, AUSTRALIA, 2017 - 2029
- Figure 50:
- VALUE SHARE OF POLYIMIDE (PI) CONSUMED BY END USER INDUSTRY, %, AUSTRALIA, 2022 VS 2029
- Figure 51:
- VOLUME OF POLYIMIDE (PI) CONSUMED, TONS, CHINA, 2017 - 2029
- Figure 52:
- VALUE OF POLYIMIDE (PI) CONSUMED, USD, CHINA, 2017 - 2029
- Figure 53:
- VALUE SHARE OF POLYIMIDE (PI) CONSUMED BY END USER INDUSTRY, %, CHINA, 2022 VS 2029
- Figure 54:
- VOLUME OF POLYIMIDE (PI) CONSUMED, TONS, INDIA, 2017 - 2029
- Figure 55:
- VALUE OF POLYIMIDE (PI) CONSUMED, USD, INDIA, 2017 - 2029
- Figure 56:
- VALUE SHARE OF POLYIMIDE (PI) CONSUMED BY END USER INDUSTRY, %, INDIA, 2022 VS 2029
- Figure 57:
- VOLUME OF POLYIMIDE (PI) CONSUMED, TONS, JAPAN, 2017 - 2029
- Figure 58:
- VALUE OF POLYIMIDE (PI) CONSUMED, USD, JAPAN, 2017 - 2029
- Figure 59:
- VALUE SHARE OF POLYIMIDE (PI) CONSUMED BY END USER INDUSTRY, %, JAPAN, 2022 VS 2029
- Figure 60:
- VOLUME OF POLYIMIDE (PI) CONSUMED, TONS, MALAYSIA, 2017 - 2029
- Figure 61:
- VALUE OF POLYIMIDE (PI) CONSUMED, USD, MALAYSIA, 2017 - 2029
- Figure 62:
- VALUE SHARE OF POLYIMIDE (PI) CONSUMED BY END USER INDUSTRY, %, MALAYSIA, 2022 VS 2029
- Figure 63:
- VOLUME OF POLYIMIDE (PI) CONSUMED, TONS, SOUTH KOREA, 2017 - 2029
- Figure 64:
- VALUE OF POLYIMIDE (PI) CONSUMED, USD, SOUTH KOREA, 2017 - 2029
- Figure 65:
- VALUE SHARE OF POLYIMIDE (PI) CONSUMED BY END USER INDUSTRY, %, SOUTH KOREA, 2022 VS 2029
- Figure 66:
- VOLUME OF POLYIMIDE (PI) CONSUMED, TONS, REST OF ASIA-PACIFIC, 2017 - 2029
- Figure 67:
- VALUE OF POLYIMIDE (PI) CONSUMED, USD, REST OF ASIA-PACIFIC, 2017 - 2029
- Figure 68:
- VALUE SHARE OF POLYIMIDE (PI) CONSUMED BY END USER INDUSTRY, %, REST OF ASIA-PACIFIC, 2022 VS 2029
- Figure 69:
- VOLUME OF POLYIMIDE (PI) CONSUMED BY COUNTRY, TONS, EUROPE, 2017 - 2029
- Figure 70:
- VALUE OF POLYIMIDE (PI) CONSUMED BY COUNTRY, USD, EUROPE, 2017 - 2029
- Figure 71:
- VOLUME SHARE OF POLYIMIDE (PI) CONSUMED BY COUNTRY, %, EUROPE, 2017, 2023, AND 2029
- Figure 72:
- VALUE SHARE OF POLYIMIDE (PI) CONSUMED BY COUNTRY, %, EUROPE, 2017, 2023, AND 2029
- Figure 73:
- VOLUME OF POLYIMIDE (PI) CONSUMED, TONS, FRANCE, 2017 - 2029
- Figure 74:
- VALUE OF POLYIMIDE (PI) CONSUMED, USD, FRANCE, 2017 - 2029
- Figure 75:
- VALUE SHARE OF POLYIMIDE (PI) CONSUMED BY END USER INDUSTRY, %, FRANCE, 2022 VS 2029
- Figure 76:
- VOLUME OF POLYIMIDE (PI) CONSUMED, TONS, GERMANY, 2017 - 2029
- Figure 77:
- VALUE OF POLYIMIDE (PI) CONSUMED, USD, GERMANY, 2017 - 2029
- Figure 78:
- VALUE SHARE OF POLYIMIDE (PI) CONSUMED BY END USER INDUSTRY, %, GERMANY, 2022 VS 2029
- Figure 79:
- VOLUME OF POLYIMIDE (PI) CONSUMED, TONS, ITALY, 2017 - 2029
- Figure 80:
- VALUE OF POLYIMIDE (PI) CONSUMED, USD, ITALY, 2017 - 2029
- Figure 81:
- VALUE SHARE OF POLYIMIDE (PI) CONSUMED BY END USER INDUSTRY, %, ITALY, 2022 VS 2029
- Figure 82:
- VOLUME OF POLYIMIDE (PI) CONSUMED, TONS, RUSSIA, 2017 - 2029
- Figure 83:
- VALUE OF POLYIMIDE (PI) CONSUMED, USD, RUSSIA, 2017 - 2029
- Figure 84:
- VALUE SHARE OF POLYIMIDE (PI) CONSUMED BY END USER INDUSTRY, %, RUSSIA, 2022 VS 2029
- Figure 85:
- VOLUME OF POLYIMIDE (PI) CONSUMED, TONS, UNITED KINGDOM, 2017 - 2029
- Figure 86:
- VALUE OF POLYIMIDE (PI) CONSUMED, USD, UNITED KINGDOM, 2017 - 2029
- Figure 87:
- VALUE SHARE OF POLYIMIDE (PI) CONSUMED BY END USER INDUSTRY, %, UNITED KINGDOM, 2022 VS 2029
- Figure 88:
- VOLUME OF POLYIMIDE (PI) CONSUMED, TONS, REST OF EUROPE, 2017 - 2029
- Figure 89:
- VALUE OF POLYIMIDE (PI) CONSUMED, USD, REST OF EUROPE, 2017 - 2029
- Figure 90:
- VALUE SHARE OF POLYIMIDE (PI) CONSUMED BY END USER INDUSTRY, %, REST OF EUROPE, 2022 VS 2029
- Figure 91:
- VOLUME OF POLYIMIDE (PI) CONSUMED BY COUNTRY, TONS, MIDDLE EAST, 2017 - 2029
- Figure 92:
- VALUE OF POLYIMIDE (PI) CONSUMED BY COUNTRY, USD, MIDDLE EAST, 2017 - 2029
- Figure 93:
- VOLUME SHARE OF POLYIMIDE (PI) CONSUMED BY COUNTRY, %, MIDDLE EAST, 2017, 2023, AND 2029
- Figure 94:
- VALUE SHARE OF POLYIMIDE (PI) CONSUMED BY COUNTRY, %, MIDDLE EAST, 2017, 2023, AND 2029
- Figure 95:
- VOLUME OF POLYIMIDE (PI) CONSUMED, TONS, SAUDI ARABIA, 2017 - 2029
- Figure 96:
- VALUE OF POLYIMIDE (PI) CONSUMED, USD, SAUDI ARABIA, 2017 - 2029
- Figure 97:
- VALUE SHARE OF POLYIMIDE (PI) CONSUMED BY END USER INDUSTRY, %, SAUDI ARABIA, 2022 VS 2029
- Figure 98:
- VOLUME OF POLYIMIDE (PI) CONSUMED, TONS, UNITED ARAB EMIRATES, 2017 - 2029
- Figure 99:
- VALUE OF POLYIMIDE (PI) CONSUMED, USD, UNITED ARAB EMIRATES, 2017 - 2029
- Figure 100:
- VALUE SHARE OF POLYIMIDE (PI) CONSUMED BY END USER INDUSTRY, %, UNITED ARAB EMIRATES, 2022 VS 2029
- Figure 101:
- VOLUME OF POLYIMIDE (PI) CONSUMED, TONS, REST OF MIDDLE EAST, 2017 - 2029
- Figure 102:
- VALUE OF POLYIMIDE (PI) CONSUMED, USD, REST OF MIDDLE EAST, 2017 - 2029
- Figure 103:
- VALUE SHARE OF POLYIMIDE (PI) CONSUMED BY END USER INDUSTRY, %, REST OF MIDDLE EAST, 2022 VS 2029
- Figure 104:
- VOLUME OF POLYIMIDE (PI) CONSUMED BY COUNTRY, TONS, NORTH AMERICA, 2017 - 2029
- Figure 105:
- VALUE OF POLYIMIDE (PI) CONSUMED BY COUNTRY, USD, NORTH AMERICA, 2017 - 2029
- Figure 106:
- VOLUME SHARE OF POLYIMIDE (PI) CONSUMED BY COUNTRY, %, NORTH AMERICA, 2017, 2023, AND 2029
- Figure 107:
- VALUE SHARE OF POLYIMIDE (PI) CONSUMED BY COUNTRY, %, NORTH AMERICA, 2017, 2023, AND 2029
- Figure 108:
- VOLUME OF POLYIMIDE (PI) CONSUMED, TONS, CANADA, 2017 - 2029
- Figure 109:
- VALUE OF POLYIMIDE (PI) CONSUMED, USD, CANADA, 2017 - 2029
- Figure 110:
- VALUE SHARE OF POLYIMIDE (PI) CONSUMED BY END USER INDUSTRY, %, CANADA, 2022 VS 2029
- Figure 111:
- VOLUME OF POLYIMIDE (PI) CONSUMED, TONS, MEXICO, 2017 - 2029
- Figure 112:
- VALUE OF POLYIMIDE (PI) CONSUMED, USD, MEXICO, 2017 - 2029
- Figure 113:
- VALUE SHARE OF POLYIMIDE (PI) CONSUMED BY END USER INDUSTRY, %, MEXICO, 2022 VS 2029
- Figure 114:
- VOLUME OF POLYIMIDE (PI) CONSUMED, TONS, UNITED STATES, 2017 - 2029
- Figure 115:
- VALUE OF POLYIMIDE (PI) CONSUMED, USD, UNITED STATES, 2017 - 2029
- Figure 116:
- VALUE SHARE OF POLYIMIDE (PI) CONSUMED BY END USER INDUSTRY, %, UNITED STATES, 2022 VS 2029
- Figure 117:
- VOLUME OF POLYIMIDE (PI) CONSUMED BY COUNTRY, TONS, SOUTH AMERICA, 2017 - 2029
- Figure 118:
- VALUE OF POLYIMIDE (PI) CONSUMED BY COUNTRY, USD, SOUTH AMERICA, 2017 - 2029
- Figure 119:
- VOLUME SHARE OF POLYIMIDE (PI) CONSUMED BY COUNTRY, %, SOUTH AMERICA, 2017, 2023, AND 2029
- Figure 120:
- VALUE SHARE OF POLYIMIDE (PI) CONSUMED BY COUNTRY, %, SOUTH AMERICA, 2017, 2023, AND 2029
- Figure 121:
- VOLUME OF POLYIMIDE (PI) CONSUMED, TONS, ARGENTINA, 2017 - 2029
- Figure 122:
- VALUE OF POLYIMIDE (PI) CONSUMED, USD, ARGENTINA, 2017 - 2029
- Figure 123:
- VALUE SHARE OF POLYIMIDE (PI) CONSUMED BY END USER INDUSTRY, %, ARGENTINA, 2022 VS 2029
- Figure 124:
- VOLUME OF POLYIMIDE (PI) CONSUMED, TONS, BRAZIL, 2017 - 2029
- Figure 125:
- VALUE OF POLYIMIDE (PI) CONSUMED, USD, BRAZIL, 2017 - 2029
- Figure 126:
- VALUE SHARE OF POLYIMIDE (PI) CONSUMED BY END USER INDUSTRY, %, BRAZIL, 2022 VS 2029
- Figure 127:
- VOLUME OF POLYIMIDE (PI) CONSUMED, TONS, REST OF SOUTH AMERICA, 2017 - 2029
- Figure 128:
- VALUE OF POLYIMIDE (PI) CONSUMED, USD, REST OF SOUTH AMERICA, 2017 - 2029
- Figure 129:
- VALUE SHARE OF POLYIMIDE (PI) CONSUMED BY END USER INDUSTRY, %, REST OF SOUTH AMERICA, 2022 VS 2029
- Figure 130:
- MOST ACTIVE COMPANIES BY NUMBER OF STRATEGIC MOVES, GLOBAL, 2019 - 2021
- Figure 131:
- MOST ADOPTED STRATEGIES, COUNT, GLOBAL, 2019 - 2021
- Figure 132:
- PRODUCTION CAPACITY SHARE OF POLYIMIDE (PI) BY MAJOR PLAYERS, %, GLOBAL, 2022
Polyimides (PI) Industry Segmentation
Aerospace, Automotive, Electrical and Electronics, Industrial and Machinery are covered as segments by End User Industry. Africa, Asia-Pacific, Europe, Middle East, North America, South America are covered as segments by Region.| End User Industry | Aerospace | |||
| Automotive | ||||
| Electrical and Electronics | ||||
| Industrial and Machinery | ||||
| Other End-user Industries | ||||
| Region | Africa | By Country | Nigeria | |
| South Africa | ||||
| Rest of Africa | ||||
| Asia-Pacific | By Country | Australia | ||
| China | ||||
| India | ||||
| Japan | ||||
| Malaysia | ||||
| South Korea | ||||
| Rest of Asia-Pacific | ||||
| Europe | By Country | France | ||
| Germany | ||||
| Italy | ||||
| Russia | ||||
| United Kingdom | ||||
| Rest of Europe | ||||
| Middle East | By Country | Saudi Arabia | ||
| United Arab Emirates | ||||
| Rest of Middle East | ||||
| North America | By Country | Canada | ||
| Mexico | ||||
| United States | ||||
| South America | By Country | Argentina | ||
| Brazil | ||||
| Rest of South America | ||||
Need A Different Region or Segment?
Customize Now
Market Definition
- End-user Industry - Automotive, Aerospace, Industrial Machinery, Electrical & Electronics, and Others are the end-user industries considered under the polyimide market.
- Resin - Under the scope of the study, virgin thermosetting and thermoplastic polyimide resins in the primary forms are considered.
| Keyword | Definition |
|---|---|
| Acetal | This is a rigid material that has a slippery surface. It can easily withstand wear and tear in abusive work environments. This polymer is used for building applications such as gears, bearings, valve components, etc. |
| Acrylic | This synthetic resin is a derivative of acrylic acid. It forms a smooth surface and is mainly used for various indoor applications. The material can also be used for outdoor applications with a special formulation. |
| Cast film | A cast film is made by depositing a layer of plastic onto a surface then solidifying and removing the film from that surface. The plastic layer can be in molten form, in a solution, or in dispersion. |
| Colorants & Pigments | Colorants & Pigments are additives used to change the color of the plastic. They can be a powder or a resin/color premix. |
| Composite material | A composite material is a material that is produced from two or more constituent materials. These constituent materials have dissimilar chemical or physical properties and are merged to create a material with properties unlike the individual elements. |
| Degree of Polymerization (DP) | The number of monomeric units in a macromolecule, polymer, or oligomer molecule is referred to as the degree of polymerization or DP. Plastics with useful physical properties often have DPs in the thousands. |
| Dispersion | To create a suspension or solution of material in another substance, fine, agglomerated solid particles of one substance are dispersed in a liquid or another substance to form a dispersion. |
| Fiberglass | Fiberglass-reinforced plastic is a material made up of glass fibers embedded in a resin matrix. These materials have high tensile and impact strength. Handrails and platforms are two examples of lightweight structural applications that use standard fiberglass. |
| Fiber-reinforced polymer (FRP) | Fiber-reinforced polymer is a composite material made of a polymer matrix reinforced with fibers. The fibers are usually glass, carbon, aramid, or basalt. |
| Flake | This is a dry, peeled-off piece, usually with an uneven surface, and is the base of cellulosic plastics. |
| Fluoropolymers | This is a fluorocarbon-based polymer with multiple carbon-fluorine bonds. It is characterized by high resistance to solvents, acids, and bases. These materials are tough yet easy to machine. Some of the popular fluoropolymers are PTFE, ETFE, PVDF, PVF, etc. |
| Kevlar | Kevlar is the commonly referred name for aramid fiber, which was initially a Dupont brand for aramid fiber. Any group of lightweight, heat-resistant, solid, synthetic, aromatic polyamide materials that are fashioned into fibers, filaments, or sheets is called aramid fiber. They are classified into Para-aramid and Meta-aramid. |
| Laminate | A structure or surface composed of sequential layers of material bonded under pressure and heat to build up to the desired shape and width. |
| Nylon | They are synthetic fiber-forming polyamides formed into yarns and monofilaments. These fibers possess excellent tensile strength, durability, and elasticity. They have high melting points and can resist chemicals and various liquids. |
| PET preform | A preform is an intermediate product that is subsequently blown into a polyethylene terephthalate (PET) bottle or a container. |
| Plastic compounding | Compounding consists of preparing plastic formulations by mixing and/or blending polymers and additives in a molten state to achieve the desired characteristics. These blends are automatically dosed with fixed setpoints usually through feeders/hoppers. |
| Plastic pellets | Plastic pellets, also known as pre-production pellets or nurdles, are the building blocks for nearly every product made of plastic. |
| Polymerization | It is a chemical reaction of several monomer molecules to form polymer chains that form stable covalent bonds. |
| Styrene Copolymers | A copolymer is a polymer derived from more than one species of monomer, and a styrene copolymer is a chain of polymers consisting of styrene and acrylate. |
| Thermoplastics | Thermoplastics are defined as polymers that become soft material when it is heated and becomes hard when it is cooled. Thermoplastics have wide-ranging properties and can be remolded and recycled without affecting their physical properties. |
| Virgin Plastic | It is a basic form of plastic that has never been used, processed, or developed. It may be considered more valuable than recycled or already used materials. |
Need More Details on Market Definition?
Ask a Question
Research Methodology
Mordor Intelligence follows a four-step methodology in all our reports.
- Step-1: Identify Key Variables: The quantifiable key variables (industry and extraneous) pertaining to the specific product segment and country are selected from a group of relevant variables & factors based on desk research & literature review; along with primary expert inputs. These variables are further confirmed through regression modeling (wherever required).
- Step-2: Build a Market Model: In order to build a robust forecasting methodology, the variables and factors identified in Step-1 are tested against available historical market numbers. Through an iterative process, the variables required for market forecast are set and the model is built on the basis of these variables.
- Step-3: Validate and Finalize: In this important step, all market numbers, variables and analyst calls are validated through an extensive network of primary research experts from the market studied. The respondents are selected across levels and functions to generate a holistic picture of the market studied.
- Step-4: Research Outputs: Syndicated Reports, Custom Consulting Assignments, Databases & Subscription Platforms

Get More Details On Research Methodology
Download PDF


