| Study Period | 2017 - 2029 |
| Base Year For Estimation | 2023 |
| Forecast Data Period | 2024 - 2029 |
| Market Size (2024) | USD 3.28 Billion |
| Market Size (2029) | USD 4.50 Billion |
| CAGR (2024 - 2029) | 6.52 % |
| Market Concentration | Medium |
Major Players*Disclaimer: Major Players sorted in no particular order |
 Market Size")
Polybutylene Terephthalate (PBT) Market Analysis
The Polybutylene Terephthalate (PBT) Market size is estimated at 3.28 billion USD in 2024, and is expected to reach 4.50 billion USD by 2029, growing at a CAGR of 6.52% during the forecast period (2024-2029).
The Polybutylene Terephthalate industry is experiencing significant transformation driven by broader technological advancements and shifting consumer preferences. The increasing focus on sustainable materials and environmental consciousness has led manufacturers to develop eco-friendly PBT variants and recycling solutions. Material science innovations have enabled the development of enhanced PBT formulations with improved mechanical properties and chemical resistance. The integration of advanced manufacturing technologies and automation in PBT production has optimized production efficiency and quality control. The global consumer electronics market's projected growth to USD 1,071 billion by 2027 from USD 666 billion in 2023 reflects the expanding applications and opportunities for PBT materials.
The industry is witnessing a notable shift toward lightweight and high-performance materials across various applications. Manufacturers are investing in research and development to create specialized PBT grades that meet specific industry requirements while maintaining cost-effectiveness. The emergence of new PBT applications and the replacement of traditional materials with PBT compounds have expanded the material's market potential. The global electric vehicles market's expected growth to USD 858 billion by 2027 from USD 457.6 billion in 2023 demonstrates the increasing demand for high-performance engineering plastics like PBT.
Supply chain optimization and raw material security have become crucial focus areas for industry stakeholders. Companies are implementing strategic partnerships and vertical integration to ensure stable supply chains and competitive pricing. The development of alternative feedstock sources and the adoption of circular economy principles are reshaping the industry's approach to sustainability. The emphasis on localized production and reduced dependency on specific regions has led to geographical diversification in manufacturing capabilities. The global electronics industry's anticipated expansion to USD 1.3 trillion by 2027 from USD 0.98 trillion in 2023 underscores the growing importance of reliable supply chains.
The Polybutylene Terephthalate market is experiencing increased consolidation through mergers, acquisitions, and strategic alliances. Industry players are focusing on expanding their product portfolios and geographical presence to maintain competitive advantages. Investments in digital technologies and smart manufacturing solutions are enhancing operational efficiency and product customization capabilities. The adoption of Industry 4.0 principles and data-driven decision-making is transforming production processes and quality control measures. Companies are also emphasizing research and development in novel applications and improved material properties to address evolving market demands and maintain technological leadership.
Global Polybutylene Terephthalate (PBT) Market Trends
Technological advancements in electronics industry may foster the growth
- The rapid pace of technological innovation in electronic products is driving the consistent demand for new and fast electrical and electronic products. In 2022, the global revenue of electrical and electronics stood at USD 5,807 billion, with Asia-Pacific holding a 74% market share, followed by Europe with a 13% share. The global electrical and electronics market is expected to record a CAGR of 6.61% during the forecast period.
- In 2018, the Asia-Pacific region witnessed strong economic growth owing to rapid industrialization in China, South Korea, Japan, India, and ASEAN countries. In 2020, due to the pandemic, there was a slowdown in global electrical and electronics production due to the shortage of chips and inefficiencies in the supply chain, which led to a stagnant growth rate of 0.1% in revenue compared to the previous year. This growth was driven by the demand for consumer electronics for remote working and home entertainment as people were forced to remain indoors during the pandemic.
- The demand for advanced technologies, such as digitalization, robotics, virtual reality, augmented reality, IoT (Internet of Things), and 5G connectivity, is expected to grow during the forecast period. Global electrical and electronics production is expected to register a growth rate of 5.9% in 2027. As a result of technological advancements, the demand for consumer electronics is expected to rise during the forecast period. For instance, the global consumer electronics industry is projected to witness a revenue reach of around USD 904.6 billion in 2027, compared to USD 719.1 billion in 2023. As a result, technological development is projected to lead the demand for electrical and electronic products during the forecast period.

Understand The Key Trends Shaping This Market
Download PDF
OTHER KEY INDUSTRY TRENDS COVERED IN THE REPORT
- Fast-paced growth of aviation industry and increased aircraft contracts may aid market growth
- Fast-paced urbanization and investments in Asia-Pacific region may boost the industry
- Growing demand for electric vehicles may boost automobile industry growth
- Demand for flexible packaging from the food and beverage industry boosting market growth
Segment Analysis: End User Industry
Electrical and Electronics Segment in PBT Market
The electrical and electronics industry represents the dominant segment in the global polybutylene terephthalate (PBT) market, accounting for approximately 53% of the total market value in 2024. This substantial market share can be attributed to PBT's extensive use in manufacturing circuit breakers, cable liners, switches, connectors, and chip sockets due to its high electrical resistance and dielectric strength properties. The segment's growth is driven by emerging trends like digitalization, robotics, virtual reality, augmented reality, IoT (Internet of Things), and 5G connectivity, which are increasing the demand for electronic devices globally. The electrical and electronics segment is also experiencing the fastest growth trajectory, expected to grow at around 7% CAGR from 2024 to 2029, supported by the rising global demand for consumer electronics and the continuous advancement in technology applications.
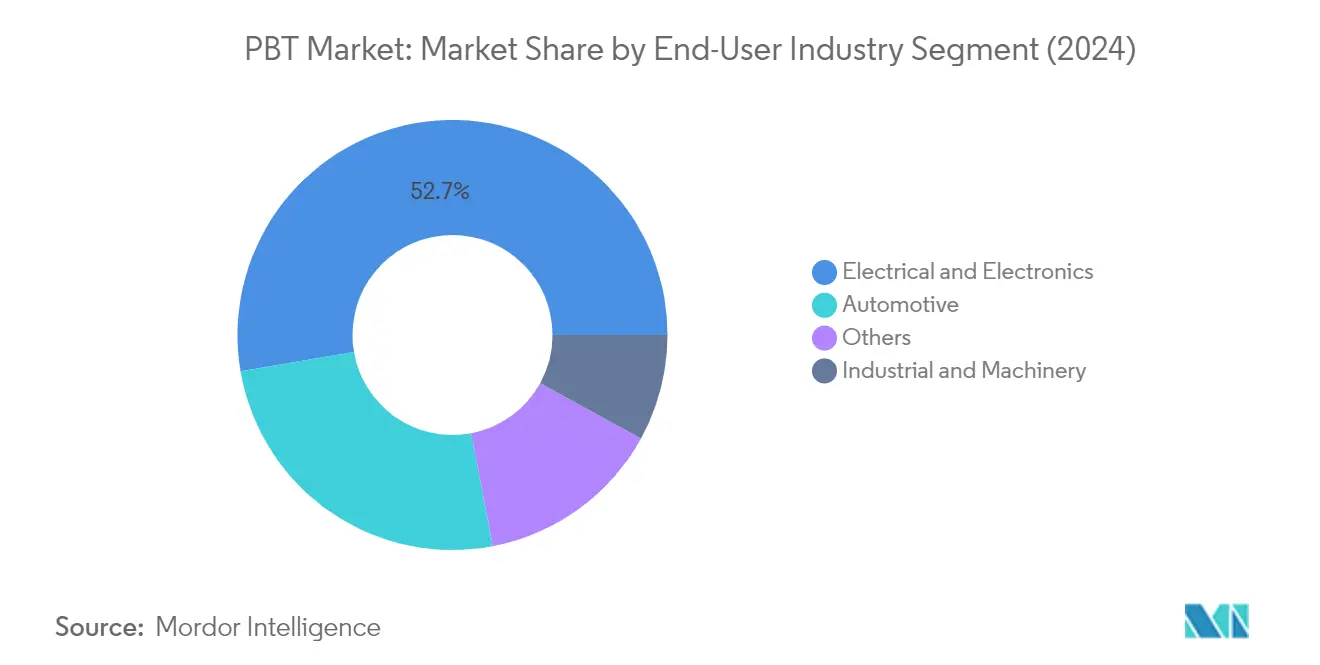
Remaining Segments in End User Industry
The automotive sector represents the second-largest application segment for PBT, where the material is extensively utilized in headlamps, powertrains, windshield wiper covers, and fuel system components due to its high mechanical properties and superior chemical resistance. The industrial and machinery segment utilizes PBT plastic in various applications such as fluorescent lamp bases, streetlamp reflectors, pump housings and impellers, and filter media, benefiting from the material's high strength, stiffness, and practical impact properties. Other end-user industries, including consumer goods, medical devices, locomotive, and shipbuilding sectors, also contribute significantly to the market, particularly in applications such as injection molded connectors, pulse oximeters, tips for electrosurgical instruments, and clips for breathing masks. These diverse PBT applications underscore the versatility and demand in the polybutylene terephthalate market.
Polybutylene Terephthalate (PBT) Market Geography Segment Analysis
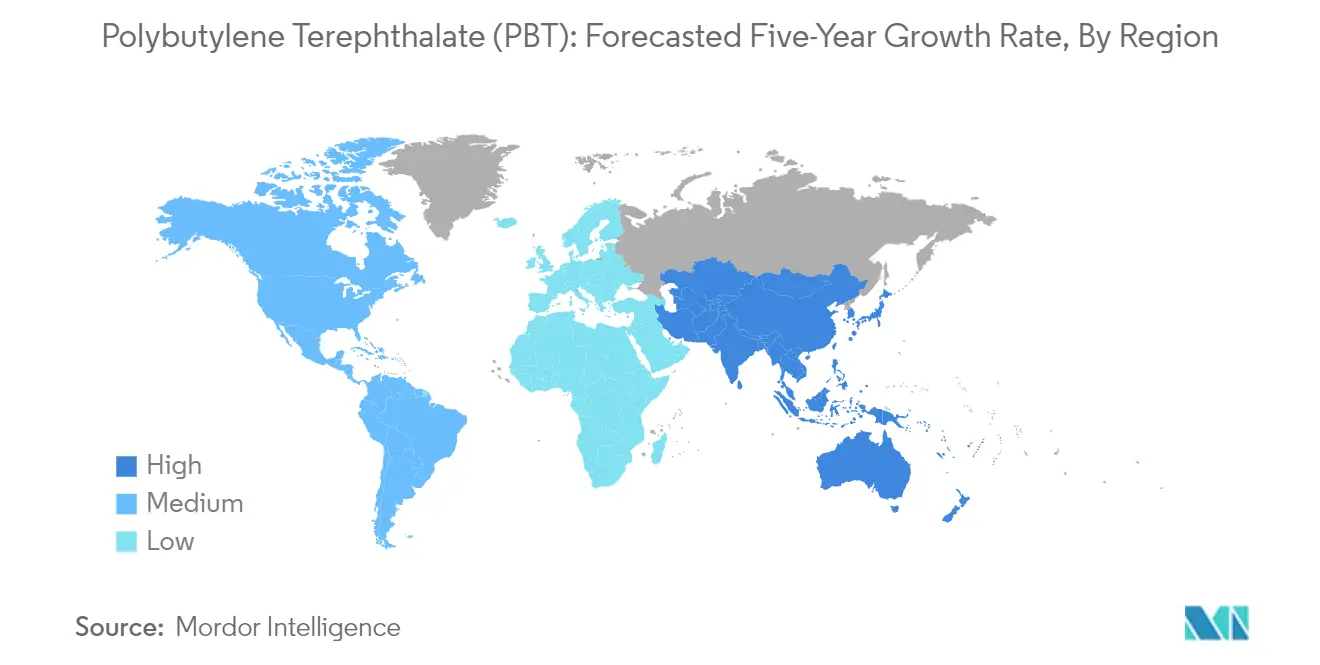
Polybutylene Terephthalate Market in Africa
The African polybutylene terephthalate market shows significant potential across various industrial applications. The region's market dynamics are primarily influenced by developments in South Africa and Nigeria, with these countries exhibiting distinct patterns of consumption and growth. The market is characterized by increasing investments in automotive manufacturing and electrical/electronics production, particularly in South Africa's industrial corridors and Nigeria's emerging manufacturing sector. Both countries are experiencing a gradual shift toward advanced materials in their manufacturing processes, driving the demand for engineering plastics like PBT.
Polybutylene Terephthalate Market in South Africa
South Africa stands as the dominant force in Africa's PBT market, holding approximately 36% of the regional consumption in 2024. The country's robust automotive sector serves as the primary driver, accounting for more than half of the nation's PBT consumption. The implementation of the Automotive Production Development Program has been instrumental in stimulating local production of automotive components, while maintaining incentives for OEMs to manufacture passenger cars and light commercial vehicles for both export and local markets. The country's established industrial infrastructure and strategic location have made it an attractive hub for PBT applications in various end-use industries.
Polybutylene Terephthalate Market in Nigeria
Nigeria emerges as the fastest-growing market in the African region, with a projected growth rate of approximately 7% during 2024-2029. The country's growth trajectory is primarily driven by rapid industrialization and increasing investments in the electrical and electronics sector. The government's focus on localizing manufacturing operations and developing industrial capabilities has created new opportunities for PBT applications. The expansion of consumer electronics manufacturing and increasing automotive assembly operations are contributing to the growing demand for high-performance engineering plastics in the country, attracting interest from PBT suppliers.
Get Analysis on Important Geographic Markets
Download PDF
Polybutylene Terephthalate (PBT) Industry Overview
Top Companies in Polybutylene Terephthalate (PBT) Market
Leading PBT manufacturers are actively pursuing product innovation and strategic expansion to strengthen their market positions. Companies are focusing on developing specialized grades with enhanced properties for emerging applications in the electronics and automotive sectors. Operational agility is demonstrated through continuous capacity expansions, particularly in high-growth regions like Asia-Pacific. Strategic moves include establishing new production facilities, upgrading existing plants, and forming partnerships with regional distributors. Many players are investing in research and development to create sustainable and eco-friendly polybutylene terephthalate variants, including recycled content products. The industry is witnessing an increased focus on vertical integration to ensure raw material security and cost optimization. Companies are also expanding their global footprint through strategic alliances and distribution network enhancements.
Consolidated Market Led By Global Players
The global PBT market exhibits a semi-consolidated structure dominated by large chemical conglomerates with diverse product portfolios. Major players leverage their extensive manufacturing capabilities, established distribution networks, and strong research and development infrastructure to maintain market leadership. These companies typically operate through multiple subsidiaries and joint ventures across different regions, enabling them to serve various end-user industries effectively. The market features a mix of integrated manufacturers who produce their own raw materials and specialized producers focusing solely on PBT and its compounds.
The competitive landscape is characterized by the presence of both global chemical giants and regional specialists, with Asian manufacturers increasingly gaining prominence. Market consolidation is driven by vertical integration strategies and the need for economies of scale. While mergers and acquisitions activity remains moderate, companies are more focused on organic growth through capacity expansions and technology upgrades. Joint ventures and strategic partnerships are common, particularly in emerging markets, as companies seek to strengthen their regional presence and access new customer bases.
Innovation and Sustainability Drive Future Success
For incumbent players to maintain and expand their market share, a focus on technological innovation and sustainable product development is crucial. Companies need to invest in developing high-performance grades that meet evolving industry requirements, particularly in emerging applications like electric vehicles and 5G infrastructure. Building strong relationships with key end-users through technical support and customized solutions is essential. Establishing efficient supply chains and maintaining cost competitiveness through operational excellence and raw material security will be critical success factors. Companies must also focus on sustainability initiatives and circular economy solutions to address growing environmental concerns.
New entrants and challenger companies can gain ground by focusing on specialized applications and underserved market segments. Developing innovative products for specific end-use applications and establishing strong technical capabilities will be key differentiators. Companies need to build robust distribution networks and maintain close relationships with end-users to understand and address their specific requirements. Geographic expansion strategies should focus on high-growth regions and emerging markets where demand is increasing. Success will also depend on the ability to navigate regulatory requirements, particularly regarding environmental standards and recycling initiatives, while maintaining cost competitiveness through efficient operations and strategic sourcing.
Polybutylene Terephthalate (PBT) Market Leaders
-
BASF SE
-
Chang Chun Group
-
Hengli Group Co., Ltd.
-
SABIC
-
Wuxi Xingsheng New Material Technology Co.,Ltd
- *Disclaimer: Major Players sorted in no particular order
Market/1708339585861_PolybutyleneTerephthalate(PBT)Market_market_concentration.svg)
Need More Details on Market Players and Competitors?
Download PDF
Polybutylene Terephthalate (PBT) Market News
- May 2022: BASF SE launched polybutylene terephthalate (PBT) ultradur B4335G3 HR HSP, which protects sensitive electronics in harsh environments.
- April 2022: Daicel Corporation introduced a new grade of PBT resin with extremely high laser transmittance and superior laser weldability suitable for automotive sensors, actuators, and other parts.
- February 2022: BASF SE announced that it would expand the production capacity of its ultramid polyamide (PA) and ultradur polybutylene terephthalate (PBT) products by 5,000 metric tons per year in Pasir Gudang, Malaysia.
Free With This Report
We provide a complimentary and exhaustive set of data points on global and regional metrics that present the fundamental structure of the industry. Presented in the form of 15+ free charts, the section covers rare data on various end-user production trends including passenger vehicle production, commercial vehicle production, motorcycle production, aerospace components production, electrical and electronics production, and regional data for engineering plastics demand etc.


Polybutylene Terephthalate (PBT) Market Report - Table of Contents
1. EXECUTIVE SUMMARY & KEY FINDINGS
2. REPORT OFFERS
3. INTRODUCTION
- 3.1 Study Assumptions & Market Definition
- 3.2 Scope of the Study
- 3.3 Research Methodology
4. KEY INDUSTRY TRENDS
-
4.1 End User Trends
- 4.1.1 Aerospace
- 4.1.2 Automotive
- 4.1.3 Building and Construction
- 4.1.4 Electrical and Electronics
- 4.1.5 Packaging
-
4.2 Regulatory Framework
- 4.2.1 Argentina
- 4.2.2 Australia
- 4.2.3 Brazil
- 4.2.4 Canada
- 4.2.5 China
- 4.2.6 EU
- 4.2.7 India
- 4.2.8 Japan
- 4.2.9 Malaysia
- 4.2.10 Mexico
- 4.2.11 Nigeria
- 4.2.12 Russia
- 4.2.13 Saudi Arabia
- 4.2.14 South Africa
- 4.2.15 South Korea
- 4.2.16 United Arab Emirates
- 4.2.17 United Kingdom
- 4.2.18 United States
- 4.3 Value Chain & Distribution Channel Analysis
5. MARKET SEGMENTATION (includes market size in Value in USD and Volume, Forecasts up to 2029 and analysis of growth prospects)
-
5.1 End User Industry
- 5.1.1 Automotive
- 5.1.2 Electrical and Electronics
- 5.1.3 Industrial and Machinery
- 5.1.4 Other End-user Industries
-
5.2 Region
- 5.2.1 Africa
- 5.2.1.1 By Country
- 5.2.1.1.1 Nigeria
- 5.2.1.1.2 South Africa
- 5.2.1.1.3 Rest of Africa
- 5.2.2 Asia-Pacific
- 5.2.2.1 By Country
- 5.2.2.1.1 Australia
- 5.2.2.1.2 China
- 5.2.2.1.3 India
- 5.2.2.1.4 Japan
- 5.2.2.1.5 Malaysia
- 5.2.2.1.6 South Korea
- 5.2.2.1.7 Rest of Asia-Pacific
- 5.2.3 Europe
- 5.2.3.1 By Country
- 5.2.3.1.1 France
- 5.2.3.1.2 Germany
- 5.2.3.1.3 Italy
- 5.2.3.1.4 Russia
- 5.2.3.1.5 United Kingdom
- 5.2.3.1.6 Rest of Europe
- 5.2.4 Middle East
- 5.2.4.1 By Country
- 5.2.4.1.1 Saudi Arabia
- 5.2.4.1.2 United Arab Emirates
- 5.2.4.1.3 Rest of Middle East
- 5.2.5 North America
- 5.2.5.1 By Country
- 5.2.5.1.1 Canada
- 5.2.5.1.2 Mexico
- 5.2.5.1.3 United States
- 5.2.6 South America
- 5.2.6.1 By Country
- 5.2.6.1.1 Argentina
- 5.2.6.1.2 Brazil
- 5.2.6.1.3 Rest of South America
6. COMPETITIVE LANDSCAPE
- 6.1 Key Strategic Moves
- 6.2 Market Share Analysis
- 6.3 Company Landscape
-
6.4 Company Profiles (includes Global Level Overview, Market Level Overview, Core Business Segments, Financials, Headcount, Key Information, Market Rank, Market Share, Products and Services, and Analysis of Recent Developments).
- 6.4.1 BASF SE
- 6.4.2 Chang Chun Group
- 6.4.3 China Petroleum & Chemical Corporation
- 6.4.4 Daicel Corporation
- 6.4.5 DuBay Polymer GmbH
- 6.4.6 Hengli Group Co., Ltd.
- 6.4.7 SABIC
- 6.4.8 Shinkong Synthetic Fibers Corp.
- 6.4.9 Toray Industries, Inc.
- 6.4.10 Wuxi Xingsheng New Material Technology Co.,Ltd
7. KEY STRATEGIC QUESTIONS FOR ENGINEERING PLASTICS CEOS
8. APPENDIX
-
8.1 Global Overview
- 8.1.1 Overview
- 8.1.2 Porter’s Five Forces Framework (Industry Attractiveness Analysis)
- 8.1.3 Global Value Chain Analysis
- 8.1.4 Market Dynamics (DROs)
- 8.2 Sources & References
- 8.3 List of Tables & Figures
- 8.4 Primary Insights
- 8.5 Data Pack
- 8.6 Glossary of Terms
You Can Purchase Parts Of This Report. Check Out Prices For Specific Sections
Get Price Break-up Now
List of Tables & Figures
- Figure 1:
- PRODUCTION REVENUE OF AEROSPACE COMPONENTS, USD, GLOBAL, 2017 - 2029
- Figure 2:
- PRODUCTION VOLUME OF AUTOMOBILES, UNITS, GLOBAL, 2017 - 2029
- Figure 3:
- FLOOR AREA OF NEW CONSTRUCTION, SQUARE FEET, GLOBAL, 2017 - 2029
- Figure 4:
- PRODUCTION REVENUE OF ELECTRICAL AND ELECTRONICS, USD, GLOBAL, 2017 - 2029
- Figure 5:
- PRODUCTION VOLUME OF PLASTIC PACKAGING, TONS, GLOBAL, 2017 - 2029
- Figure 6:
- VOLUME OF POLYBUTYLENE TEREPHTHALATE (PBT) CONSUMED, TONS, GLOBAL, 2017 - 2029
- Figure 7:
- VALUE OF POLYBUTYLENE TEREPHTHALATE (PBT) CONSUMED, USD, GLOBAL, 2017 - 2029
- Figure 8:
- VOLUME OF POLYBUTYLENE TEREPHTHALATE (PBT) CONSUMED BY END USER INDUSTRY, TONS, GLOBAL, 2017 - 2029
- Figure 9:
- VALUE OF POLYBUTYLENE TEREPHTHALATE (PBT) CONSUMED BY END USER INDUSTRY, USD, GLOBAL, 2017 - 2029
- Figure 10:
- VOLUME SHARE OF POLYBUTYLENE TEREPHTHALATE (PBT) CONSUMED BY END USER INDUSTRY, %, GLOBAL, 2017, 2023, AND 2029
- Figure 11:
- VALUE SHARE OF POLYBUTYLENE TEREPHTHALATE (PBT) CONSUMED BY END USER INDUSTRY, %, GLOBAL, 2017, 2023, AND 2029
- Figure 12:
- VOLUME OF POLYBUTYLENE TEREPHTHALATE (PBT) CONSUMED IN AUTOMOTIVE INDUSTRY, TONS, GLOBAL, 2017 - 2029
- Figure 13:
- VALUE OF POLYBUTYLENE TEREPHTHALATE (PBT) CONSUMED IN AUTOMOTIVE INDUSTRY, USD, GLOBAL, 2017 - 2029
- Figure 14:
- VALUE SHARE OF POLYBUTYLENE TEREPHTHALATE (PBT) CONSUMED IN AUTOMOTIVE INDUSTRY BY REGION, %, GLOBAL, 2022 VS 2029
- Figure 15:
- VOLUME OF POLYBUTYLENE TEREPHTHALATE (PBT) CONSUMED IN ELECTRICAL AND ELECTRONICS INDUSTRY, TONS, GLOBAL, 2017 - 2029
- Figure 16:
- VALUE OF POLYBUTYLENE TEREPHTHALATE (PBT) CONSUMED IN ELECTRICAL AND ELECTRONICS INDUSTRY, USD, GLOBAL, 2017 - 2029
- Figure 17:
- VALUE SHARE OF POLYBUTYLENE TEREPHTHALATE (PBT) CONSUMED IN ELECTRICAL AND ELECTRONICS INDUSTRY BY REGION, %, GLOBAL, 2022 VS 2029
- Figure 18:
- VOLUME OF POLYBUTYLENE TEREPHTHALATE (PBT) CONSUMED IN INDUSTRIAL AND MACHINERY INDUSTRY, TONS, GLOBAL, 2017 - 2029
- Figure 19:
- VALUE OF POLYBUTYLENE TEREPHTHALATE (PBT) CONSUMED IN INDUSTRIAL AND MACHINERY INDUSTRY, USD, GLOBAL, 2017 - 2029
- Figure 20:
- VALUE SHARE OF POLYBUTYLENE TEREPHTHALATE (PBT) CONSUMED IN INDUSTRIAL AND MACHINERY INDUSTRY BY REGION, %, GLOBAL, 2022 VS 2029
- Figure 21:
- VOLUME OF POLYBUTYLENE TEREPHTHALATE (PBT) CONSUMED IN OTHER END-USER INDUSTRIES INDUSTRY, TONS, GLOBAL, 2017 - 2029
- Figure 22:
- VALUE OF POLYBUTYLENE TEREPHTHALATE (PBT) CONSUMED IN OTHER END-USER INDUSTRIES INDUSTRY, USD, GLOBAL, 2017 - 2029
- Figure 23:
- VALUE SHARE OF POLYBUTYLENE TEREPHTHALATE (PBT) CONSUMED IN OTHER END-USER INDUSTRIES INDUSTRY BY REGION, %, GLOBAL, 2022 VS 2029
- Figure 24:
- VOLUME OF POLYBUTYLENE TEREPHTHALATE (PBT) CONSUMED BY REGION, TONS, GLOBAL, 2017 - 2029
- Figure 25:
- VALUE OF POLYBUTYLENE TEREPHTHALATE (PBT) CONSUMED BY REGION, USD, GLOBAL, 2017 - 2029
- Figure 26:
- VOLUME SHARE OF POLYBUTYLENE TEREPHTHALATE (PBT) CONSUMED BY REGION, %, GLOBAL, 2017, 2023, AND 2029
- Figure 27:
- VALUE SHARE OF POLYBUTYLENE TEREPHTHALATE (PBT) CONSUMED BY REGION, %, GLOBAL, 2017, 2023, AND 2029
- Figure 28:
- VOLUME OF POLYBUTYLENE TEREPHTHALATE (PBT) CONSUMED BY COUNTRY, TONS, AFRICA, 2017 - 2029
- Figure 29:
- VALUE OF POLYBUTYLENE TEREPHTHALATE (PBT) CONSUMED BY COUNTRY, USD, AFRICA, 2017 - 2029
- Figure 30:
- VOLUME SHARE OF POLYBUTYLENE TEREPHTHALATE (PBT) CONSUMED BY COUNTRY, %, AFRICA, 2017, 2023, AND 2029
- Figure 31:
- VALUE SHARE OF POLYBUTYLENE TEREPHTHALATE (PBT) CONSUMED BY COUNTRY, %, AFRICA, 2017, 2023, AND 2029
- Figure 32:
- VOLUME OF POLYBUTYLENE TEREPHTHALATE (PBT) CONSUMED, TONS, NIGERIA, 2017 - 2029
- Figure 33:
- VALUE OF POLYBUTYLENE TEREPHTHALATE (PBT) CONSUMED, USD, NIGERIA, 2017 - 2029
- Figure 34:
- VALUE SHARE OF POLYBUTYLENE TEREPHTHALATE (PBT) CONSUMED BY END USER INDUSTRY, %, NIGERIA, 2022 VS 2029
- Figure 35:
- VOLUME OF POLYBUTYLENE TEREPHTHALATE (PBT) CONSUMED, TONS, SOUTH AFRICA, 2017 - 2029
- Figure 36:
- VALUE OF POLYBUTYLENE TEREPHTHALATE (PBT) CONSUMED, USD, SOUTH AFRICA, 2017 - 2029
- Figure 37:
- VALUE SHARE OF POLYBUTYLENE TEREPHTHALATE (PBT) CONSUMED BY END USER INDUSTRY, %, SOUTH AFRICA, 2022 VS 2029
- Figure 38:
- VOLUME OF POLYBUTYLENE TEREPHTHALATE (PBT) CONSUMED, TONS, REST OF AFRICA, 2017 - 2029
- Figure 39:
- VALUE OF POLYBUTYLENE TEREPHTHALATE (PBT) CONSUMED, USD, REST OF AFRICA, 2017 - 2029
- Figure 40:
- VALUE SHARE OF POLYBUTYLENE TEREPHTHALATE (PBT) CONSUMED BY END USER INDUSTRY, %, REST OF AFRICA, 2022 VS 2029
- Figure 41:
- VOLUME OF POLYBUTYLENE TEREPHTHALATE (PBT) CONSUMED BY COUNTRY, TONS, ASIA-PACIFIC, 2017 - 2029
- Figure 42:
- VALUE OF POLYBUTYLENE TEREPHTHALATE (PBT) CONSUMED BY COUNTRY, USD, ASIA-PACIFIC, 2017 - 2029
- Figure 43:
- VOLUME SHARE OF POLYBUTYLENE TEREPHTHALATE (PBT) CONSUMED BY COUNTRY, %, ASIA-PACIFIC, 2017, 2023, AND 2029
- Figure 44:
- VALUE SHARE OF POLYBUTYLENE TEREPHTHALATE (PBT) CONSUMED BY COUNTRY, %, ASIA-PACIFIC, 2017, 2023, AND 2029
- Figure 45:
- VOLUME OF POLYBUTYLENE TEREPHTHALATE (PBT) CONSUMED, TONS, AUSTRALIA, 2017 - 2029
- Figure 46:
- VALUE OF POLYBUTYLENE TEREPHTHALATE (PBT) CONSUMED, USD, AUSTRALIA, 2017 - 2029
- Figure 47:
- VALUE SHARE OF POLYBUTYLENE TEREPHTHALATE (PBT) CONSUMED BY END USER INDUSTRY, %, AUSTRALIA, 2022 VS 2029
- Figure 48:
- VOLUME OF POLYBUTYLENE TEREPHTHALATE (PBT) CONSUMED, TONS, CHINA, 2017 - 2029
- Figure 49:
- VALUE OF POLYBUTYLENE TEREPHTHALATE (PBT) CONSUMED, USD, CHINA, 2017 - 2029
- Figure 50:
- VALUE SHARE OF POLYBUTYLENE TEREPHTHALATE (PBT) CONSUMED BY END USER INDUSTRY, %, CHINA, 2022 VS 2029
- Figure 51:
- VOLUME OF POLYBUTYLENE TEREPHTHALATE (PBT) CONSUMED, TONS, INDIA, 2017 - 2029
- Figure 52:
- VALUE OF POLYBUTYLENE TEREPHTHALATE (PBT) CONSUMED, USD, INDIA, 2017 - 2029
- Figure 53:
- VALUE SHARE OF POLYBUTYLENE TEREPHTHALATE (PBT) CONSUMED BY END USER INDUSTRY, %, INDIA, 2022 VS 2029
- Figure 54:
- VOLUME OF POLYBUTYLENE TEREPHTHALATE (PBT) CONSUMED, TONS, JAPAN, 2017 - 2029
- Figure 55:
- VALUE OF POLYBUTYLENE TEREPHTHALATE (PBT) CONSUMED, USD, JAPAN, 2017 - 2029
- Figure 56:
- VALUE SHARE OF POLYBUTYLENE TEREPHTHALATE (PBT) CONSUMED BY END USER INDUSTRY, %, JAPAN, 2022 VS 2029
- Figure 57:
- VOLUME OF POLYBUTYLENE TEREPHTHALATE (PBT) CONSUMED, TONS, MALAYSIA, 2017 - 2029
- Figure 58:
- VALUE OF POLYBUTYLENE TEREPHTHALATE (PBT) CONSUMED, USD, MALAYSIA, 2017 - 2029
- Figure 59:
- VALUE SHARE OF POLYBUTYLENE TEREPHTHALATE (PBT) CONSUMED BY END USER INDUSTRY, %, MALAYSIA, 2022 VS 2029
- Figure 60:
- VOLUME OF POLYBUTYLENE TEREPHTHALATE (PBT) CONSUMED, TONS, SOUTH KOREA, 2017 - 2029
- Figure 61:
- VALUE OF POLYBUTYLENE TEREPHTHALATE (PBT) CONSUMED, USD, SOUTH KOREA, 2017 - 2029
- Figure 62:
- VALUE SHARE OF POLYBUTYLENE TEREPHTHALATE (PBT) CONSUMED BY END USER INDUSTRY, %, SOUTH KOREA, 2022 VS 2029
- Figure 63:
- VOLUME OF POLYBUTYLENE TEREPHTHALATE (PBT) CONSUMED, TONS, REST OF ASIA-PACIFIC, 2017 - 2029
- Figure 64:
- VALUE OF POLYBUTYLENE TEREPHTHALATE (PBT) CONSUMED, USD, REST OF ASIA-PACIFIC, 2017 - 2029
- Figure 65:
- VALUE SHARE OF POLYBUTYLENE TEREPHTHALATE (PBT) CONSUMED BY END USER INDUSTRY, %, REST OF ASIA-PACIFIC, 2022 VS 2029
- Figure 66:
- VOLUME OF POLYBUTYLENE TEREPHTHALATE (PBT) CONSUMED BY COUNTRY, TONS, EUROPE, 2017 - 2029
- Figure 67:
- VALUE OF POLYBUTYLENE TEREPHTHALATE (PBT) CONSUMED BY COUNTRY, USD, EUROPE, 2017 - 2029
- Figure 68:
- VOLUME SHARE OF POLYBUTYLENE TEREPHTHALATE (PBT) CONSUMED BY COUNTRY, %, EUROPE, 2017, 2023, AND 2029
- Figure 69:
- VALUE SHARE OF POLYBUTYLENE TEREPHTHALATE (PBT) CONSUMED BY COUNTRY, %, EUROPE, 2017, 2023, AND 2029
- Figure 70:
- VOLUME OF POLYBUTYLENE TEREPHTHALATE (PBT) CONSUMED, TONS, FRANCE, 2017 - 2029
- Figure 71:
- VALUE OF POLYBUTYLENE TEREPHTHALATE (PBT) CONSUMED, USD, FRANCE, 2017 - 2029
- Figure 72:
- VALUE SHARE OF POLYBUTYLENE TEREPHTHALATE (PBT) CONSUMED BY END USER INDUSTRY, %, FRANCE, 2022 VS 2029
- Figure 73:
- VOLUME OF POLYBUTYLENE TEREPHTHALATE (PBT) CONSUMED, TONS, GERMANY, 2017 - 2029
- Figure 74:
- VALUE OF POLYBUTYLENE TEREPHTHALATE (PBT) CONSUMED, USD, GERMANY, 2017 - 2029
- Figure 75:
- VALUE SHARE OF POLYBUTYLENE TEREPHTHALATE (PBT) CONSUMED BY END USER INDUSTRY, %, GERMANY, 2022 VS 2029
- Figure 76:
- VOLUME OF POLYBUTYLENE TEREPHTHALATE (PBT) CONSUMED, TONS, ITALY, 2017 - 2029
- Figure 77:
- VALUE OF POLYBUTYLENE TEREPHTHALATE (PBT) CONSUMED, USD, ITALY, 2017 - 2029
- Figure 78:
- VALUE SHARE OF POLYBUTYLENE TEREPHTHALATE (PBT) CONSUMED BY END USER INDUSTRY, %, ITALY, 2022 VS 2029
- Figure 79:
- VOLUME OF POLYBUTYLENE TEREPHTHALATE (PBT) CONSUMED, TONS, RUSSIA, 2017 - 2029
- Figure 80:
- VALUE OF POLYBUTYLENE TEREPHTHALATE (PBT) CONSUMED, USD, RUSSIA, 2017 - 2029
- Figure 81:
- VALUE SHARE OF POLYBUTYLENE TEREPHTHALATE (PBT) CONSUMED BY END USER INDUSTRY, %, RUSSIA, 2022 VS 2029
- Figure 82:
- VOLUME OF POLYBUTYLENE TEREPHTHALATE (PBT) CONSUMED, TONS, UNITED KINGDOM, 2017 - 2029
- Figure 83:
- VALUE OF POLYBUTYLENE TEREPHTHALATE (PBT) CONSUMED, USD, UNITED KINGDOM, 2017 - 2029
- Figure 84:
- VALUE SHARE OF POLYBUTYLENE TEREPHTHALATE (PBT) CONSUMED BY END USER INDUSTRY, %, UNITED KINGDOM, 2022 VS 2029
- Figure 85:
- VOLUME OF POLYBUTYLENE TEREPHTHALATE (PBT) CONSUMED, TONS, REST OF EUROPE, 2017 - 2029
- Figure 86:
- VALUE OF POLYBUTYLENE TEREPHTHALATE (PBT) CONSUMED, USD, REST OF EUROPE, 2017 - 2029
- Figure 87:
- VALUE SHARE OF POLYBUTYLENE TEREPHTHALATE (PBT) CONSUMED BY END USER INDUSTRY, %, REST OF EUROPE, 2022 VS 2029
- Figure 88:
- VOLUME OF POLYBUTYLENE TEREPHTHALATE (PBT) CONSUMED BY COUNTRY, TONS, MIDDLE EAST, 2017 - 2029
- Figure 89:
- VALUE OF POLYBUTYLENE TEREPHTHALATE (PBT) CONSUMED BY COUNTRY, USD, MIDDLE EAST, 2017 - 2029
- Figure 90:
- VOLUME SHARE OF POLYBUTYLENE TEREPHTHALATE (PBT) CONSUMED BY COUNTRY, %, MIDDLE EAST, 2017, 2023, AND 2029
- Figure 91:
- VALUE SHARE OF POLYBUTYLENE TEREPHTHALATE (PBT) CONSUMED BY COUNTRY, %, MIDDLE EAST, 2017, 2023, AND 2029
- Figure 92:
- VOLUME OF POLYBUTYLENE TEREPHTHALATE (PBT) CONSUMED, TONS, SAUDI ARABIA, 2017 - 2029
- Figure 93:
- VALUE OF POLYBUTYLENE TEREPHTHALATE (PBT) CONSUMED, USD, SAUDI ARABIA, 2017 - 2029
- Figure 94:
- VALUE SHARE OF POLYBUTYLENE TEREPHTHALATE (PBT) CONSUMED BY END USER INDUSTRY, %, SAUDI ARABIA, 2022 VS 2029
- Figure 95:
- VOLUME OF POLYBUTYLENE TEREPHTHALATE (PBT) CONSUMED, TONS, UNITED ARAB EMIRATES, 2017 - 2029
- Figure 96:
- VALUE OF POLYBUTYLENE TEREPHTHALATE (PBT) CONSUMED, USD, UNITED ARAB EMIRATES, 2017 - 2029
- Figure 97:
- VALUE SHARE OF POLYBUTYLENE TEREPHTHALATE (PBT) CONSUMED BY END USER INDUSTRY, %, UNITED ARAB EMIRATES, 2022 VS 2029
- Figure 98:
- VOLUME OF POLYBUTYLENE TEREPHTHALATE (PBT) CONSUMED, TONS, REST OF MIDDLE EAST, 2017 - 2029
- Figure 99:
- VALUE OF POLYBUTYLENE TEREPHTHALATE (PBT) CONSUMED, USD, REST OF MIDDLE EAST, 2017 - 2029
- Figure 100:
- VALUE SHARE OF POLYBUTYLENE TEREPHTHALATE (PBT) CONSUMED BY END USER INDUSTRY, %, REST OF MIDDLE EAST, 2022 VS 2029
- Figure 101:
- VOLUME OF POLYBUTYLENE TEREPHTHALATE (PBT) CONSUMED BY COUNTRY, TONS, NORTH AMERICA, 2017 - 2029
- Figure 102:
- VALUE OF POLYBUTYLENE TEREPHTHALATE (PBT) CONSUMED BY COUNTRY, USD, NORTH AMERICA, 2017 - 2029
- Figure 103:
- VOLUME SHARE OF POLYBUTYLENE TEREPHTHALATE (PBT) CONSUMED BY COUNTRY, %, NORTH AMERICA, 2017, 2023, AND 2029
- Figure 104:
- VALUE SHARE OF POLYBUTYLENE TEREPHTHALATE (PBT) CONSUMED BY COUNTRY, %, NORTH AMERICA, 2017, 2023, AND 2029
- Figure 105:
- VOLUME OF POLYBUTYLENE TEREPHTHALATE (PBT) CONSUMED, TONS, CANADA, 2017 - 2029
- Figure 106:
- VALUE OF POLYBUTYLENE TEREPHTHALATE (PBT) CONSUMED, USD, CANADA, 2017 - 2029
- Figure 107:
- VALUE SHARE OF POLYBUTYLENE TEREPHTHALATE (PBT) CONSUMED BY END USER INDUSTRY, %, CANADA, 2022 VS 2029
- Figure 108:
- VOLUME OF POLYBUTYLENE TEREPHTHALATE (PBT) CONSUMED, TONS, MEXICO, 2017 - 2029
- Figure 109:
- VALUE OF POLYBUTYLENE TEREPHTHALATE (PBT) CONSUMED, USD, MEXICO, 2017 - 2029
- Figure 110:
- VALUE SHARE OF POLYBUTYLENE TEREPHTHALATE (PBT) CONSUMED BY END USER INDUSTRY, %, MEXICO, 2022 VS 2029
- Figure 111:
- VOLUME OF POLYBUTYLENE TEREPHTHALATE (PBT) CONSUMED, TONS, UNITED STATES, 2017 - 2029
- Figure 112:
- VALUE OF POLYBUTYLENE TEREPHTHALATE (PBT) CONSUMED, USD, UNITED STATES, 2017 - 2029
- Figure 113:
- VALUE SHARE OF POLYBUTYLENE TEREPHTHALATE (PBT) CONSUMED BY END USER INDUSTRY, %, UNITED STATES, 2022 VS 2029
- Figure 114:
- VOLUME OF POLYBUTYLENE TEREPHTHALATE (PBT) CONSUMED BY COUNTRY, TONS, SOUTH AMERICA, 2017 - 2029
- Figure 115:
- VALUE OF POLYBUTYLENE TEREPHTHALATE (PBT) CONSUMED BY COUNTRY, USD, SOUTH AMERICA, 2017 - 2029
- Figure 116:
- VOLUME SHARE OF POLYBUTYLENE TEREPHTHALATE (PBT) CONSUMED BY COUNTRY, %, SOUTH AMERICA, 2017, 2023, AND 2029
- Figure 117:
- VALUE SHARE OF POLYBUTYLENE TEREPHTHALATE (PBT) CONSUMED BY COUNTRY, %, SOUTH AMERICA, 2017, 2023, AND 2029
- Figure 118:
- VOLUME OF POLYBUTYLENE TEREPHTHALATE (PBT) CONSUMED, TONS, ARGENTINA, 2017 - 2029
- Figure 119:
- VALUE OF POLYBUTYLENE TEREPHTHALATE (PBT) CONSUMED, USD, ARGENTINA, 2017 - 2029
- Figure 120:
- VALUE SHARE OF POLYBUTYLENE TEREPHTHALATE (PBT) CONSUMED BY END USER INDUSTRY, %, ARGENTINA, 2022 VS 2029
- Figure 121:
- VOLUME OF POLYBUTYLENE TEREPHTHALATE (PBT) CONSUMED, TONS, BRAZIL, 2017 - 2029
- Figure 122:
- VALUE OF POLYBUTYLENE TEREPHTHALATE (PBT) CONSUMED, USD, BRAZIL, 2017 - 2029
- Figure 123:
- VALUE SHARE OF POLYBUTYLENE TEREPHTHALATE (PBT) CONSUMED BY END USER INDUSTRY, %, BRAZIL, 2022 VS 2029
- Figure 124:
- VOLUME OF POLYBUTYLENE TEREPHTHALATE (PBT) CONSUMED, TONS, REST OF SOUTH AMERICA, 2017 - 2029
- Figure 125:
- VALUE OF POLYBUTYLENE TEREPHTHALATE (PBT) CONSUMED, USD, REST OF SOUTH AMERICA, 2017 - 2029
- Figure 126:
- VALUE SHARE OF POLYBUTYLENE TEREPHTHALATE (PBT) CONSUMED BY END USER INDUSTRY, %, REST OF SOUTH AMERICA, 2022 VS 2029
- Figure 127:
- MOST ACTIVE COMPANIES BY NUMBER OF STRATEGIC MOVES, GLOBAL, 2019 - 2021
- Figure 128:
- MOST ADOPTED STRATEGIES, COUNT, GLOBAL, 2019 - 2021
- Figure 129:
- PRODUCTION CAPACITY SHARE OF POLYBUTYLENE TEREPHTHALATE (PBT) BY MAJOR PLAYERS, %, GLOBAL, 2022
Polybutylene Terephthalate (PBT) Industry Segmentation
Automotive, Electrical and Electronics, Industrial and Machinery are covered as segments by End User Industry. Africa, Asia-Pacific, Europe, Middle East, North America, South America are covered as segments by Region.| End User Industry | Automotive | |||
| Electrical and Electronics | ||||
| Industrial and Machinery | ||||
| Other End-user Industries | ||||
| Region | Africa | By Country | Nigeria | |
| South Africa | ||||
| Rest of Africa | ||||
| Asia-Pacific | By Country | Australia | ||
| China | ||||
| India | ||||
| Japan | ||||
| Malaysia | ||||
| South Korea | ||||
| Rest of Asia-Pacific | ||||
| Europe | By Country | France | ||
| Germany | ||||
| Italy | ||||
| Russia | ||||
| United Kingdom | ||||
| Rest of Europe | ||||
| Middle East | By Country | Saudi Arabia | ||
| United Arab Emirates | ||||
| Rest of Middle East | ||||
| North America | By Country | Canada | ||
| Mexico | ||||
| United States | ||||
| South America | By Country | Argentina | ||
| Brazil | ||||
| Rest of South America | ||||
Need A Different Region or Segment?
Customize Now
Market Definition
- End-user Industry - Automotive, Industrial Machinery, Electrical & Electronics, and Others are the end-user industries considered under the polybutylene terephthalate market.
- Resin - Under the scope of the study, virgin polybutylene terephthalate resin in the primary forms such as powder, pellet, etc. are considered.
| Keyword | Definition |
|---|---|
| Acetal | This is a rigid material that has a slippery surface. It can easily withstand wear and tear in abusive work environments. This polymer is used for building applications such as gears, bearings, valve components, etc. |
| Acrylic | This synthetic resin is a derivative of acrylic acid. It forms a smooth surface and is mainly used for various indoor applications. The material can also be used for outdoor applications with a special formulation. |
| Cast film | A cast film is made by depositing a layer of plastic onto a surface then solidifying and removing the film from that surface. The plastic layer can be in molten form, in a solution, or in dispersion. |
| Colorants & Pigments | Colorants & Pigments are additives used to change the color of the plastic. They can be a powder or a resin/color premix. |
| Composite material | A composite material is a material that is produced from two or more constituent materials. These constituent materials have dissimilar chemical or physical properties and are merged to create a material with properties unlike the individual elements. |
| Degree of Polymerization (DP) | The number of monomeric units in a macromolecule, polymer, or oligomer molecule is referred to as the degree of polymerization or DP. Plastics with useful physical properties often have DPs in the thousands. |
| Dispersion | To create a suspension or solution of material in another substance, fine, agglomerated solid particles of one substance are dispersed in a liquid or another substance to form a dispersion. |
| Fiberglass | Fiberglass-reinforced plastic is a material made up of glass fibers embedded in a resin matrix. These materials have high tensile and impact strength. Handrails and platforms are two examples of lightweight structural applications that use standard fiberglass. |
| Fiber-reinforced polymer (FRP) | Fiber-reinforced polymer is a composite material made of a polymer matrix reinforced with fibers. The fibers are usually glass, carbon, aramid, or basalt. |
| Flake | This is a dry, peeled-off piece, usually with an uneven surface, and is the base of cellulosic plastics. |
| Fluoropolymers | This is a fluorocarbon-based polymer with multiple carbon-fluorine bonds. It is characterized by high resistance to solvents, acids, and bases. These materials are tough yet easy to machine. Some of the popular fluoropolymers are PTFE, ETFE, PVDF, PVF, etc. |
| Kevlar | Kevlar is the commonly referred name for aramid fiber, which was initially a Dupont brand for aramid fiber. Any group of lightweight, heat-resistant, solid, synthetic, aromatic polyamide materials that are fashioned into fibers, filaments, or sheets is called aramid fiber. They are classified into Para-aramid and Meta-aramid. |
| Laminate | A structure or surface composed of sequential layers of material bonded under pressure and heat to build up to the desired shape and width. |
| Nylon | They are synthetic fiber-forming polyamides formed into yarns and monofilaments. These fibers possess excellent tensile strength, durability, and elasticity. They have high melting points and can resist chemicals and various liquids. |
| PET preform | A preform is an intermediate product that is subsequently blown into a polyethylene terephthalate (PET) bottle or a container. |
| Plastic compounding | Compounding consists of preparing plastic formulations by mixing and/or blending polymers and additives in a molten state to achieve the desired characteristics. These blends are automatically dosed with fixed setpoints usually through feeders/hoppers. |
| Plastic pellets | Plastic pellets, also known as pre-production pellets or nurdles, are the building blocks for nearly every product made of plastic. |
| Polymerization | It is a chemical reaction of several monomer molecules to form polymer chains that form stable covalent bonds. |
| Styrene Copolymers | A copolymer is a polymer derived from more than one species of monomer, and a styrene copolymer is a chain of polymers consisting of styrene and acrylate. |
| Thermoplastics | Thermoplastics are defined as polymers that become soft material when it is heated and becomes hard when it is cooled. Thermoplastics have wide-ranging properties and can be remolded and recycled without affecting their physical properties. |
| Virgin Plastic | It is a basic form of plastic that has never been used, processed, or developed. It may be considered more valuable than recycled or already used materials. |
Need More Details on Market Definition?
Ask a Question
Research Methodology
Mordor Intelligence follows a four-step methodology in all our reports.
- Step-1: Identify Key Variables: The quantifiable key variables (industry and extraneous) pertaining to the specific product segment and country are selected from a group of relevant variables & factors based on desk research & literature review; along with primary expert inputs. These variables are further confirmed through regression modeling (wherever required).
- Step-2: Build a Market Model: In order to build a robust forecasting methodology, the variables and factors identified in Step-1 are tested against available historical market numbers. Through an iterative process, the variables required for market forecast are set and the model is built on the basis of these variables.
- Step-3: Validate and Finalize: In this important step, all market numbers, variables and analyst calls are validated through an extensive network of primary research experts from the market studied. The respondents are selected across levels and functions to generate a holistic picture of the market studied.
- Step-4: Research Outputs: Syndicated Reports, Custom Consulting Assignments, Databases & Subscription Platforms

Get More Details On Research Methodology
Download PDF


