
Market Overview
| Study Period | 2020 - 2031 |
|---|---|
| Forecast Data Period | 2026 - 2031 |
| Base Year Market Size (2025) | USD 26.57 Billion |
| Market Size (2026) | USD 28.28 Billion |
| Market Size (2031) | USD 38.65 Billion |
| Growth Rate (2026 - 2031) | 6.44 % |
| Market Concentration | Low |
Major Players *Disclaimer: Major Players sorted in no particular order Image © Mordor Intelligence. Reuse requires attribution under CC BY 4.0. | |
Poland Used Car Market Analysis by Mordor Intelligence
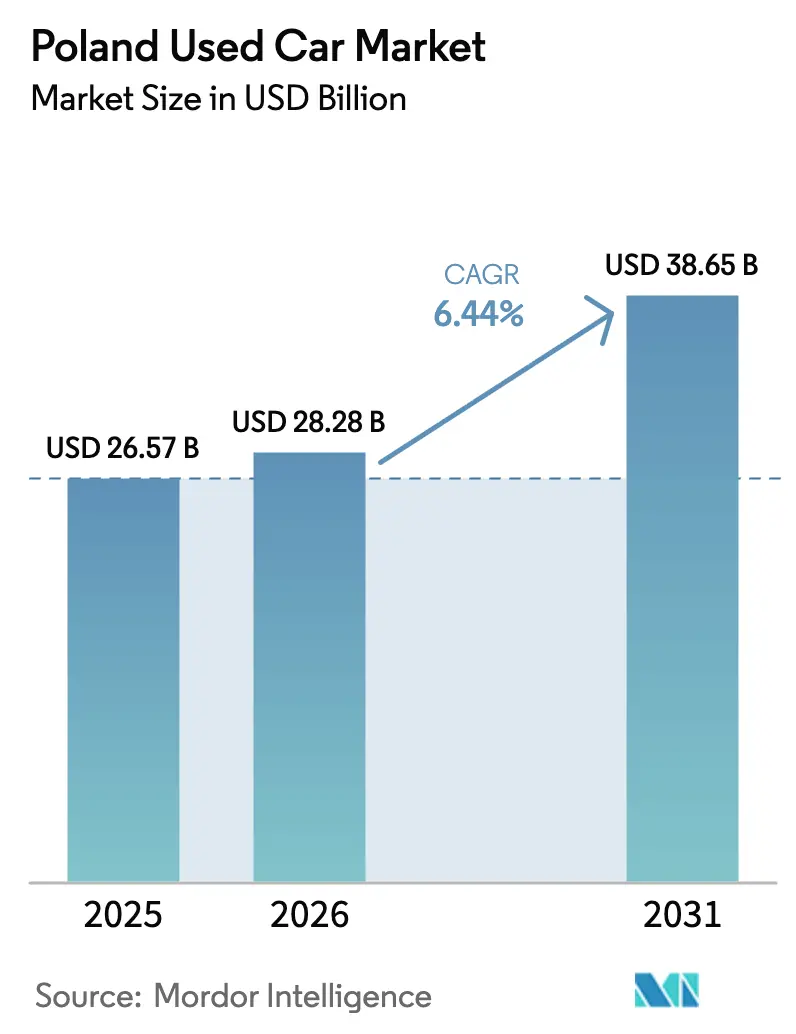
The Poland used car market size was valued at USD 26.57 billion in 2025 and estimated to grow from USD 28.28 billion in 2026 to reach USD 38.65 billion by 2031, at a CAGR of 6.44% during the forecast period (2026-2031). Robust demand originates from Poland’s dual role as Central Europe’s largest import gateway for aging EU vehicles and as a steadily expanding domestic consumption base. The widening price differential between new and used cars, fueled by Euro 7 compliance expenses, draws consumers’ attention to lower-priced options, whose median remained at PLN 32,900 in 2024. Digital channels reinforce expansion: online sales are rising materially ahead of offline growth, as platforms embed financing and logistics functions. Financing innovation, notably OTOMOTO Pay, sustains affordability while organized dealer consolidation lifts formal-channel credibility and customer confidence[1]The First News, “Euro-7 rush drives used-car imports,” thefirstnews.com.
Key Report Takeaways
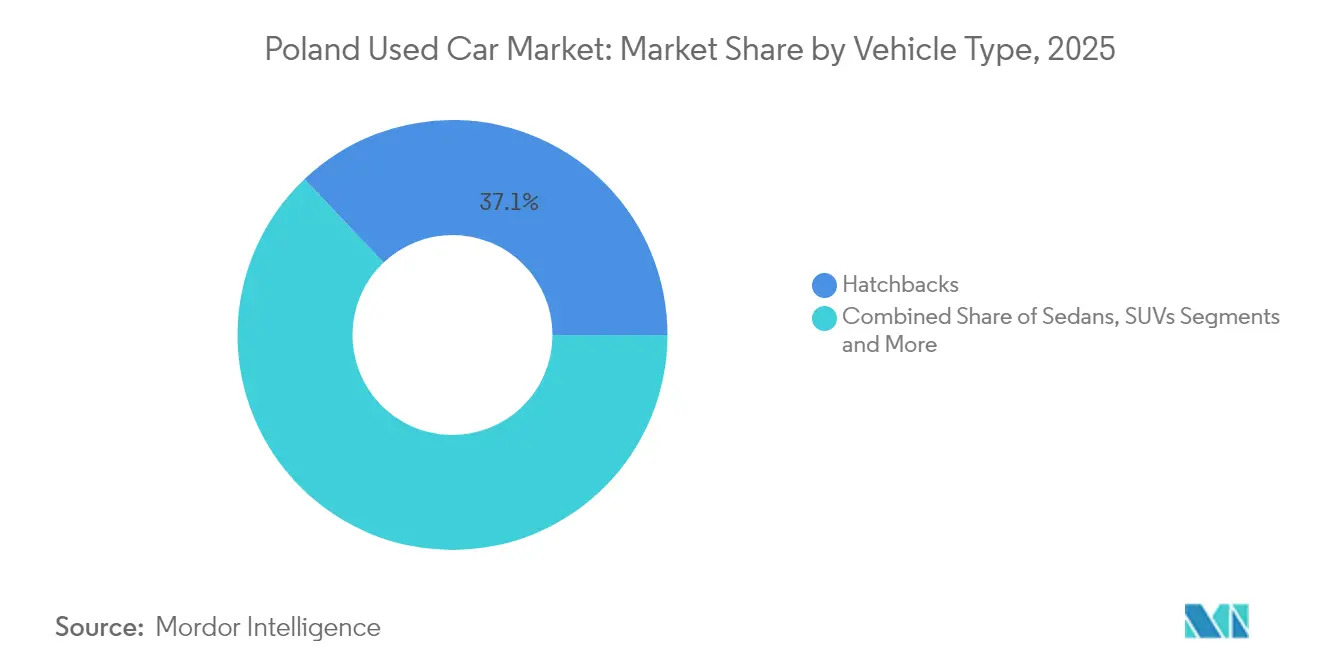
- By vehicle type, hatchbacks led with 37.10% of the Poland used car market share in 2025, while SUVs are projected to post the fastest 9.02% CAGR through 2031.
- By vendor type, the unorganized channel held 54.60% of the Poland used car market share in 2025; organized dealers are expected to expand at an 8.61% CAGR to 2031.
- By fuel type, petrol vehicles captured 63.75% of the Poland used car market share in 2025, whereas electric vehicles are set to record the highest 8.05% CAGR through 2031.
- By vehicle age, the 3-5 year bracket accounted for 47.20% of the Poland used car market share in 2025, while 0-2 year cars are forecast to climb at a 9.01% CAGR.
- By price segment, the USD 5,000-9,999 range led with 36.85% of the Poland used car market share in 2025; cars priced above USD 30,000 will likely achieve the quickest 8.55% CAGR.
- By sales channel, offline outlets controlled 58.60% of the Poland used car market share in 2025, yet online channels are on track for a 9.03% CAGR over the projection period.
Note: Market size and forecast figures in this report are generated using Mordor Intelligence’s proprietary estimation framework, updated with the latest available data and insights as of 2026.
Poland Used Car Market Trends and Insights
Drivers Impact Analysis*
| Driver | (~) Impact on CAGR Forecast | Geographic Relevance | Impact Timeline |
|---|---|---|---|
| Booming Import of Ageing EU Vehicles | +1.2% | National, with concentration in western border regions | Medium term (2-4 years) |
| Growing Price Gap Versus New-Car Market | +0.8% | National, strongest in urban centers | Short term (≤ 2 years) |
| Rapid Expansion of Digital Used-Car Platforms | +0.6% | National, led by Warsaw, Krakow, Gdansk | Medium term (2-4 years) |
| Affordable Financing & Subscription Models | +0.4% | National, with higher penetration in major cities | Long term (≥ 4 years) |
| Pre-Euro-7 Registration Rush Lifting Volumes | +0.3% | National, temporary boost effect | Short term (≤ 2 years) |
| "Subsidy-Arbitrage" Inflow of Second-Hand EVs | +0.2% | National, concentrated in affluent regions | Long term (≥ 4 years) |
| Source: Mordor Intelligence | |||
Booming Import of Ageing EU Vehicles
Poland’s location adjacent to Germany, France and Belgium channels a steady flow of older EU fleet cars into the Poland used car market. Most registered Polish cars now exceed 20 years, the highest proportion in the EU[2]MotoFakty, “Import samochodów używanych 2021,” motofakty.pl. Western European Low Emission Zones accelerate east-bound migration of diesel cars, reinforcing supply depth. As Euro 7 deadlines loom, sellers in origin markets offload older stock at discounted prices, keeping inventory plentiful and prices competitive. This supply loop sustains trade volumes along border regions before inventory radiates toward inland urban centers where demand density is highest.
Growing Price Gap Versus New-Car Market
Euro 7 and CAFE mandates have inflated new-car build costs and list prices, widening the value chasm that anchors consumers to the Poland used car market. New-car sticker inflation in 2024 contrasted with a stable PLN 32,900 median used-car price. Budget-conscious households gravitate to 3-5 year models offering modern safety equipment without the premium of factory-fresh units. The Clean Air for Europe program’s tougher CO₂ thresholds intensify this divergence, signalling further upside for pre-owned demand. Price arbitrage is most pronounced in metropolitan counties where disposable incomes lag EU averages, yet mobility expectations mirror Western norms.
Rapid Expansion of Digital Used-Car Platforms
Classified portals have evolved into end-to-end ecosystems that underwrite the Poland used car market’s online segment. OTOMOTO recorded 4,492 used EV listings by June 2024, rising 57% year-on-year[3]Obserwatorium Alternatywnych Paliw, “Raport rynku EV 2024,” obserwatorium-alternatywnych-paliw.p. Embedded payment and loan functions through OTOMOTO Pay compress transaction steps and shorten purchase cycles. Data-rich listings reduce information asymmetry that historically favored dealer forecourts. Younger cohorts, already conditioned by e-commerce norms, transfer their digital fluency to vehicle purchases, accelerating channel shift. Consolidation around leading platforms raises listing fees but improves reach, mirroring dynamics of mature classifieds sectors in Western Europe.
Affordable Financing and Subscription Models
A 0.5-point policy rate cut in 2025 lowered instalment costs, widening eligibility pools. Long-term rental fleets have expanded over the years, signalling acceptance of usage-based access over ownership. Subscription products from rental majors supply near-new units into the secondary market at contract end, refreshing inventory quality. Finance innovation, therefore, buttresses liquidity and cushions the Poland used car market against macro-rate volatility.
Restraints Impact Analysis*
| Restraint | (~) Impact on CAGR Forecast | Geographic Relevance | Impact Timeline |
|---|---|---|---|
| Tightening Emission-Zone Legislation | -0.7% | Urban centers, led by Warsaw, expanding to major cities | Medium term (2-4 years) |
| Persistent Odometer Fraud and Quality Opacity | -0.5% | National, particularly affecting cross-border transactions | Long term (≥ 4 years) |
| Prospective Excise-Tax Hike On Imports | -0.3% | National, with higher impact on lower-priced segments | Short term (≤ 2 years) |
| E10 Fuel-Compatibility Issues For Legacy ICEs | -0.2% | National, affecting vehicles manufactured before 2011 | Medium term (2-4 years) |
| Source: Mordor Intelligence | |||
Tightening Emission-Zone Legislation
Warsaw introduced Poland’s first Low Emission Zone (LEZ) in July 2024, barring high-polluting vehicles from core districts and levying fines for non-compliance. Additional municipalities plan similar measures, fragmenting resale liquidity for older diesels that form a large share of imports. Non-compliant stock shifts to peripheral counties, depressing residual values. Dealers curtail appetite for over-12-year inventory, trimming supply breadth. The policy simultaneously props up compliant sub-segments such as Euro 6 petrol and hybrid models, subtly re-shaping fleet composition inside the Poland used car market.
Persistent Odometer Fraud and Quality Opacity
Mileage tampering afflicts 12% of used cars traded domestically, with cross-border units facing up to 80% manipulation rates, costing consumers EUR 235 million yearly[4]European Parliament, “Odometer Manipulation in Motor Vehicles,” europarl.europa.eu. German premium marques see the highest distortion incidence. Fraud dampens buyer confidence, elongates due-diligence cycles and incentivises recourse to organized dealers able to guarantee provenance. Legislative moves toward EU-wide mileage databases raise compliance costs for informal traders. Quality opacity thus subtracts velocity from the Poland used car market, especially in the value-sensitive multi-owner tier.
*Our forecasts treat driver/restraint impacts as directional, not additive. The impact forecasts reflect baseline growth, mix effects, and variable interactions.
Segment Analysis
By Vehicle Type: SUVs Drive Preference Shift
The SUV cohort contributed a high-single-digit lift to the Poland used car market size, even though hatchbacks still supplied 37.10% of 2025 revenue. A 70-model SUV launch pipeline, with Toyota alone unveiling five derivatives, fuels the aftermarket inventory. Rising interest in higher seating positions and family-oriented practicality underpins demand.
SUV momentum permeates premium badges as consumers view crossovers as attainable status symbols. Sedans cede share to compact crossovers, while MPVs remain a limited-growth family niche. Due to corporate lessors' fast fleet churn, electric and hybrid SUV variants also join the secondary channel sooner. Consequently, the SUV trajectory is growing at 9.02% CAGR, poised to reinforce the Poland used car market’s upward value mix well beyond 2031.


By Vendor Type: Organized Dealers Gain Ground
Unorganized vendors handled 54.60% of 2025 turnover, yet organized dealers are expanding at an 8.61% CAGR - an advance enabled by scale investments such as AAA AUTO’s Piaseczno hub, which can hold 500 cars. Warranty provisioning, certified inspections, and bundled finance increase buyer trust.
Digital integration allows organized players to price dynamically and rotate stock faster than informal competitors. Volkswagen Group Polska’s nearly 200-location network underscores size advantages that attract new-to-market EV shoppers seeking technical guidance. As compliance requirements around mileage data tighten, scale players will likely deepen their grasp of the Poland used car market.
By Fuel Type: Electric Gains Despite Petrol Dominance
Petrol variants commanded a 63.75% share in 2025, courtesy of ubiquitous refuelling and lower maintenance anxiety. Electric vehicles, though still a sliver of the Poland used car market share, are forecast for an 8.05% CAGR, buoyed by listings surging.
Government incentives worth PLN 1.6 billion for zero-emission purchases enhance affordability and channel near-new BEVs into secondary circuits after fleet lease expiry. Diesel demand weakens under LEZ scrutiny, while E10 fuel compatibility concerns push owners of older petrol units toward younger stock. As infrastructure matures, electric penetration is set to carve a meaningful slice of the Poland used car market by decade’s end.
By Vehicle Age: Newer Cars Command Premium Growth
Cars aged 3-5 years held 47.20% of revenues in 2025, offering the ideal balance between depreciation and contemporary equipment. Meanwhile, 0-2 year models should post the highest 9.01% CAGR on aspirational lifts among urban households and corporate fleet rotations.
Regulatory tightening against older diesels shifts demand toward sub-eight-year brackets. Vehicles over 12 years migrate to rural counties where LEZ enforcement is minimal, diluting residual prices. Organized dealers channel ex-lease cars with transparent histories into city forecourts, anchoring the Poland used car market size at the higher end of the quality curve.
By Price Segment: Premium Tier Accelerates
Units priced USD 5,000-9,999 composed 36.85% of 2025 sales, mirroring national affordability thresholds. The premium slice above USD 30,000 is expected to grow at an 8.55% CAGR as wealth concentration progresses in metropolitan regions.
Rising accessibility of used EVs and luxury SUVs broadens the upper tier’s appeal. Mid-range brackets between USD 10,000 and USD 29,999 remain the Poland used car market’s volume backbone but face substitution from subscription models that package newer cars at predictable fees.

By Sales Channel: Digital Transformation Accelerates
Offline networks retained a 58.60% share in 2025, yet online platforms are on course for a 9.03% CAGR. Classified giants are morphing into fintech-enabled storefronts that cover payments, title transfer, and delivery, shrinking friction for cross-provincial purchases.
Hybrid models prevail: consumers shortlist vehicles online and finalise contracts in person, blending convenience with tactile assurance. Auction sites cater to trade buyers seeking diesel vans or fleet disposals. This omni-channel continuum cements the Poland used car market as a digitally mediated environment.
Geography Analysis
Mazowieckie province, anchored by Warsaw, contributes the largest slice of turnover thanks to above-average disposable income and the nation’s first LEZ rollout. Western border counties act as import funnels, offloading high-volume German stock before national redistribution.
The Łódź region saw a jump in new-car registrations in Q1 2025, indicating economic vigour that will channel additional trade-ins into the Polish used car market. Wrocław’s growing battery-manufacturing cluster foreshadows future secondary BEV concentration, given corporate fleets’ two-to-three-year replacement cycles.
Conversely, eastern provinces depend on older, cheaper inventory and lag in digital adoption. Nonetheless, smartphone penetration is closing gaps, allowing online platforms to source rural vehicles and push them toward urban buyers, reinforcing nationwide liquidity.
Regulatory Landscape
Regulation in Poland increasingly shapes used-vehicle supply, import formalities, and urban usability. Warsaw introduced the country's first Low Emission Zone (LEZ) in July 2024, restricting high-polluting vehicles in core districts and adding compliance risk to older diesel-heavy import flows, while other municipalities prepare similar measures.
On the compliance and administration side, passenger cars registered for the first time in Poland are subject to excise duty (AKC-U/S), payable within 30 days of the chargeable date, which influences total landed costs for imports and first-time registrations. Market dialogue also references Draft Law UC95 (timed around early 2026) to tighten oversight of vehicle imports from outside the EU with stronger technical and emissions scrutiny, alongside EU-driven inspection changes in 2026 such as digitized diagnostic results and mandatory exhaust-emissions testing for older vehicles. Effective July 5, 2026, Professional Plates (green plates) for professional traders support more efficient movement of vehicles during sales and preparation, which benefits organized dealers and large-scale traders.
Value Chain Analysis
Supply in the Poland used car market is anchored by cross-border sourcing from EU markets, domestic trade-ins from leasing and rental fleets, and growing secondary BEV inflows supported by incentives for new sales. Vehicles flow through importers and wholesalers to organized dealer groups and micro-dealers, then to consumers through offline forecourts and, increasingly, through digital classifieds platforms such as OTOMOTO that embed payments and financing into the listing-to-sale journey.
Core enabling nodes include vehicle history and registration infrastructure (CEPiK) operated through Centralny Osrodek Informatyki (COI), which supports title and data verification workflows used by traders and buyers. Organized retail is scaling via networks such as AURES Holdings' AAA AUTO branches in Poland, while OEM-linked certified channels (for example, Volkswagen Group Polska's outlet network referenced in the competitive context) support warranty-backed supply. Industry coordination and standards-setting are shaped by bodies such as the Polish Automotive Industry Association (PZPM) and the Dealer Association (ZDS). Downstream services including inspection, refurbishment, reconditioning, logistics, and finance are becoming more integrated as inspection digitization and tighter technical checks increase the value of professional preparation and documented provenance.
Competitive Landscape
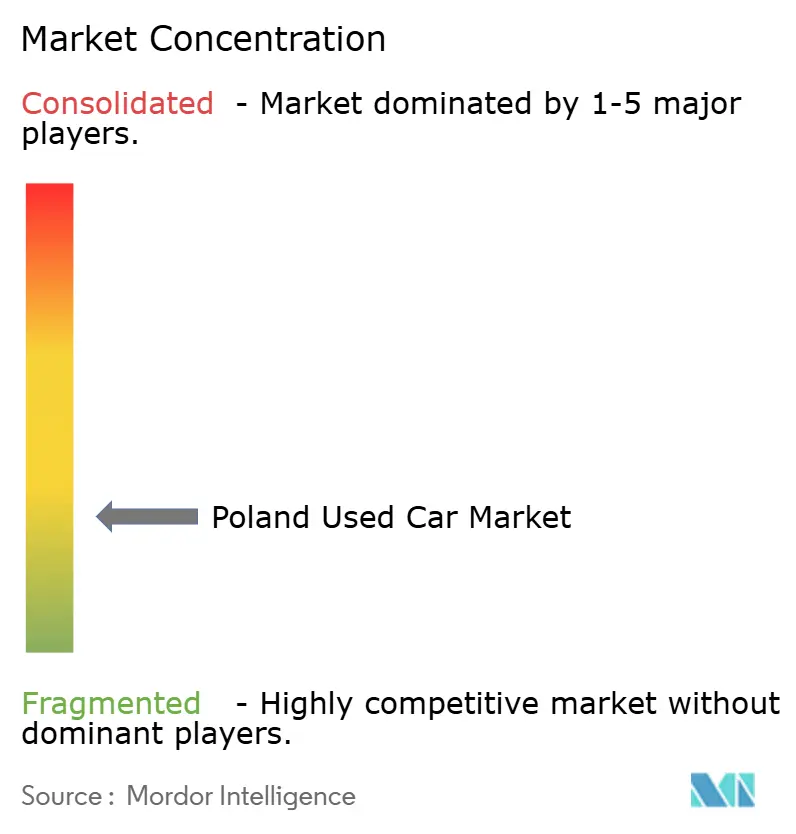
The Poland used car market remains fragmented, with thousands of micro-dealers alongside a rising cadre of scale platforms. AAA AUTO’s EUR 10 million innovation centre signals capital commitment to analytics-led retailing. Volkswagen Group Polska leverages its 200-strong outlet roster to dominate certified pre-owned supply.
Digital entrants differentiate through fully remote purchase journeys, enabling nationwide reach without showroom overheads. Embedded finance, logistics partnerships, and AI-driven pricing create competitive moats unavailable to informal yards.
Chinese manufacturers’ localised e-stores add brand-owned resale channels that may crowd incumbent listings once warranty-covered units cycle back into the market. Regulation against odometer fraud and LEZ expansion will squeeze low-compliance operators, nudging market share toward structured players.
Poland Used Car Industry Leaders
AAA AUTO
Emil Frey Polska
ALD Automotive
Otomoto
Plichta Group
- *Disclaimer: Major Players sorted in no particular order

Market Opportunities and Future Outlook
Inspection tightening and digitalization in 2026, including digitized diagnostic results and mandatory exhaust-emissions testing for older vehicles, increase the premium on verifiable condition. This shifts opportunity toward organized, compliance-forward inventory in younger age brackets and toward hybrids that can meet city-use constraints. With Warsaw's LEZ active since July 2024 and more city measures in planning, demand and dealer sourcing can tilt toward Euro-compliant petrol, hybrid, and newer vehicles that keep access in urban areas.
Scale players are also building capacity and processes that support formalization and faster turnover. AAA AUTO reported 28,749 sales in Poland in 2025 and outlined a roadmap starting in 2026 that includes opening about five express branches per year and targeting 5-10% annual growth in Poland, indicating continued network investment and a wider addressable customer catchment beyond major metros. Platform-led demand is creating openings in niche powertrains and fast-turn categories. OTOMOTO data for May 2026 showed LPG-equipped used cars as the fastest-selling category on the platform, indicating room for organized procurement and reconditioning pipelines aligned to high-velocity segments, alongside continued growth in used EV activity within large dealer networks where EV sales more than doubled year-on-year in 2025.
Recent Industry Developments
- June 2026: Polish used car market transactions reached 247,477 in June 2026, down 21,953 from May 2026. The activity level shows a cooling trend but maintains substantial volume, supporting scale-driven growth expectations under new ownership.
- June 2026: Average used car price in Poland was 50,717 PLN in June 2026, after a prior decline. The price level shift under new ownership signals potential for AI and data-driven pricing leverage.
- May 2026: Used cars with LPG installations were the fastest-selling category on Otomoto, with private-seller listings averaging 32 days to disappear. LPG segment strength could alter inventory mix and pricing strategy for dealers.


Research Methodology Framework and Report Scope
Market Definition and Coverage
For this methodology, the Poland used car market is the value generated from transactions of previously owned vehicles sold within Poland through organized and unorganized channels, including online and offline deals, across passenger and light commercial vehicles.
Scope exclusions: New vehicle retail sales, parts and service revenue, insurance, stand-alone financing fees, and vehicle subscriptions are excluded from the market value.
Segmentation Overview
- By Vehicle Type
- Hatchbacks
- Sedans
- Sport-Utility Vehicles (SUVs)
- Multi-Purpose Vehicles (MPVs)
- By Vendor Type
- Organised
- Unorganised
- By Fuel Type
- Petrol
- Diesel
- Hybrid (HEV & PHEV)
- Battery-Electric (BEV)
- Others
- By Vehicle Age
- 0 - 2 Years
- 3 - 5 Years
- 6 - 8 Years
- 9 - 12 Years
- Above 12 Years
- By Price Segment
- Below 5,000 USD
- 5,000 USD - 9,999 USD
- 10,000 USD - 14,999 USD
- 15,000 USD - 19,999 USD
- 20,000 USD - 29,999 USD
- Above 30,000 USD
- By Sales Channel
- Online
- Offline
Data Sources, Market Sizing, and Validation
Desk Research
Desk research was used to anchor the model to hard activity signals in Poland and to keep pricing assumptions realistic. We relied on public indicators such as vehicle registrations and re-registrations from Poland's Central Register of Vehicles (CEP), import and first-registration summaries from industry bodies such as PZPM, and trade statistics available through Eurostat and national customs reporting.
To convert activity into value, we used supporting context from sources such as Statistics Poland (GUS) for household and macro indicators, and central bank publications for currency and inflation context. We also reviewed company filings, investor decks, and reputable press coverage on supply and demand shifts. Where needed, paid subscriptions for company financials, news screening, and patent lookups were used to cross-check dealership scale, platform activity signals, and technology adoption themes. These desk sources are illustrative, and many other public and proprietary references were also used for data collection, validation, and clarification.
Primary Interviews and Surveys
Interviews and surveys with Polish dealers, importers, auction and marketplace specialists, fleet managers, and repair professionals clarify how registrations convert into sales in Poland. Respondents also help test private transaction levels, price bands, vehicle age, channel shares, and demand timing. Re-contact is requested when assumptions differ materially, and the final model is checked against evidence from across Poland.
Distribution of primary research fieldwork respondents
| Company type | Respondent position |
|---|---|
| Top tier: 28% | CXOs: 20% |
| Mid tier: 47% | Functional/Unit leaders: 30% |
| Smaller Players: 25% | Managers: 50% |
Market-Sizing & Forecasting
Sizing starts with a top-down demand pool built from Poland vehicle transactions, where registration and re-registration series are used to reconstruct annual used-vehicle movement, which is then translated into value using observed price bands. We then corroborated outputs with selective bottom-up checks, such as rolling up sampled dealer throughput and applying realistic average selling prices (ASP) by vehicle age and fuel mix, and then adjusting where the two views do not align.
Key inputs used in the model include used-vehicle registration and transfer counts, imported used passenger car first registrations, average listing and transacting price direction by age bracket, fuel-type mix shifts (petrol, diesel, hybrids, and EVs), and the online share of leads versus closures. Macroeconomic variables such as interest rate direction and disposable income signals were used to sense-check affordability-driven swings in the used market.
For forecasting, scenario analysis was used so the outlook stays practical when supply normalizes faster or slower than expected. Assumptions on import inflows, price depreciation slopes, and online conversion were reviewed with interview feedback, and then applied consistently across the forecast window. When a bottom-up proxy had gaps, we filled them using conservative ranges from comparable cohorts and re-tested the impact at the total market level.
Data Validation & Update Cycle
Totals were validated through multiple checks so one noisy series does not drive the outcome. We compared modeled value against independent signals like transaction counts, import inflow direction, and price movement narratives, and then reviewed outliers at the segment and channel level before sign-off.
A second analyst review is used to re-check assumptions, arithmetic, and year-to-year transitions, and we re-contact sources when a key input changes sharply or when desk signals disagree with interview feedback. Reports are refreshed annually, and interim updates are made when material events occur, such as major tax changes or sharp currency moves. Before delivery, a final analyst pass is completed so clients receive the latest updated view.
Mordor Intelligence's Poland Used Car Market Size Versus Other Published Estimates
Published values for the Poland used car market often differ because each estimate may count a different vehicle set, use a different price concept, or apply a different timing for currency conversion. Some sources lean more on listings or headlines, while others anchor on registrations and realized transactions.
Including or excluding light commercial used vehicles is one of the biggest gap drivers. Mordor Intelligence counts them inside the same used-vehicle transaction pool and then prices them with separate age and fuel-mix ASP logic, while some published figures stay passenger-car only or mix retail listings with completed deals.
Benchmark comparison
| Source | Market Size | Gaps in Research Methodology |
|---|---|---|
| Mordor Intelligence | USD 26.57 B (2025) | |
| Industry Platform A | USD 36.41 B (2030) | Uses a different forecast end year, and scope details are not fully stated, so the estimate may blend broader used-vehicle activity (including adjacent vehicle categories) with simplified price progression. |
| Trade Journal B | USD 38.65 B (2031) | Reports a later-year value without clarifying whether the number is transaction-based or listing-based, and differences in currency timing and assumed online price uplift can expand totals. |
The spread in the table mainly comes from scope and measurement choices, especially whether value is tied to completed transfers and how vehicle types and price curves are treated across future years. Our approach stays repeatable because the model is built from observable activity series and then stress-tested with interview checks before the final total is locked.


Key Questions Answered in the Report
How big is the Poland used car market in 2026?
The Poland used car market stands at USD 28.28 billion in 2026, with expectations of USD 38.65 billion by 2031 at a 6.44% CAGR.
Which vehicle type grows fastest in Polish used-car sales?
SUVs are set to record the quickest 9.02% CAGR through 2031, reflecting shifting consumer preference toward higher-riding models.
What share do organized dealers hold?
Organized dealers control 45.40% of turnover and are projected to expand their slice at an 8.61% CAGR to 2031 by leveraging scale and digital processes.
Which fuel type is advancing most rapidly?
Electric vehicles, although small in absolute terms, are forecast to climb at an 8.05% CAGR thanks to supportive incentives and rising secondary BEV listings.
What regulatory factors threaten market growth?
City-level Low Emission Zones and persistent odometer fraud weigh on growth by restricting older diesel resale and eroding buyer trust, collectively trimming CAGR potential by 1.2 percentage points.
Page last updated on:


 Your data is secure and never sold or shared.


