
Market Overview
| Study Period | 2020 - 2031 |
|---|---|
| Forecast Data Period | 2026 - 2031 |
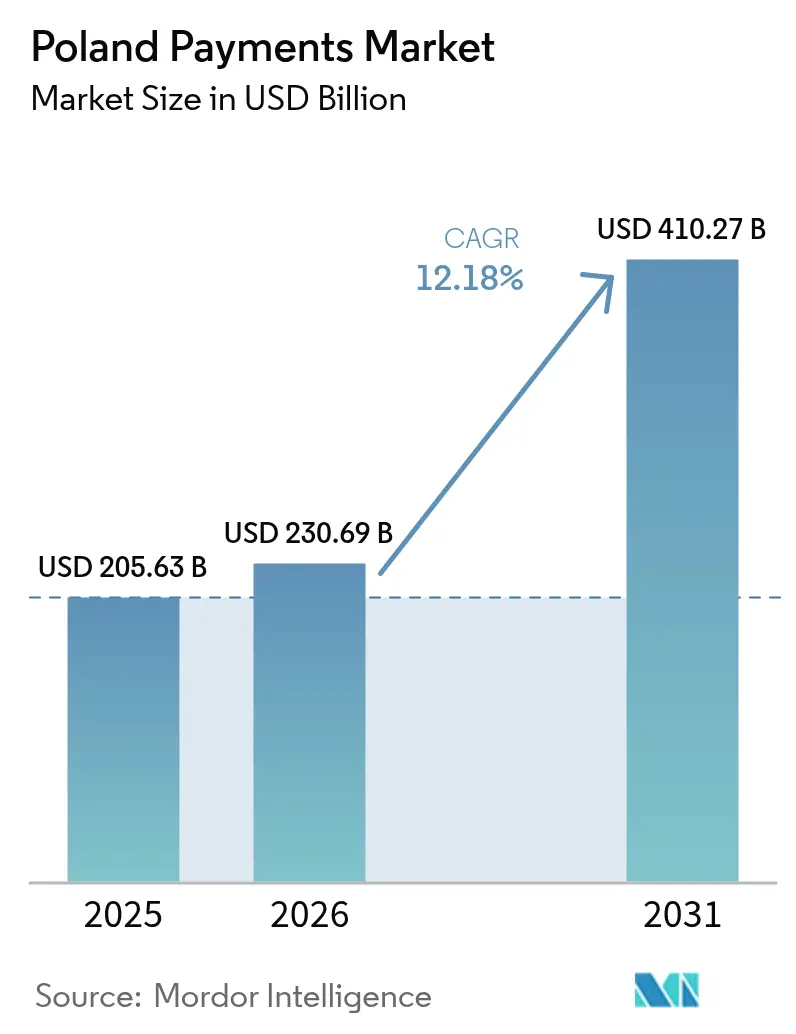
| Base Year Market Size (2025) | USD 205.63 Billion |
| Market Size (2026) | USD 230.69 Billion |
| Market Size (2031) | USD 410.27 Billion |
| Growth Rate (2026 - 2031) | 12.18 % |
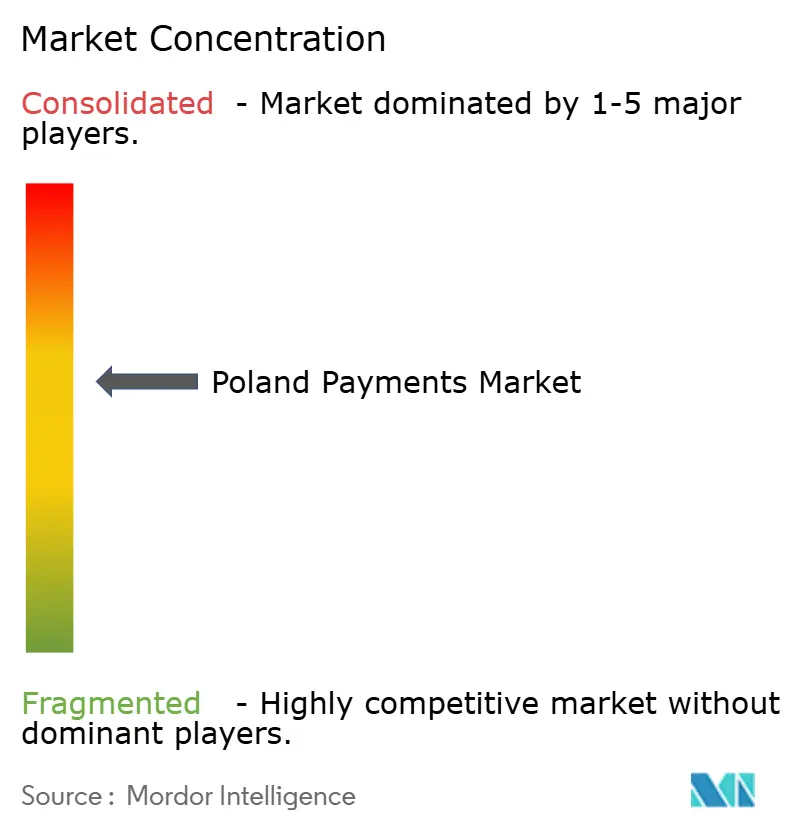
| Market Concentration | Medium |
Major Players *Disclaimer: Major Players sorted in no particular order Image © Mordor Intelligence. Reuse requires attribution under CC BY 4.0. | |
Poland Payments Market Analysis by Mordor Intelligence
The Poland payments market size is expected to grow from USD 205.63 billion in 2025 to USD 230.69 billion in 2026 and is forecast to reach USD 410.27 billion by 2031 at 12.18% CAGR over 2026-2031. The expansion reflects a decisive migration from cash to digital payments, amplified by the Cashless Poland Program, government tax incentives for terminal deployment and the ubiquity of domestic instant-payment rails. BLIK’s contribution of 1.2% to national GDP in 2024 underscores the economic weight of locally engineered solutions.[1] Competitive intensity remains high as banks, fintechs and global processors contest share across point-of-sale, e-commerce and mobile channels. Rising interchange fees, broader AML requirements and rural cash affinity temper growth, yet improving broadband coverage and PSD2-enabled open banking keep the long-term outlook compelling.
Key Report Takeaways
- By interaction channel, point-of-sale captured 57.20% Poland payments market share in 2025; e-commerce and m-commerce are forecast to expand at a 15.52% CAGR to 2031.
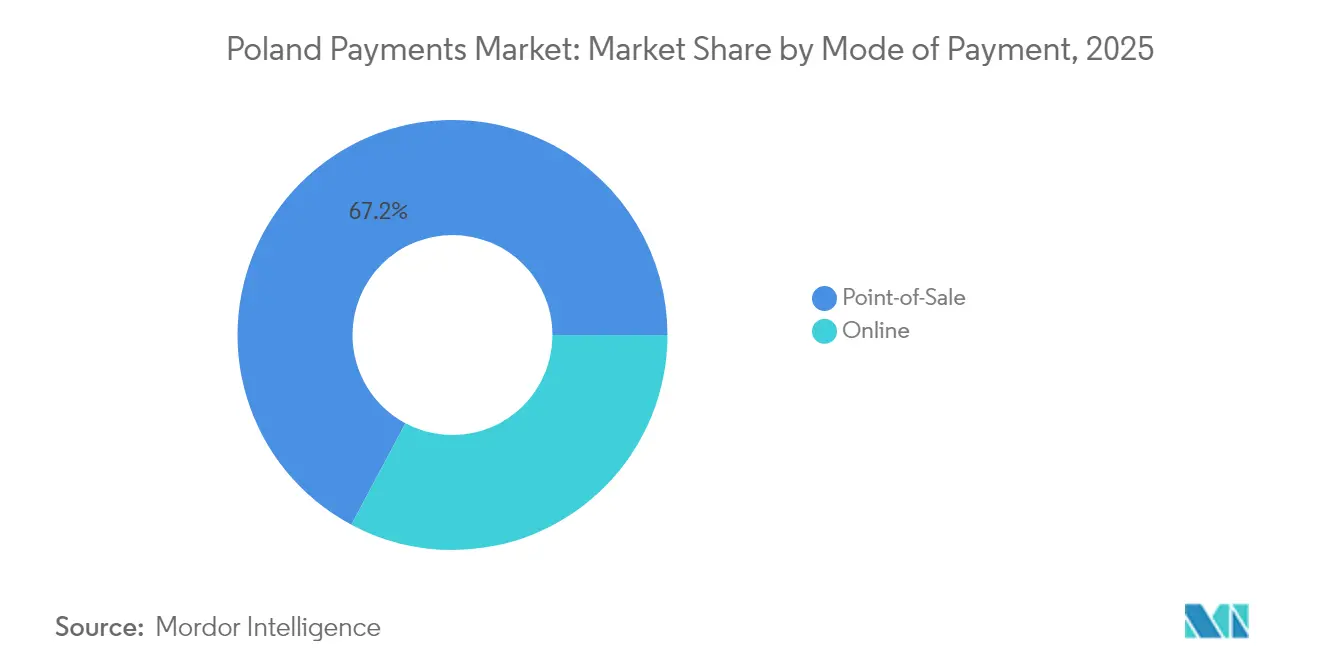
- By mode of payment, card-based POS held 37.25% Poland payments market share in 2025, while digital wallet and account-to-account options are scaling at a 13.98% CAGR. Overall Point-of-sale accounts for 67.20% of the share.
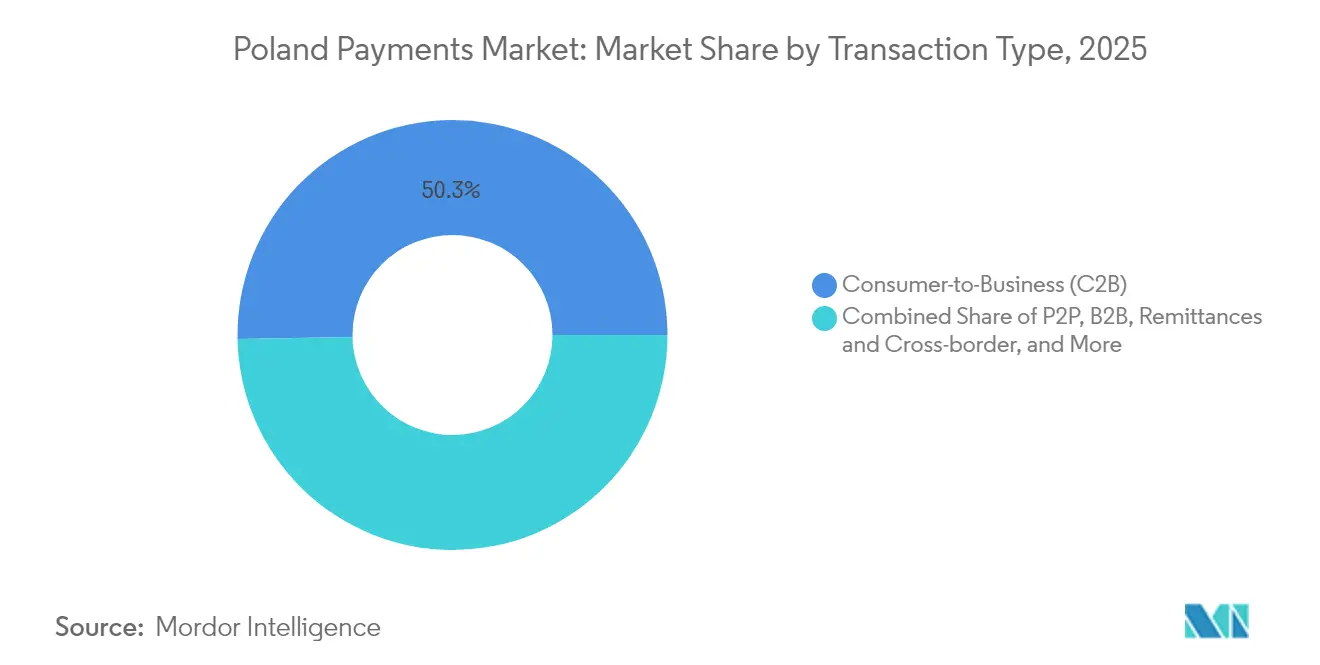
- By transaction type, consumer-to-business flows accounted for 50.30% of the Poland payments market size in 2025; remittances and cross-border payments are forecast to rise at a 15.79% CAGR.
- By end-user industry, retail commanded 38.40% of the Poland payments market size in 2025; healthcare payments are advancing at a 13.18% CAGR through 2031.
Note: Market size and forecast figures in this report are generated using Mordor Intelligence’s proprietary estimation framework, updated with the latest available data and insights as of 2026.
Market Trends and Insights
Drivers Impact Analysis of Poland Payments Market*
| Driver | (~) % Impact on CAGR Forecast | Geographic Relevance | Impact Timeline |
|---|---|---|---|
| Government-led Cashless Poland Program & Tax Incentives for POS Adoption | +2.1% | National, with early gains in Warsaw, Krakow, Gdansk | Medium term (2-4 years) |
| Rapid Uptake of BLIK & Domestic Instant-Payment Infrastructure | +2.8% | National, strongest in urban centers | Short term (≤ 2 years) |
| E-commerce Boom Among Polish SMEs Leveraging Omnichannel Gateways | +1.9% | National, concentrated in major metropolitan areas | Medium term (2-4 years) |
| NFC-Enabled Mobile-Wallet Penetration Driven by High Android Share | +1.4% | National, with rural lag | Short term (≤ 2 years) |
| PSD2 Open-Banking APIs Fueling Embedded Payments in Polish Super-apps | +1.2% | EU-wide, Poland as early adopter | Long term (≥ 4 years) |
| Contactless Public-Transport Ticketing Roll-outs in Major Cities | +0.8% | Urban centers: Warsaw, Krakow, Wroclaw, Gdansk | Medium term (2-4 years) |
| Source: Mordor Intelligence | |||
Government-led Cashless Poland Program & Tax Incentives for POS Adoption
The state programme links fiscal incentives with infrastructure expansion, allowing merchants that process predominantly cashless sales to accelerate VAT refunds and claim specific tax deductions. More than 586,000 terminals had been deployed by mid-2023, substantially widening acceptance in micro-merchant segments that historically lacked point-of-sale capacity.[2] Educational campaigns paired with fiscal relief encourage merchants to actively steer consumers toward electronic payment, forming a self-reinforcing demand loop. The scheme also increases data visibility for revenue authorities, which in turn motivates further policy support.
Rapid Uptake of BLIK & Domestic Instant-Payment Infrastructure
BLIK processed 2.4 billion transactions in 2024, half occurring online, as its single-interface design removed friction across retail, ATM and peer-to-peer contexts. Full integration with 19 banks and a widening footprint on iOS devices extend reach beyond its Android origin. Partnerships with Google Play have moved BLIK from utility use cases into digital content commerce, illustrating its versatility. Because framework ownership sits with Polish banks, sovereignty concerns are mitigated while interoperability with SEPA Instant facilitates cross-border euro transfers.
E-commerce Boom Among Polish SMEs Leveraging Omnichannel Gateways
Online retail is set to double from PLN 94 billion (USD 25.32 billion) in 2022 to PLN 190 billion (USD 51.19 billion) by 2027, intensifying the need for gateways that aggregate cards, BLIK and alternative methods.[3] Checkout optimisation drives value given local cart-abandonment rates near 75%. Providers differentiate through Polish-specific payment coverage, mobile-first UX and analytics that translate payment data into conversion insights. SMEs adopt subscription pricing for gateways to circumvent heavy capex, aligning costs with revenue seasonality.
NFC-Enabled Mobile-Wallet Penetration Driven by High Android Share
Contactless volumes exceeded PLN 300 billion (USD 76 billion) in H2 2024 as smartphones and wearables displaced plastic for low-value spends. Leading banks bundle tokenised credentials into core apps, prioritising biometric sign-on and single-click checkout. The coexistence of 51 million physical cards with rising wallet tokens indicates a transition phase where consumers hedge payment options rather than fully abandoning cards. Youth segments anchor wallet growth, pushing issuers to embed loyalty, transit and insurance features within payment apps.
Restraints Impact Analysis of Poland Payments Market*
| Restraint | (~) % Impact on CAGR Forecast | Geographic Relevance | Impact Timeline |
|---|---|---|---|
| Fragmented Bank-led Schemes Creating Merchant Interoperability Friction | -1.3% | National, affecting smaller merchants disproportionately | Medium term (2-4 years) |
| Aging Rural Demographics Maintaining Cash Preference | -0.9% | Rural areas, particularly eastern and southern regions | Long term (≥ 4 years) |
| Rising Card Interchange Fees Post-2019 Cap Expiry | -0.7% | National, impacting merchant adoption costs | Short term (≤ 2 years) |
| Heightened AML/KYC Scrutiny after Wirecard Scandal | -0.5% | EU-wide, affecting payment institutions | Medium term (2-4 years) |
| Source: Mordor Intelligence | |||
Fragmented Bank-Led Schemes Creating Merchant Interoperability Friction
Individual banks continue to layer proprietary features atop BLIK or card rails, forcing merchants to support multiple SDKs, dashboards and settlement cycles. This fragmentation elevates integration costs and complicates reconciliation. SMEs in particular confront varying fee matrices and chargeback processes, eroding net margins and discouraging full digital transitions. Industry bodies are now exploring unified routing protocols to streamline payout timetables and security standards.
Aging Rural Demographics Maintaining Cash Preference
A digital divide persists as only 45% of rural households enjoy very-high-capacity broadband versus 81.1% nationally. Older residents equate physical currency with security and budget control, a perception reinforced during periods of economic uncertainty. Cash dominance rises for low-ticket items where digital fees outweigh margins. While financial-literacy drives have expanded, behavioural change remains gradual and will likely follow infrastructure upgrades.
*Our forecasts treat driver/restraint impacts as directional, not additive. The impact forecasts reflect baseline growth, mix effects, and variable interactions.
Poland Payments Market Segment Analysis
By Mode of Payment:
Digital Wallets Extend Reach Beyond CardsPOS card payments retained a 37.25% Poland payments market share in 2025; yet digital wallets and account-to-account options are advancing at a 13.98% CAGR, steadily narrowing the gap. Overall Point-of-Sale accounts for around 67.20% of the share. This migration stems from BLIK’s bank-agnostic QR and code-based authorisation, NFC tokenisation and simplified consumer authentication. The Poland payments market size for digital wallets is projected to outpace cards beyond 2028 as smartphone penetration nears saturation. Physical cards persist in higher-age cohorts and remain essential backups when connectivity falters. Issuers respond by blending card credentials into wallets, thereby prolonging card relevance while meeting mobile demand.
Cash still anchors small rural transactions but declines each year as terminal density rises. Emerging alternatives such as wearables and QR-based closed-loop systems address niche contexts like campus payments and micro-mobility rentals. Online, card-not-present volumes compete with wallet-based push payments, especially where merchants promote BLIK to sidestep interchange. Buy-now-pay-later add-ons and instant bank transfers further diversify the modality landscape, compelling acquirers to emphasise orchestration over single-rail dominance.

By Interaction Channel:
E-commerce Growth Redefines Transaction MixPoint-of-sale activity represented 57.20% of all processed value in 2025, but the Poland payments market is witnessing a channel inversion as e-commerce and mobile commerce expand at 15.52% CAGR. Smartphones account for most incremental online traffic, driven by frictionless in-app payments and social-commerce integration. Payment service providers invest in adaptive checkout APIs that route across wallets, cards and bank transfers without altering front-end design.
High average ticket values in e-commerce necessitate robust risk scoring, 3-D Secure 2.2 compliance and token-based credential storage. In-store environments still capture large spontaneous purchases, yet even here QR links, pay-by-link receipts and scan-to-pay codes blend digital elements into face-to-face shopping. Value-added services such as real-time inventory displays or loyalty redemption provide additional revenue levers for processors serving omnichannel merchants.
By Transaction Type:
Cross-Border Flows AccelerateConsumer-to-business transactions accounted for 50.30% of 2025 volumes, underpinning stable retail dynamics. Remittances and cross-border flows, however, are forecast to outpace all other types at 15.79% CAGR, supported by Poland’s sizeable diaspora working across Western Europe and tightening EU instant-payment mandates. Providers with direct clearing connectivity and competitive FX mark-ups capture wallet share from correspondent banks.
Person-to-person transfers thrive on BLIK’s six-digit code model that posts within seconds, supporting gig-economy payouts and social-commerce settlements. Business-to-business payments, historically manual and invoice-driven, are digitising as corporates seek working-capital efficiencies. Embedded finance platforms now integrate invoice issuance, approval workflows and same-day settlement, linking payment directly to ERP records to cut reconciliation time.
By End-User Industry:
Healthcare Digitalisation EmergesRetail maintained 38.40% Poland payments market share in 2025, reflecting entrenched terminal networks and everyday transaction frequency. Yet healthcare is expanding fastest at 13.18% CAGR, propelled by e-prescriptions, telemedicine and digital patient journeys championed by the National Health Fund. The Poland payments market size for healthcare services is poised to grow further as insurers adopt instant co-pay settlement and pharmacies integrate QR prescription fulfilment.
Government services, utilities and municipal ticketing follow close behind, leveraging mObywatel and ePUAP to unify identity, documentation and payment in one interface. Hospitality, travel and entertainment sectors seize mobile wallets to streamline guest check-in and ticket redemption. Education, professional services and creative industries demand bespoke billing cycles and split-payment capabilities, allowing payment firms to monetise vertical-specific modules.
Geography Analysis
Urban centres drive heaviest digital payment penetration, with Warsaw, Krakow, Wroclaw and the Tri-City area benefitting from near-universal 4G/5G coverage and dense POS acceptance networks. These regions account for the majority of BLIK transactions and host the country’s highest ratios of wallet-enabled cards. Western and northern voivodeships, buoyed by strong manufacturing and foreign direct investment, exhibit higher e-commerce order values and cross-border trade volumes than eastern counterparts.
Rural districts lag due to limited high-speed broadband and pronounced cash culture among older demographics. Nonetheless, postal banking agents and mobile-enabled micro-acquirers are helping to bridge acceptance gaps, especially in agribusiness settlements and seasonal markets. Municipal contactless transit in Warsaw and Krakow fosters habitual wallet use that spills over to retail and food services. Success in these pilot cities serves as a template for mid-sized towns rolling out similar projects over the next three years.
Poland’s EU membership ensures technical alignment with SEPA Instant and forthcoming digital-euro initiatives, positioning domestic processors to service intra-EU merchant needs. Proximity to Ukraine and the Baltics also elevates regional remittance corridors, leading PSPs to integrate multi-currency wallets and dynamic FX engines. The strategic location of logistics parks along the A2 and S3 highways intensifies B2B payment velocity, underscoring geographic interplay between infrastructure and payment adoption.
Regulatory Landscape
Poland payments are governed primarily by the Act of 19 August 2011 on Payment Services. The consolidated text was announced on 17 April 2026 (Dz.U. 2026 poz. 623), with further updates introduced via a financial-market amendment act that entered into force on 31 March 2026. Oversight is split between the Polish Financial Supervision Authority (KNF), which licenses and supervises payment institutions and related providers, and the National Bank of Poland (NBP), which is responsible for payment system infrastructure and related regulations.
Alongside PSD2 open-banking implementation under the Ministry of Finance, Poland is aligning with EU digital rules that affect online payment journeys and platform accountability. The Ministry of Digital Affairs is implementing the EU Digital Services Act (DSA), with the President of the Office of Electronic Communications (UKE) designated as Digital Services Coordinator and additional roles for UOKiK (consumer protection) and KRRiT (video platforms), reinforcing governance expectations for digital commerce platforms that embed payments.
Value Chain Analysis
The value chain starts with consumers and merchants across point-of-sale and e-commerce, supported by merchant platforms, marketplaces, and logistics operators that influence checkout conversion and delivery-linked payment flows. Merchants then connect through acquirers, payment facilitators, and gateways (notably PayU and Przelewy24 for online aggregation), along with POS terminal providers and integrators that serve micro-merchants through large-scale deployment programs. At the method layer, cards (Visa, Mastercard), wallets (Apple Pay, Google Pay), and domestic account-to-account options led by BLIK route transactions into domestic and international clearing and settlement.
Infrastructure and settlement rely on domestic interbank rails and central-bank systems. NBP and the banking sector run core clearing, while regulators and schemes define operational, fraud, and authentication requirements. A key 2026 shift is legislative enablement for non-bank payment institutions and electronic money institutions to access core clearing (SORBNET3 and Elixir), reducing reliance on bank intermediaries for settlement and increasing the scope for PSPs to run end-to-end processing. Value-added layers such as risk scoring, tokenization, recurring billing, and reconciliation tooling increasingly shape differentiation as merchants seek omnichannel orchestration rather than single-rail integrations.
Competitive Landscape
The Poland payments market features a moderately concentrated yet fiercely contested arena where local banks, global schemes and fintech specialists coexist. PKO Bank Polski, Santander Bank Polska and Bank Pekao S.A. command substantive customer bases and regulatory capital advantages, yet rely on continuous digital upgrades to defend share. BLIK’s consortium model empowers banks to own a domestically controlled rail, limiting dependence on international card networks.
International brands such as Mastercard and Visa enhance acceptance ubiquity and cross-border capability, often through co-branded initiatives with local issuers. Fintech entrants including PayPro’s Przelewy24, Klarna and Revolut exploit niche propositions such as e-commerce orchestration, pay-later installments or multi-currency wallets. Strategic alliances proliferate: PKO Bank Polski partnered with Mastercard to pilot tokenised open-loop transit, while foreign PSPs integrate BLIK to localise checkout.
Regulation both intensifies and shapes rivalry. PSD2 spawns open-banking aggregation platforms that blur lines between account information and payment initiation. The Digital Operational Resilience Act (DORA) raises compliance costs, favouring scale players able to amortise cybersecurity investments. Meanwhile, rising interchange ceilings since 2019 encourage merchants to steer volumes toward lower-cost account-to-account options, altering pricing levers across the value chain.
Poland Payments Industry Leaders
-
Apple Inc. (Apple Pay)
-
PayU
-
Santander Bank Polska
-
PKO Bank Polski
-
PayPal Holdings Inc.
- *Disclaimer: Major Players sorted in no particular order
Poland Payments Market Companies Covered in this Report
- PayU
- PayPal Holdings Inc.
- Dotpay (Ecommpay)
- Mastercard
- Visa Inc.
- BLIK (Polski Standard Płatności)
- Apple Inc. (Apple Pay)
- Google Pay
- Santander Bank Polska
- Bank Pekao S.A.
- PKO Bank Polski
- Worldline
- Nexi Group/Netaxept
- Adyen
- Stripe
- Fiserv (First Data Polcard)
- PayPro S.A. (Przelewy24)
- Blue Media S.A.
- PayPo (BNPL)
- Klarna
- Revolut
- Square (Block, Inc.)
- Tap2Pay.me
- American Express
Market Opportunities and Future Outlook
One opportunity area is expanding account-to-account and instant-payment use cases beyond P2P into merchant and subscription flows. This is supported by infrastructure modernization and regulatory access changes. NBP activated SORBNET3 on 8 September 2025 as an ISO 20022-native RTGS platform, and March 2026 legislation enabled direct access to SORBNET3 and Elixir for non-bank payment institutions and electronic money institutions, creating room for PSPs to build lower-latency settlement, treasury, and reconciliation services without full bank intermediation. Providers that package these capabilities for SMEs, including automated payouts, pay-by-link, and embedded acceptance in platforms, can gain traction where merchant interoperability friction and cost sensitivity persist.
Cross-border digital commerce and regional interoperability also remain actionable areas. BLIK is moving from a domestic method toward broader European acceptance, with reported connectivity with the European e-commerce network and ongoing integration work with major Romanian banks in June 2026 as part of expansion via regional hubs. This supports merchants selling into the Eurozone that want locally preferred checkout options. Poland also has a structured digital-policy runway, with the European Commission citing 55 Digital Decade measures backed by EUR 12.4 billion (with a portion expiring by end-2026), which supports continued demand for secure digital onboarding, identity-linked payments, and platform-integrated compliance tooling.
Recent Industry Developments in Poland Payments Market
- June 2026: Paymove raised EUR 2.12 million in a round led by 4growth VC to build AI-agent payment infrastructure and fund international expansion. The financing supports product development in automation and risk controls, which can raise competitive pressure on incumbent PSPs serving offline and omnichannel merchants.
- May 2026: Checkout.com announced a direct integration with BLIK, adding support that includes recurring payments. The move lowers integration friction for international merchants selling into Poland and strengthens BLIK coverage in cross-border e-commerce stacks.
- October 2024: Mastercard introduced a cross-border optimization suite aimed at reducing payment rejection and improving settlement performance for Polish banks. The capability supports scheme-based cross-border flows at a time when merchants are also promoting domestic account-to-account alternatives to manage acceptance costs.
Poland Payments Market Report Scope and Research Methodology
Market Definition and Coverage
For this methodology, the Poland payments market is defined as the value of payment transactions completed in Poland across common consumer and business payment instruments, covering in-store and online use where the payment is initiated for a purchase or bill settlement.
Scope exclusions: We exclude crypto P2P swaps, ATM cash withdrawals, wholesale interbank transfers, and provider fee revenues so the market reflects payment value, not financial flows or company income.
Segments Covered in This Report
- Segmentation by Mode of Payment
- Point-of-Sale
- Card (Debit, Credit, Pre-paid)
- Digital Wallets (Apple Pay, Google Pay, Interac Flash)
- Cash
- Other POS (Gift-cards, QR, Wearables)
- Online
- Card (Card-Not-Present)
- Digital Wallet and Account-to-Account (Interac e-Transfer, PayPal)
- Other Online (COD, BNPL, Bank Transfer)
- Point-of-Sale
- Segmentation by Interaction Channel
- Point-of-Sale
- E-commerce/M-commerce
- Segmentation by Transaction Type
- Person-to-Person (P2P)
- Consumer-to-Business (C2B)
- Business-to-Business (B2B)
- Remittances and Cross-border
- Segmentation by End-user Industry
- Retail
- Entertainment and Digital Content
- Healthcare
- Hospitality and Travel
- Government and Utilities
- Other End-user Industries
Data Sources, Market Sizing, and Validation
Desk Research
Desk research helped us pin down the market definition, confirm what should be counted as payment transaction value, and assemble an initial set of demand and usage signals to size the market. We used public and official sources such as the National Bank of Poland payment and card statistics, Statistics Poland (GUS) household spending and retail indicators, European Central Bank payments statistics, and Bank for International Settlements references on payment systems and settlement trends.
To keep assumptions grounded, we also reviewed Polish and European regulatory publications and consultations, bank and payment company annual reports and investor presentations, and public updates from payment infrastructure bodies and merchant acceptance initiatives. A paid subscription database was used selectively for company financials intelligence and news screening, so major one-off shifts could be cross-checked against disclosures and event timelines. The sources listed here are illustrative, and many other references were used for data collection, validation, and clarification.
Primary Interviews and Surveys
We interview Polish payment providers, banks, merchants, processors, and regulators through expert discussions and surveys. Respondents test transaction growth, channel mix, average ticket values, and adoption assumptions, helping us close gaps in secondary data. Findings are compared with published series and rechecked when reported trends vary.
Distribution of primary research fieldwork respondents
| Company type | Respondent position |
|---|---|
| Top tier: 30% | CXOs: 15% |
| Mid tier: 45% | Functional/Unit leaders: 30% |
| Smaller Players: 25% | Managers: 55% |
Market-Sizing & Forecasting
Sizing starts with a top-down reconstruction of payment transaction value in Poland, where central bank payment series and instrument-level splits are used to rebuild the total value pool across major rails and channels. We then corroborate totals with selective bottom-up approximations, such as sampled acceptance coverage checks, channel checks on online checkout mix, and sanity tests using approximate volumes multiplied by average ticket sizes for common use cases.
Inputs used in the model include cashless share progression, card usage growth, digital wallet penetration, instant payment adoption on domestic rails, and changes in terminal density and acceptance coverage, which are further linked to e-commerce payment preference and consumer spending direction. Where a public series is delayed or reported at a different cadence, gaps are filled using interpolation tied to observable indicators and then rechecked with primary respondents so the final curve stays realistic.
Forecasting uses scenario analysis supported by exponential smoothing on instrument shares, followed by expert-led adjustments for step changes that can occur from regulation, authentication upgrades, or pricing shifts. Because the same model structure is maintained over time, year-on-year changes can be explained through specific input movements rather than broad narrative statements.
Data Validation & Update Cycle
Validation is completed by comparing modeled outputs against independent signals such as central bank time series, acceptance and terminalization indicators, and directionally consistent growth signals from ecosystem participants. When an anomaly appears, it is traced to the driver level, and assumptions are either corrected or reconfirmed through follow-up outreach.
Before sign-off, the work goes through multi-step analyst reviews that check definition alignment, arithmetic consistency, and whether year-to-year movements match plausible demand patterns. Reports are refreshed annually, with interim updates when material events occur, such as rule changes, infrastructure shifts, or notable disruptions in payment behavior. Right before delivery, we perform a fresh pass so the latest public releases and market developments are reflected.
Mordor Intelligence's Poland Payments Market Size Compared With Other Published Estimates
Published market values for payments can diverge because authors do not always measure the same thing, and payment transaction value is sometimes mixed with financial transfers or even provider revenues. In Poland, the main differences usually come from what is treated as a payment for goods and services, how cash usage is handled, and whether online and cross-border checkout flows are counted consistently.
The largest gaps typically show up when ATM withdrawals or wholesale transfers are included in a headline number, or when only a narrow set of instruments is counted while fast-growing account-to-account rails are left out. Differences can also be amplified by currency conversion timing and by cashless substitution paths that are not checked against acceptance coverage and instrument-level trends.
Benchmark comparison
| Source | Market Size | Gaps in Research Methodology |
|---|---|---|
| Mordor Intelligence | USD 205.63 B (2025) | |
| Industry Association A | USD 189.40 B (2025) | Uses a narrower captured value pool by emphasizing card-present activity and selected digital instruments, which can undercount account-to-account rails and some bill-payment flows, and it often relies on annual average FX conversion. |
| Global Consultancy B | USD 248.10 B (2025) | Builds a broader total that can fold in adjacent items like cash withdrawals and large-value transfers, and it may apply faster cashless substitution assumptions without enough instrument-level back checks. |
The table indicates that scope choices and FX timing are doing most of the work behind the spread, before forecasting style is even considered. When only purchase and bill-settlement transaction value is counted (and ATM withdrawals, wholesale transfers, and provider fees are excluded), the total stays tied to observable payment rails, a scope rule applied by Mordor Intelligence.
Key Questions Answered in the Report
How large is the Poland payments market in 2026?
The Poland payments market is valued at USD 230.69 billion in 2026 and is projected to grow to USD 410.27 billion by 2031.
Which interaction channel is expanding fastest?
E-commerce and mobile commerce channels are advancing at a 15.52% CAGR, overtaking point-of-sale growth momentum.
What role does BLIK play in the market?
BLIK handled 2.4 billion transactions in 2024 and contributed 1.2% to national GDP, positioning it as a critical domestic rail.
Why is healthcare a high-growth end-user segment?
National Health Fund digitalisation of prescriptions and patient records is driving a 13.18% CAGR in healthcare payment value through 2031.
How will the EU Instant Payments Regulation influence Poland?
The regulation obliges banks to offer round-the-clock euro instant transfers, enhancing cross-border speed and supporting remittance growth at a 15.79% CAGR.
What are key restraints on digital payment growth?
Scheme fragmentation that complicates merchant integration and rural cash preference among aging demographics modestly slow overall CAGR by 2.2 percentage points combined.