
Market Overview
| Study Period | 2020 - 2031 |
|---|---|
| Forecast Data Period | 2026 - 2031 |
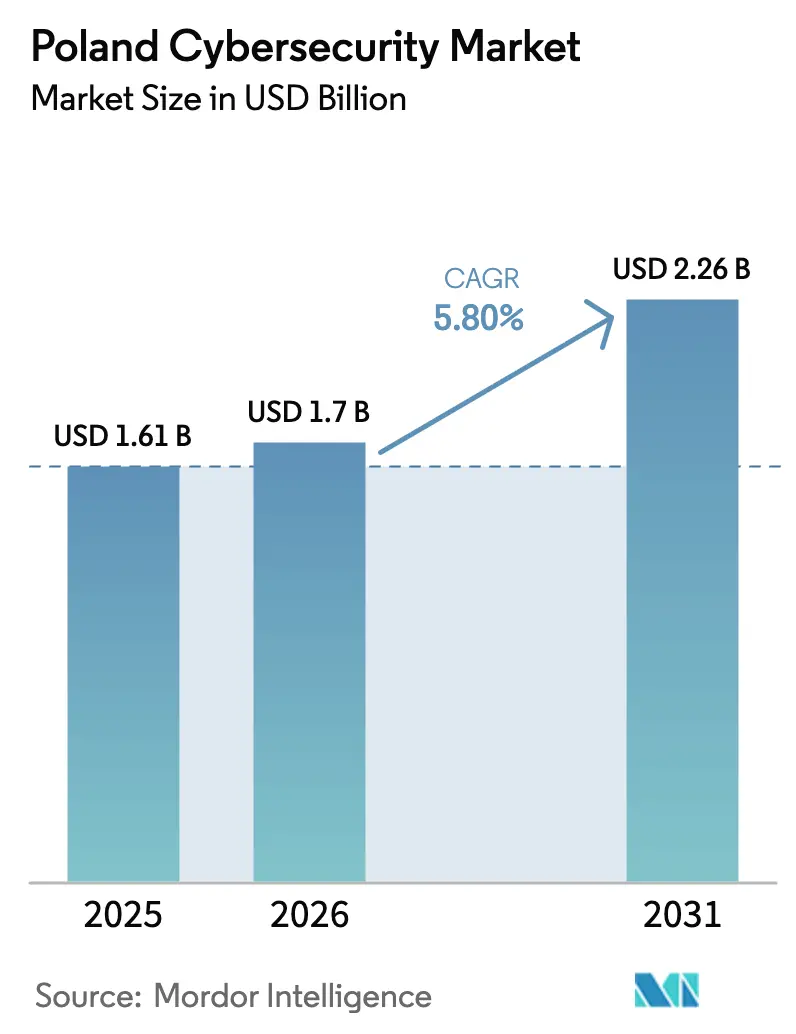
| Base Year Market Size (2025) | USD 1.61 Billion |
| Market Size (2026) | USD 1.7 Billion |
| Market Size (2031) | USD 2.26 Billion |
| Growth Rate (2026 - 2031) | 5.80% CAGR |
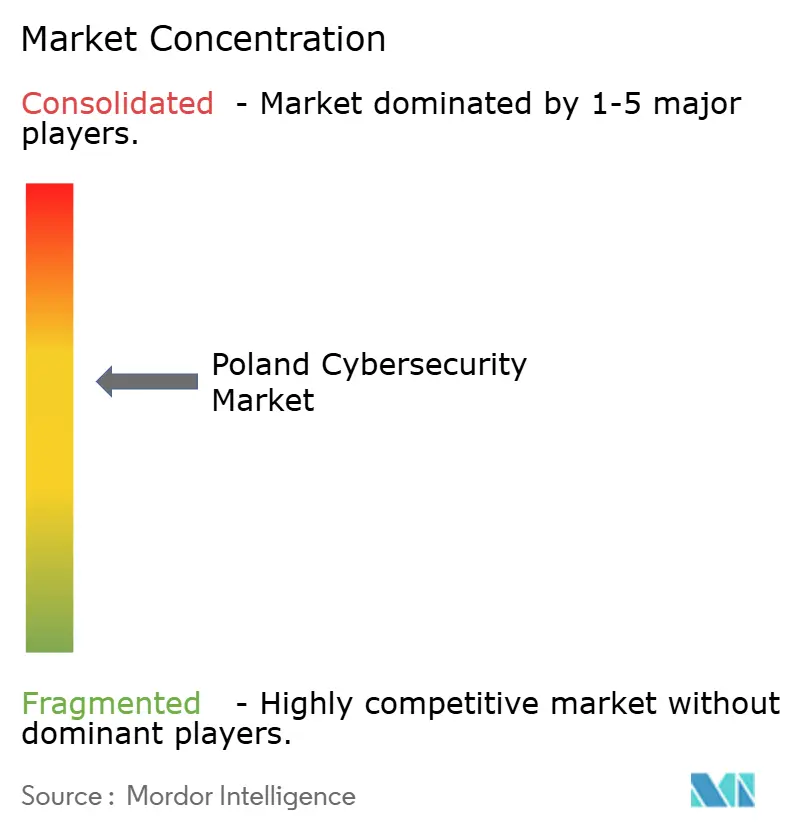
| Market Concentration | Medium |
Major Players *Disclaimer: Major Players sorted in no particular order Image © Mordor Intelligence. Reuse requires attribution under CC BY 4.0. | |
Poland Cybersecurity Market Analysis by Mordor Intelligence
The Poland cybersecurity market size is expected to grow from USD 1.61 billion in 2025 to USD 1.7 billion in 2026 and is forecast to reach USD 2.26 billion by 2031 at 5.80% CAGR over 2026-2031. Board-level acceptance of security as a core operational requirement, rather than a discretionary technology upgrade, is now common. Procurement teams routinely bundle threat-protection licences with every new cloud, 5G or artificial-intelligence rollout, creating a pace of repeat orders that points to deeply rooted structural demand. Geopolitical tension has sharpened this momentum by pulling forward public-sector spending on threat-intelligence platforms and secure government clouds. Local suppliers benefit because proximity to end users shortens incident-response times, while international vendors invest in Polish-language support and domestic data handling to satisfy compliance rules. Combined, these shifts suggest the Poland cybersecurity market is entering a phase in which subscription and managed-service contracts dominate cash flows, driving predictable, recurring revenue streams across the value chain.
Key Report Takeaways
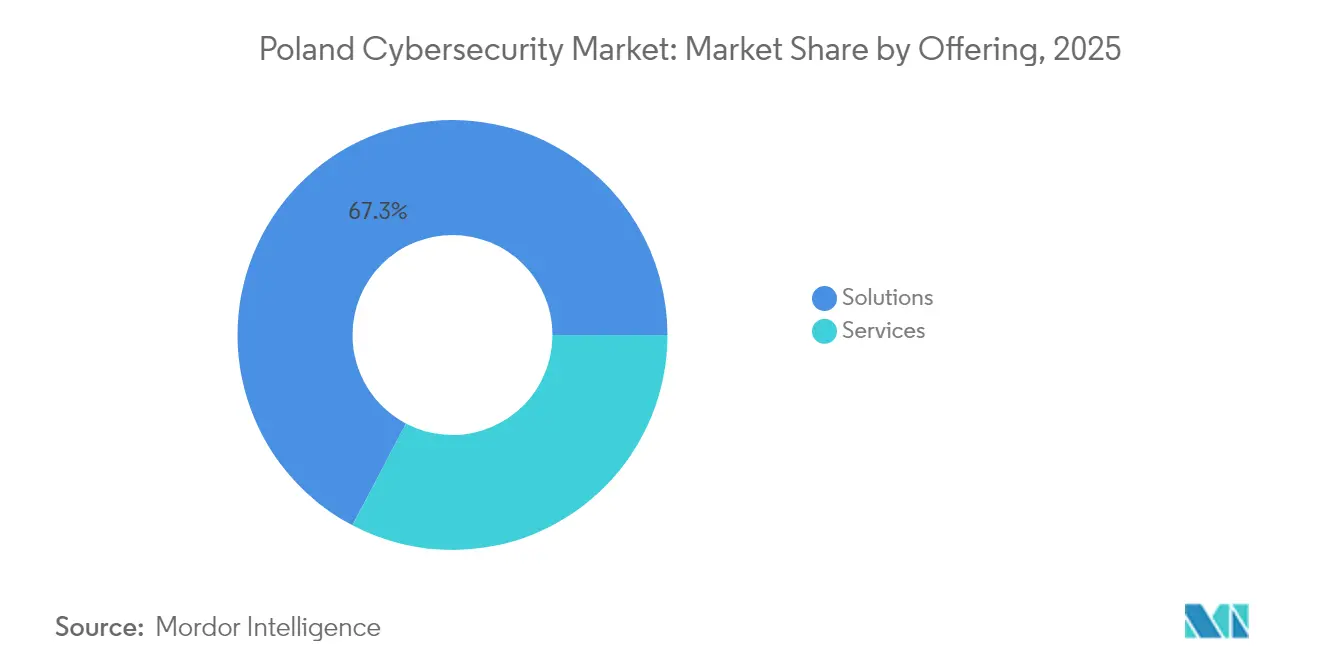
- By offering, solutions led with 67.30% Poland cybersecurity market share in 2025, while services are forecast to expand at a 15.05% CAGR through 2031.
- By deployment mode, on-premises retained 53.90% of Poland cybersecurity market size in 2025; cloud is projected to grow at an 18.15% CAGR between 2026 and 2031.
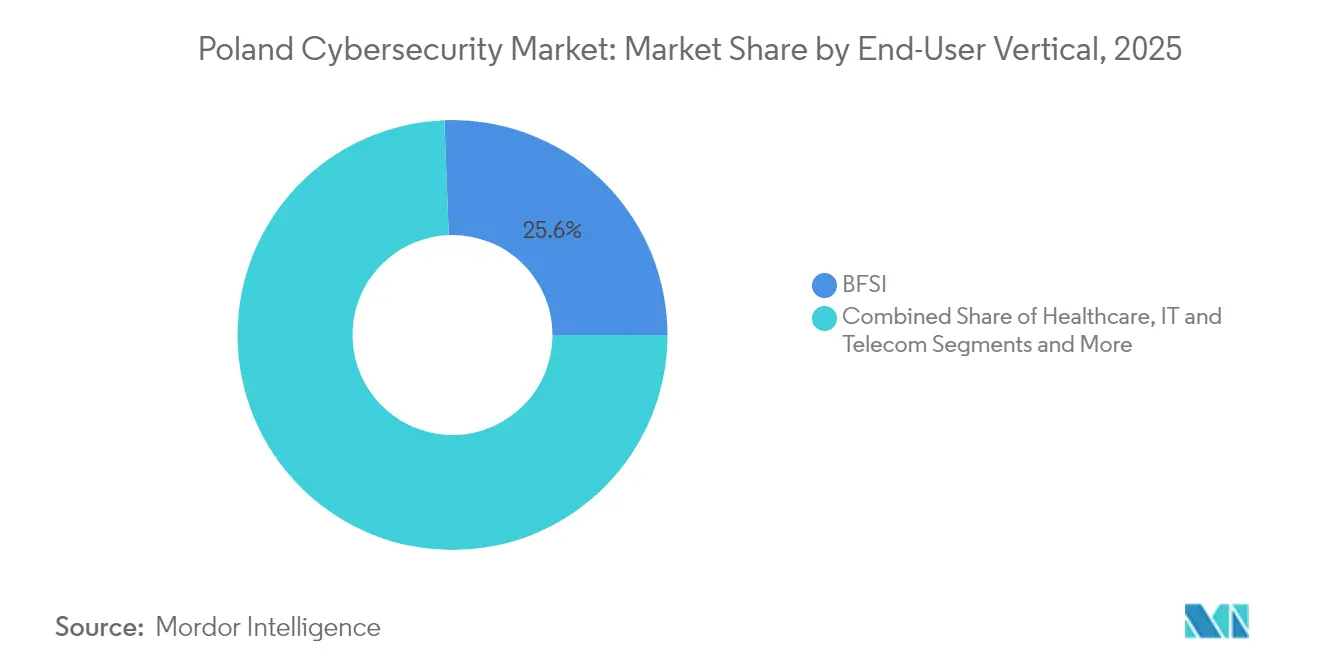
- By end-user vertical, BFSI commanded 25.60% of the Poland cybersecurity market share in 2025, whereas healthcare is advancing at a 18.55% CAGR through 2031.
- By end-user enterprise size, large enterprises held 70.80% share of the Poland cybersecurity market size in 2025, yet SMEs record the highest forecast CAGR at 16.75% over 2026-2031.
Note: Market size and forecast figures in this report are generated using Mordor Intelligence’s proprietary estimation framework, updated with the latest available data and insights as of 2026.
Poland Cybersecurity Market Trends and Insights
Drivers Impact Analysis*
| Driver | (~) % Impact on CAGR Forecast | Geographic Relevance | Impact Timeline |
|---|---|---|---|
| Public-cloud migration among mid-caps | +1.8% | National; Warsaw, Kraków, Wrocław | Medium term (2-4 years) |
| OT-focused attacks on manufacturing belt | +1.5% | Silesia, Wielkopolska | Short term (≤ 2 years) |
| SME managed-security adoption | +1.2% | National; secondary cities | Medium term (2-4 years) |
| Cyber-espionage-driven government spending | +2.0% | National; eastern regions | Short term (≤ 2 years) |
| Digital-banking expansion and zero-trust | +1.0% | National; urban centers | Medium term (2-4 years) |
| National investment in cloud, 5G and AI | +1.3% | National | Long term (≥ 4 years) |
| Source: Mordor Intelligence | |||
Acceleration of Public-Cloud Migration Among Polish Mid-Caps
Mid-sized companies that skipped large on-premises cycles are adopting public clouds as their first major infrastructure platform, accelerating initial outlays on cloud-native security controls. As usage bills rise, boards question whether built-in safeguards are sufficient, pushing specialised vendors into earlier procurement stages. The Poland cybersecurity market therefore gains a new pool of buyers whose adoption timelines are compressed relative to larger peers. Vendors offering simplified policy orchestration win because lean teams need tools that hide cloud complexity [1]Thales Group, “European Cloud Security Study 2024,” thalesgroup.com.
Sharp Rise in OT-Focused Attacks on Poland’s Manufacturing Belt
Automotive and heavy-machinery plants in Silesia and Wielkopolska face a growing number of OT incidents as attackers exploit converged factory and corporate networks. Each new robotic arm adds an ingress point, so plant managers now include segmentation and anomaly detection in retrofit budgets. Integrators opening local offices underline how manufacturing is becoming the next growth vertically after finance and telecoms. Annual reports that now disclose factory downtime underscore that cyber resilience has clear financial materiality.
Surge in SME Managed-Security Adoption Amid Talent Shortage
Small businesses struggle to recruit qualified security personnel, prompting a pivot toward managed detection, response and incident-handling services. Bundled contracts convert variable licence costs into predictable operating expenses and provide documented SLAs that auditors view favourably. Because SMEs account for a large share of national employment, subscription revenue from thousands of smaller clients adds breadth and stability to vendor portfolios.
Cyber-Espionage Concerns Elevating Government Spend
State-linked intrusion attempts have led Warsaw to earmark USD 760 million for cyber-defenses in the current budget cycle. Public tenders increasingly demand supply-chain transparency and knowledge-transfer clauses, raising entry barriers for black-box products and building a domestic pool of certified specialists. The direct injection of funds lifts short-term license volumes and indirectly boosts private sector hiring[3]U.S. Department of State, “U.S.–Poland Cybersecurity MoU,” state.gov .
Restraints Impact Analysis*
| Restraint | (~) % Impact on CAGR Forecast | Geographic Relevance | Impact Timeline |
|---|---|---|---|
| Fragmented public-sector procurement cycles | −0.8% | National; all administrative levels | Long term (≥ 5 years) |
| Budget constraints among municipal bodies | −1.2% | Smaller municipalities; rural regions | Medium term (2-4 years) |
| Low cyber-insurance penetration | −0.5% | National; especially SMEs | Long term (≥ 5 years) |
| Integration complexity in multi-vendor environments | −0.7% | National; large enterprises | Medium term (2-4 years) |
| Source: Mordor Intelligence | |||
Fragmented Public-Sector Procurement Cycles Slowing Deal Closure
Decentralized buying structures force vendors to navigate redundant legal reviews across ministries, agencies and councils. The resulting delays raise bid costs and can deter smaller suppliers, narrowing competitive diversity. Grassroots moves toward joint framework agreements have begun but adoption is uneven, so sales cycles remain protracted.
Budget Constraints Among Municipal Bodies Limiting Advanced Tool Adoption
Local authorities balance essential citizen services against the rising cost of security tooling. National grants often cover hardware but not operating expenses, so councils hesitate to commit to full deployments. This creates uneven protection across critical services, with advanced safeguards more common in cities than rural areas. Vendors offering usage-based pricing report shorter sales cycles in budget-constrained districts.
*Our forecasts treat driver/restraint impacts as directional, not additive. The impact forecasts reflect baseline growth, mix effects, and variable interactions.
Segment Analysis
By Offering: Security Solutions Remain the Revenue Anchor
Solutions captured 67.30% Poland cybersecurity market share in 2025, underlining the enduring dominance of licenses for network firewalls, endpoint suites and cloud access brokers. Enterprise-wide perimeter refreshes ahead of NIS2 compliance sustain order pipelines, prompting resellers to deepen technical-support capabilities. Because frameworks seldom replace every tool at once, incremental upgrades stabilize distributor revenue.
Services are forecast to expand at a 15.05% CAGR, outpacing overall Poland cybersecurity market size growth. Compliance consulting rises fastest as organizations seek external auditors versed in European directives. Managed detection and response attract mid-caps that want always-on coverage without building a 24-hour SOC. Clients now assess service partners by the maturity of their AI toolchains rather than headcount, reflecting a pronounced shift in perceived value.


By Deployment Mode: Cloud Trajectory Accelerates
On-premises deployments accounted for 53.90% of 2025 Poland cybersecurity market size. Sensitive data in defense and energy remains in private data centers, but every hardware refresh prompts architects to question another capital cycle, gradually eroding on-premises share even if absolute spending stays stable.
Cloud security enjoys an 18.15% CAGR outlook, the fastest among deployment models. Thales data showing 61% of European organizations classifying at least 40% of cloud data as sensitive accelerates board approval for advanced encryption and key-management services. Subscription licenses align with operating-expense budgets, reducing friction compared with capital-heavy appliances and speeding adoption.
By End-User Vertical: Healthcare Surges Ahead
The BFSI segment commanded 25.60% Poland cybersecurity market size share in 2025, underscoring its role as benchmark for best practice. PKO Bank Polski logged 8 million active mobile users in Q1-2024, driving adoption of identity-centric, zero-trust architectures that later spread to less regulated industries.
Healthcare is set to grow at a 18.55% CAGR through 2031. Telemedicine connected devices and electronic health records multiply exposure points, so hospital administrators allocate specific ransomware-mitigation budgets. The Polish Hospital Federation counts roughly 170 digital-health start-ups embedding security at design phase, promising a resilient pipeline of future clinical tools.
By End-User Enterprise Size: SMEs Show Rapid Upside
Large enterprises held 70.80% Poland cybersecurity market share in 2025, powered by complex attack surfaces and multi-year roadmaps in banking, telecom and energy. Integrated platforms that reduce alert fatigue give suite vendors leverage during renewals. Purchase decisions by blue-chip firms influence vendor credibility across smaller accounts.
SMEs are projected to grow at a 16.75% CAGR, signaling that security is now viewed as a business continuity essential. Scarce talent pushes owners toward turnkey managed services, freeing internal staff to work on core applications. Recurring revenue from thousands of small subscriptions can match large-enterprise contracts in aggregate, offering vendors a diversified income base.
Geography Analysis
Warsaw commands the largest share of spending, housing headquarters of major banks, telecoms and government agencies. International vendors base regional support centres in the capital, shortening response times and improving customer satisfaction. A dense network of universities supplies skilled graduates who feed a vibrant start-up scene targeting niche security gaps.
Kraków and Wrocław form Poland’s second-tier cybersecurity hubs. Shared-service centres for global technology companies pilot new tools here before worldwide rollouts, giving local teams influence over product roadmaps. Higher salary benchmarks encourage specialists to pursue advanced certifications, deepening the talent pool available to mid-caps in adjacent regions.
Industrial regions such as Silesia and Wielkopolska concentrate heavy-machinery and automotive plants that now demand OT-specific safeguards. Vendors that once served only IT networks partner with automation integrators to secure production lines. Regional development agencies offer grants for cyber-resilience audits, pushing suppliers to combine technology with workforce-training modules that raise overall maturity.
Regulatory Landscape
Poland’s cybersecurity regulatory baseline is anchored in the national KSC framework and its NIS2-aligned update. The amendment to the Act on the National Cybersecurity System entered into force on April 3, 2026, changing classification from legacy essential service operators to a broader split of key entities and important entities, expanding the addressable compliance perimeter beyond traditional critical-infrastructure operators.
Under the amended KSC regime, supervisory authorities gained explicit tools to identify high-risk suppliers and issue security directives during critical incidents. The framework also hardens accountability through management liability and penalties for non-compliance, while setting near-term milestones, including registration via the S46 system by October 3, 2026 and implementation of an information security management system (SZBI) by April 3, 2027. Together, these timelines are shifting procurement priorities toward auditable controls, documented processes, and external assurance.
Value Chain Analysis
The Poland cybersecurity value chain spans global platform vendors and local specialists, with demand moving from one-off tooling toward ongoing assurance, testing, and managed operations. Upstream, international providers supply endpoint, network, cloud, and identity platforms, while distributors and resellers localize delivery through Polish-language support and compliance-aligned configurations, particularly for regulated buyers.
Midstream and downstream work is increasingly led by professional services, systems integrators, and managed security providers that convert KSC and NIS2-driven obligations into implementable architectures, monitoring, and evidence packages. Local firms such as TestArmy Group (via its CyberForces cybersecurity services) participate through penetration testing, red teaming, and ISO/security audits. Engineering-focused consultancies such as TraceRoute42 contribute infrastructure architecture, DevOps support, and cloud security consulting for Kubernetes and Linux estates. Standards and certifications (for example, ISO 27001/ISO 9001 and ISTQB-aligned competence in adjacent QA ecosystems) function as trust signals during vendor selection, and repeat audit and control-validation cycles support recurring service engagements across enterprises and public-sector entities.
Competitive Landscape
Global suites and home-grown specialists compete intensely across sub-segments. Cisco, Check Point and Palo Alto Networks dominate large firewall and endpoint projects by leveraging economies of scale and established support structures. Local champions like Asseco and Comarch counter with Poland-specific compliance modules and bilingual support desks that resonate with public-sector buyers.
Strategic partnerships are a key growth tactic. Asseco’s acquisition of Infocomp expanded its healthcare footprint and opened cross-sell opportunities, while global vendors forge reseller alliances that embed their cloud-security offerings into telecom-operated managed-service bundles. The approach helps reach SMEs that rarely procure direct, blurring the line between competitor and partner.
Investment flows spotlight white-space potential. Venture capital targets start-ups in privileged-access management and deception technology, reflecting confidence in Polish engineering talent. International firms open threat-research labs to tap skilled labour at competitive costs, further enriching the local ecosystem and raising the sophistication of the Poland cybersecurity market.
Poland Cybersecurity Industry Leaders
TestArmy Group
RED TEAM Sp. z o.o. Sp.k.
TraceRoute42 sp. z o.o.
Framework Security
Cyberlands
- *Disclaimer: Major Players sorted in no particular order

Market Opportunities and Future Outlook
The amended KSC Act that entered into force on April 3, 2026 expands the pool of regulated organizations via the key-entity and important-entity model, creating direct whitespace for compliance-led security modernization. The near-term work packages are centered on S46 system registration by October 3, 2026 and the buildout of SZBI-aligned operating models by April 3, 2027. That shift translates into demand for control mapping, policy orchestration, identity governance, logging and monitoring, and evidence management, alongside requirements tied to high-risk supplier identification and strengthened incident-handling obligations. As a result, buyers are expanding scope for supply-chain security assessments, third-party risk programs, and incident response retainers.
A services-heavy opportunity set is also emerging from mandated audit cadence, with key entities required to conduct regular cybersecurity audits and first audits due by April 3, 2028. This supports multi-year pipelines for assurance, red teaming, and technical validation. Providers already positioned in these workflows, including TestArmy Group (CyberForces) for penetration testing and audits and engineering consultancies like TraceRoute42 for cloud-native infrastructure security, can package repeatable compliance modules for mid-caps and SMEs that lack in-house capacity. The regulatory pull also aligns with the market’s shift toward subscription and managed-service contracts, sustaining demand for managed detection and response, continuous compliance reporting, and packaged remediation services that reduce multi-vendor integration burden.
Recent Industry Developments
- July 2026: TestArmy Group continued participation in the European Digital Innovation Hub (EDIH) project in Poland, providing software testing, security audits, and penetration testing services. The engagement supports Poland's cybersecurity services demand and EU-funded program integration. This involvement strengthens the local service footprint and generates recurring revenue through EU-backed security assessments and testing offerings.
- April 2026: TestArmy Group CEO participated in the East x West Forum organized by the BRIDGE foundation. The event reflects company-level engagement in cross-regional cybersecurity discourse. It improves strategic visibility for Polish security services and creates potential cross-border opportunities.
- February 2025: Microsoft announced USD 700 million investment in new data-centre capacity and security-training programmes in Poland. The investment bolsters Polish cybersecurity infrastructure and local capacity building. It lays groundwork for expanded demand for security products and services from a global vendor in Poland.


Research Methodology Framework and Report Scope
Market Definition and Coverage
For this methodology, the Poland cybersecurity market is defined as the revenues earned in Poland from tools and services that prevent, detect, and respond to cyber threats across networks, endpoints, cloud workloads, identities, and data.
Scope exclusions: This sizing excludes general IT hardware refresh cycles and broad IT outsourcing that is not primarily purchased for security outcomes.
Segmentation Overview
- By Offering
- Solutions
- Application Security
- Cloud Security
- Data Security
- Identity and Access Management
- Infrastructure Protection
- Integrated Risk Management
- Network Security Equipment
- Endpoint Security
- Other Services
- Services
- Professional Services
- Managed Services
- Solutions
- By Deployment Mode
- On-Premise
- Cloud
- By End-User Vertical
- BFSI
- Healthcare
- IT and Telecom
- Industrial and Defense
- Manufacturing
- Retail and E-commerce
- Energy and Utilities
- Others
- By End-User Enterprise Size
- Small and Medium Enterprises (SMEs)
- Large Enterprises
Data Sources, Market Sizing, and Validation
Desk Research
Desk work starts by mapping what organizations in Poland are required to protect, and what they are required to report, because that shapes repeatable security spending. We rely on public sources such as CERT Polska incident statistics, guidance and publications from the Ministry of Digital Affairs and relevant national regulators, EU cybersecurity and NIS2 related materials, and datasets from Statistics Poland for sector and employment baselines that help form the demand pool.
To translate those signals into dollars, we also review annual reports and investor presentations of active suppliers, trusted press coverage on major breaches and public programs, and association websites that discuss adoption patterns in areas like cloud and identity management. In addition, a few paid subscriptions are used selectively for company financials and intelligence, and for patent database checks that indicate where product investment is happening. The desk sources mentioned here are illustrative, and many other public documents were also used to collect, validate, and clarify data points during the work.
Primary Interviews and Surveys
Primary work is used to pressure test what desk signals cannot fully explain, especially how budgets split across solutions and services and how deployment choices are changing in Poland. We spoke with a mix of security leaders, IT managers, and service delivery teams across key end users and channel partners, and the inputs were then used to confirm adoption rates, pricing direction, and buying cycles for core security categories.
Distribution of primary research fieldwork respondents
| Company type | Respondent position | Region |
|---|---|---|
| Top tier: 32% | CXOs: 16% | APAC: 39% |
| Mid tier: 51% | Functional/Unit leaders: 33% | EMEA: 36% |
| Smaller Players: 17% | Managers: 51% | Americas: 25% |
Market-Sizing & Forecasting
Market sizing is built using top-down and bottom-up checks, so the final number is anchored to a realistic demand pool and then cross-verified. On the top-down side, we reconstruct the security spend potential in Poland by combining sector level IT intensity signals with cybersecurity priority indicators, and then applying penetration assumptions that are validated through interviews.
Those totals are corroborated with selective bottom-up approximations, which include sampled supplier revenue splits attributable to Poland, channel checks on common deal sizes, and a simple ASP times volume logic for recurring items such as subscriptions and managed services. When direct splits are not available, gaps are handled by using proxy allocation keys such as headcount served, customer counts, and sector mix, followed by interview based correction.
A few market inputs that matter in this model include reported cyber incident volumes and reporting growth, regulated entity coverage and compliance timelines, cloud workload migration pace, managed security service take-up, and the direction of pricing for bundled security stacks. For forecasting, we use scenario analysis supported by a short set of variables (macroeconomic growth, regulation driven adoption timing, and services share expansion), and then we align the scenario weights with what practitioners expect for budget release cycles in Poland.
Data Validation & Update Cycle
Outputs are validated through triangulation across independent signals, and then checked for anomalies before they are finalized. We compare implied spend per organization and spend per employee against practical budget ranges heard in interviews, and we also review year to year shifts to confirm they match visible events such as new compliance deadlines or major incident spikes.
Before sign-off, the model is reviewed in multiple steps so assumption changes are traceable, and unusual variances trigger re-checks of definitions and re-contacts with selected respondents. Reports are refreshed annually, and interim updates are made when material events occur that can change spending behavior. Before delivery, a fresh analyst pass is completed so clients receive the latest updated view based on the newest public signals and expert feedback.
Mordor Intelligence's Poland Cybersecurity Market Estimate Compared With Other Published Estimates
Published market sizes for Poland cybersecurity can look far apart because each publisher draws the market boundary in a slightly different place and then applies its own timing, currency, and pricing assumptions. The biggest differences usually come from whether spending is counted as pure security revenue or as a wider IT protection envelope, and from how services are treated (project work versus recurring managed contracts).
Incident reporting volumes from national response bodies, along with buyer validated budget splits by solution and service, are the checks that keep Mordor Intelligence's estimate aligned to security specific revenues counted only when the purchase is clearly tied to threat prevention, detection, or response. The gaps seen in other figures often trace back to broader inclusion of adjacent IT spend, different base-year conversions, and less consistent handling of subscription renewals versus one time projects.
Benchmark comparison
| Source | Market Size | Gaps in Research Methodology |
|---|---|---|
| Mordor Intelligence | USD 1.61 B (2025) | |
| Government Trade Brief A | USD 0.70 B (2024) | Often presented as reported spending that can undercount multi-year contracts and renewals, and it may reflect partial coverage of the security stack depending on what buyers classify as cybersecurity. |
| Investment Promotion Report B | USD 1.52 B (2024) | Typically compiles secondary estimates with limited visibility into what is included, and year-to-year comparability can be affected by currency timing and whether cloud security and managed services are fully captured. |
The comparison shows that the spread is mainly explained by scope boundaries and how recurring security services are treated over time. By tying the model to observable incident and compliance signals and then rechecking the spend split through interviews, we keep a practical market value that can be replicated with clear assumptions and updated inputs.


Key Questions Answered in the Report
What is the projected Poland cybersecurity market size by 2031?
The market is forecast to reach USD 2.26 billion by 2031 on the back of cloud adoption, heightened public-sector investment and escalating threat levels.
Which segment grows fastest within the Poland cybersecurity industry?
Managed security services, particularly among SMEs, lead growth with a projected 15.05% CAGR as firms seek outsourced 24-hour monitoring and response.
Why is healthcare the fastest-expanding end-user vertical?
Telemedicine, connected devices and stringent data-privacy rules push hospitals to invest in ransomware mitigation and identity management, resulting in a 18.55% CAGR forecast.
How does geopolitical tension affect cybersecurity spending in Poland?
State-linked intrusion attempts have triggered USD 760 million in government allocations for threat intelligence, secure networks and specialist training, boosting license volumes.
Page last updated on:






