
Market Overview
| Study Period | 2020 - 2031 |
|---|---|
| Forecast Data Period | 2026 - 2031 |
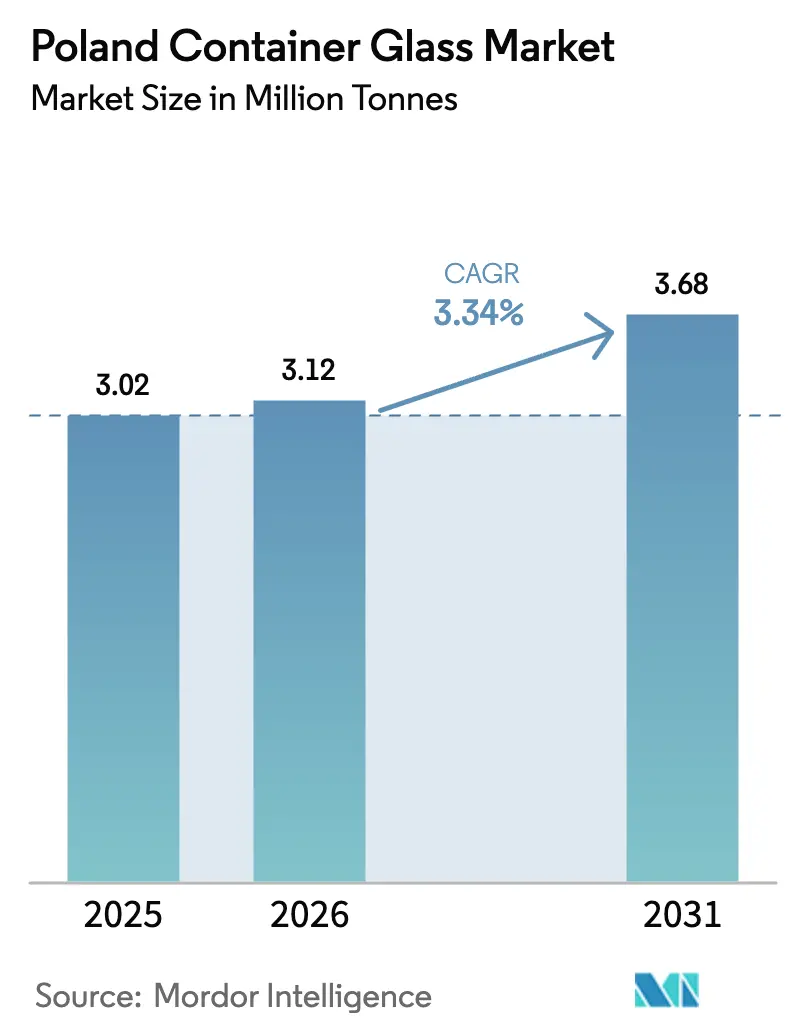
| Base Year Market Size (2025) | 3.02 Million tonnes |
| Market Volume (2026) | 3.12 Million tonnes |
| Market Volume (2031) | 3.68 Million tonnes |
| Growth Rate (2026 - 2031) | 3.34 % |
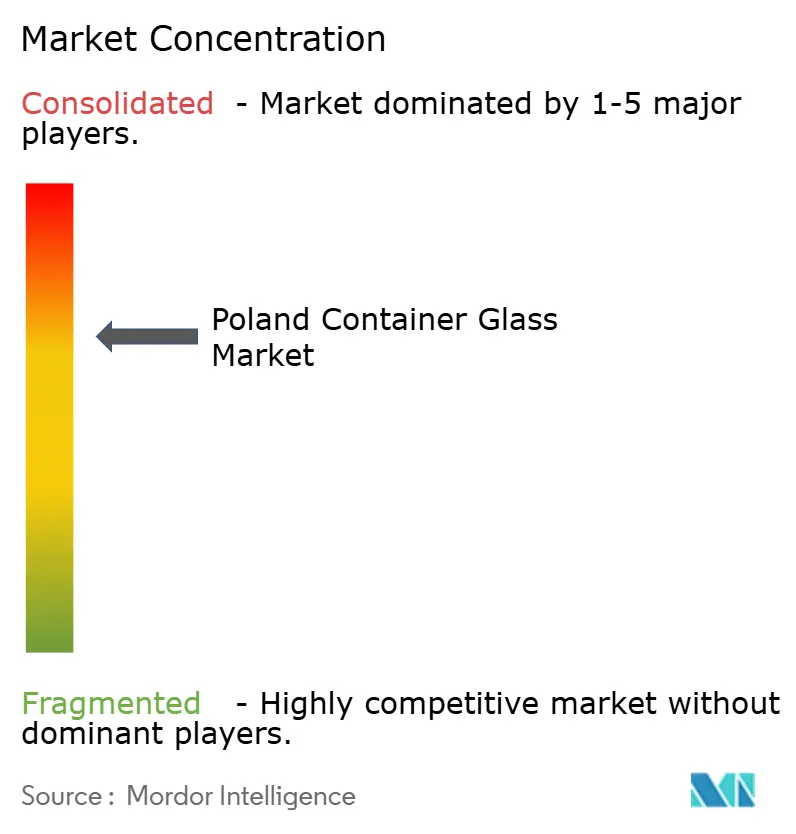
| Market Concentration | Medium |
Major Players *Disclaimer: Major Players sorted in no particular order Image © Mordor Intelligence. Reuse requires attribution under CC BY 4.0. | |
Poland Container Glass Market Analysis by Mordor Intelligence
The Poland Container Glass Market size was valued at 3.02 million tonnes in 2025 and estimated to grow from 3.12 million tonnes in 2026 to reach 3.68 million tonnes by 2031, at a CAGR of 3.34% during the forecast period (2026-2031). Poland’s position as Europe’s second-largest container glass producer, with more than 1.8 million tonnes of annual capacity, enables domestic manufacturers to serve both the local beverage industry and regional export demand efficiently. The recent implementation of the national deposit return system (DRS) in January 2025 created a PLN 1.00 deposit on refillable glass versus PLN 0.50 on plastic or metal, strengthening structural demand for glass packaging in alcoholic and non-alcoholic beverages. Manufacturers benefit from abundant domestic silica sand, limestone, and soda ash, most notably the Quarzwerke Biała Góra deposit, which reduces raw-material procurement risks and transportation costs. Technological investment in hybrid and fully electric furnaces is improving energy efficiency by 15-20% while cutting emissions up to 60%, partially cushioning the impact of volatile natural-gas prices.
Key Report Takeaways
- By end-user, beverages captured 60.72% of the Poland container glass market share in 2025.
- By color, the Poland container glass market size for amber glass is projected to grow at a 3.84% CAGR between 2026-2031.
Note: Market size and forecast figures in this report are generated using Mordor Intelligence’s proprietary estimation framework, updated with the latest available data and insights as of 2026.
Poland Container Glass Market Trends and Insights
Drivers Impact Analysis*
| Driver | (~) % Impact on CAGR Forecast | Geographic Relevance | Impact Timeline |
|---|---|---|---|
| Export Potential and EU Market Integration | +0.8% | Poland, with spillover to Germany, Czech Republic, and broader EU markets | Medium term (2-4 years) |
| Technological Advancements in Glass Manufacturing | +0.6% | National, with early adoption in Silesia and Greater Poland regions | Long term (≥ 4 years) |
| Government Regulations Supporting Recycling | +0.9% | National, with enhanced impact in major urban centers | Short term (≤ 2 years) |
| Rising Demand for Sustainable Packaging | +0.7% | Global, with concentrated effects in Warsaw, Kraków, and Gdańsk metropolitan areas | Medium term (2-4 years) |
| Growth in Beverage Industry | +0.5% | National, with particular strength in wine-consuming regions | Medium term (2-4 years) |
| Expansion of Cosmetics and Pharmaceuticals | +0.4% | National, with clustering around pharmaceutical manufacturing hubs | Long term (≥ 4 years) |
| Source: Mordor Intelligence | |||
Export Potential and EU Market Integration
Polish producers ship 27.77% of container-glass exports to Germany, benefiting from tariff-free EU trade and lower labor costs that narrow delivered-price gaps with German and Italian rivals. The integrated market gives local plants shorter lead times to large German bottlers, a key advantage as European buyers rebuild inventories after 2024 destocking cycles. O-I’s European revenue fell 7% in Q1 2024, opening share opportunities for cost-competitive Polish suppliers. Alignment with the EU Emissions Trading System simplifies compliance paperwork, allowing Polish exporters to avoid duplicate carbon-accounting costs when shipping within the bloc. OEM proximity also reduces empty-container mileage, cutting freight emissions and logistics spend.
Technological Advancements in Glass Manufacturing
Hybrid melters that combine electric boosting and oxygen-fired burners became operational in Jarosław and Poznań in 2024, delivering 15-20% specific energy savings and enabling flexible batch runs that suit Poland’s growing craft-beverage segment. MAGMA modular furnaces shorten rebuild downtime from 120 days to fewer than 60 days, extending asset life and smoothing cash-flow requirements. Plants now use closed-loop controls to push cullet ratios above 70%, a milestone made possible by the January 2025 DRS surge in returned glass. Energy-efficiency gains translate into CO₂ reductions nearing 60%, supporting corporate net-zero roadmaps and easing ETS credit costs. Automation upgrades, including hot-end inspection cameras, are improving quality yield by 2-3 percentage points and reducing spoilage.
Government Regulations Supporting Recycling
The DRS grants a PLN 1.00 deposit on refillable glass compared with PLN 0.50 on plastic or metal, instantly making refillable glass the most economical choice on a total-cost-of-ownership basis for beverage brand owners. Parallel EU Packaging and Packaging Waste Regulation rules force minimum recycled-content thresholds that favor cullet-rich glass over virgin-plastic packaging.[1]European Commission, “Packaging and Packaging Waste,” europa.eu Energy-cost mitigation delivered through state-subsidized electricity and gas tariffs smooths furnace-fuel bills for qualifying high-usage plants. Environmental fee structures charge PLN 0.64 per kg of particulate and PLN 0.44 per kg of NOₓ released, further incentivizing low-emission furnace retrofits.
Rising Demand for Sustainable Packaging
Poland’s USD 5.48 billion cosmetics market is pivoting to recyclable containers as global beauty conglomerates impose Scope 3 emissions targets on regional sourcing teams. Craft breweries and premium spirits brands opt for glass because of its infinite recyclability and premium shelf appeal, which together strengthen brand storytelling around sustainability. EU eco-design mandates require clear labeling and single-material construction, disqualifying many layered plastic films; glass passes these tests naturally. Retailers in Warsaw, Kraków, and Gdańsk report double-digit growth in private-label SKUs that switched from plastic to glass ahead of new eco-score labeling rules. Corporate ESG frameworks using ISO 14001 certification are now embedding supplier glass-content thresholds in procurement bids.
Restraints Impact Analysis*
| Restraint | (~) % Impact on CAGR Forecast | Geographic Relevance | Impact Timeline |
|---|---|---|---|
| High Energy and Production Costs | -0.7% | National, with concentrated impact in energy-intensive production regions | Short term (≤ 2 years) |
| Competition from Alternative Materials | -0.5% | Global, with particular pressure in dairy and juice packaging segments | Medium term (2-4 years) |
| Environmental Compliance Costs | -0.3% | National, with higher impact in industrial zones subject to stricter emissions monitoring | Long term (≥ 4 years) |
| Volatility in Raw Material Supply | -0.4% | National, with supply chain dependencies on regional sand and soda ash suppliers | Medium term (2-4 years) |
| Source: Mordor Intelligence | |||
High Energy and Production Costs
Energy can account for up to 30% of container-glass manufacturing overhead, and natural-gas spot prices remained volatile in 2024, eroding margins for plants locked into long-term supply contracts. Ardagh Glass Packaging Europe and Africa saw adjusted EBITDA fall 55% in Q1 2024 because fixed-cost absorption declined as throughput fell. EU ETS allowances cost major producers an estimated USD 37 million annually, translating to several euro-cent increases per bottle. Capital expenditure for a single furnace rebuild ranges from USD 10 million to USD 15 million, limiting flexibility to curtail production if demand slips. Although state fuel-price stabilization partially offsets the burden, energy input remains the most significant variable cost.
Competition from Alternative Materials
Fiber-based cartons gained share in German dairy, and Elopak is marketing similar conversions in Polish juice and milk sectors, targeting cost-sensitive mass-market SKUs that traditionally used returnable glass. Metal cans are also pressuring beer and energy-drink volumes thanks to lightweighting and improved recycling logistics. Beauty-category trials with refillable aluminum pods introduce uncertainty for single-use fragrance glass. Meanwhile, polymer suppliers have introduced rPET bottles with enhanced barrier layers that extend shelf life, removing one of glass’s historic advantages in food preservation.
*Our forecasts treat driver/restraint impacts as directional, not additive. The impact forecasts reflect baseline growth, mix effects, and variable interactions.
Segment Analysis
By End-user: Beverages Extend Leadership as Cosmetics Accelerate
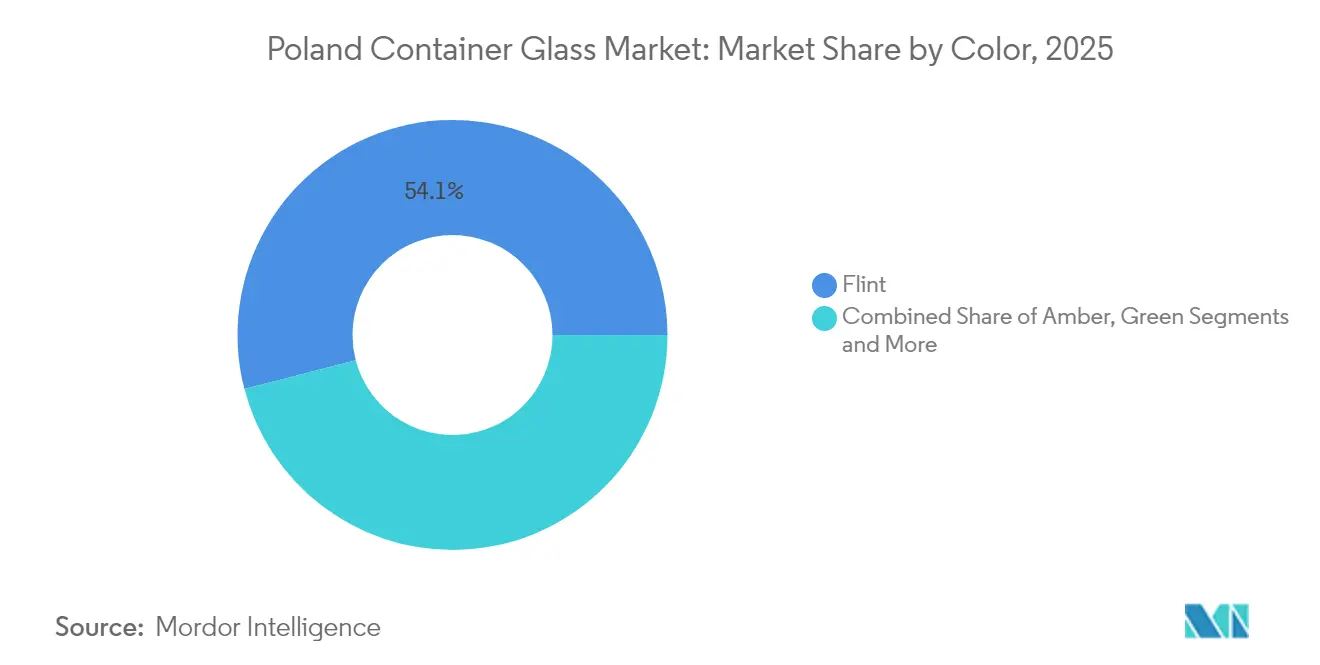
The beverages segment accounted for 60.72% of Poland's container glass market share in 2025, underpinned by Poland’s thriving beer culture and a wine market that reached 13.1 million 9-liter cases after ten years of 3.7% annual expansion.Non-alcoholic producers, especially regional juice cooperatives, are returning to refillable glass to benefit from the PLN 1.00 deposit, protecting margins as PET resin prices rise. Key breweries in Poznań and Żywiec forged long-term supply contracts with nearby glass plants, locking in cullet supply and smoothing furnace loads. Food processors remain steady buyers of jars for preserved products, benefiting from Poland's container glass market size economies in standard neck-finish formats that support line-speed efficiency.
The cosmetics and personal-care category represents the fastest-growing end-user, forecast at a 3.91% CAGR through 2031, as both domestic and export-oriented beauty brands integrate eco-claims into packaging briefings. Luxury skincare launches in Warsaw department stores feature thick-walled flint glass that accentuates premium textures, while indie brands favor amber for natural-ingredient protection. Pharmacist-owned dermocosmetic lines distributed through apotek channels increasingly specify small-format amber glass that fits shelf-ready packaging dimensions. Poland's container glass industry innovators offer decoration services, including ink-jet printing and acid-etch finishes, meeting rising personalization needs without compromising recyclability. Export-oriented perfumery producers in Kraków capitalize on the market’s integrated logistics to ship filled bottles quickly to German and Scandinavian distributors.


By Color: Dominance of Flint, Momentum in Amber
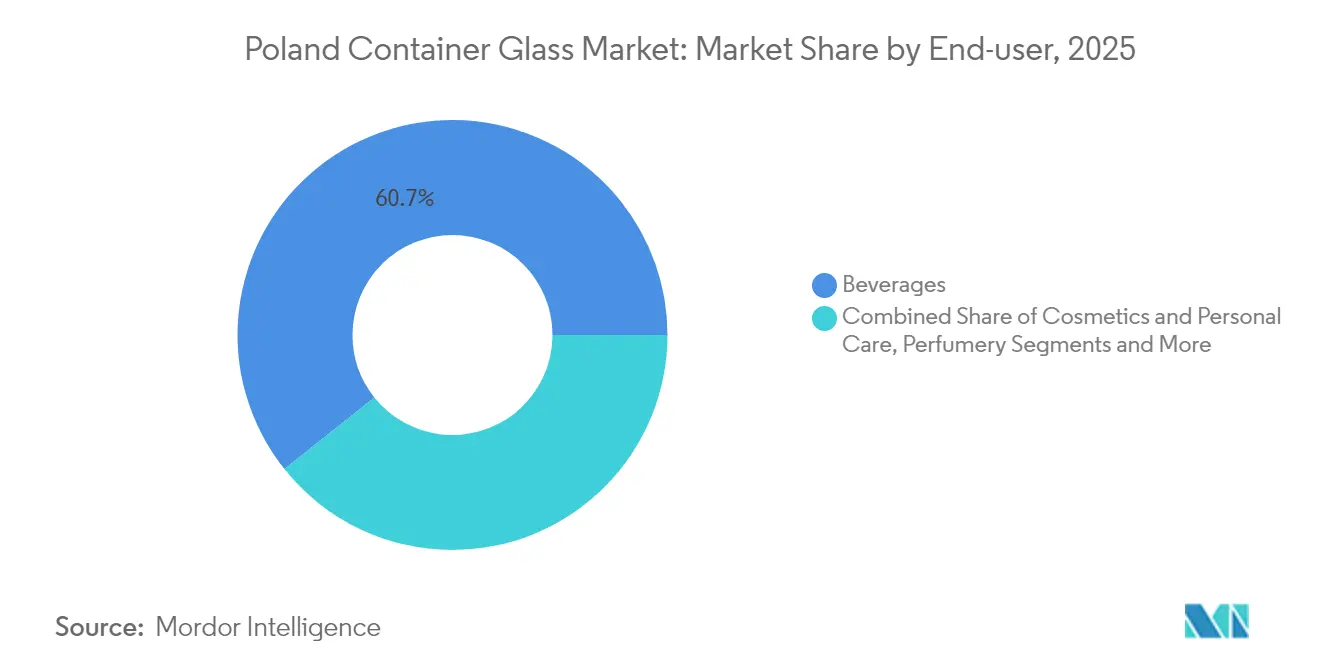
Flint retained 54.05% of Poland's container glass market size in 2025 as premium liquor and clear-label wine APIs demand transparency for branding. High-clarity flint glass leverages advanced batch recipes with low iron content sourced from Biała Góra sand. Spirits producers often select heavyweight shapes, relying on flint’s sparkle to project quality. Machine upgrades at Jarosław now enable rapid mold changeovers, allowing glasshouses to service both high-volume vodka SKUs and low-volume craft distillates without long downtime. Flint cullet availability improved sharply after DRS launch, stabilizing batch consistency and lowering furnace energy demand by up to 2% per percentage-point cullet gain.
Amber glass is growing at a 3.84% CAGR, with pharmaceutical and craft-beer applications valuing its UV-barrier up to 400 nm that guards against vitamin degradation and hop spoilage. Poland’s life-sciences clusters near Łódź and Poznań are scaling OTC syrup lines that require 125-ml amber bottles. Craft brewers deploy long-neck amber bottles that align with global category cues and help differentiate from aluminum can competitors. Process optimization has pushed amber colorant dosing accuracy to sub-ppm ranges, minimizing off-tone rejects and boosting line yield. Green glass remains significant for traditional Riesling and Veltliner wines aimed at the Central European market, but usage is flat as bag-in-box gains share among price-conscious consumers. Specialty tints such as cobalt blue occupy niche skincare markets and command higher margins, yet volumes are too small to influence furnace scheduling beyond opportunistic runs.
Geography Analysis
Poland lies at the center of European supply chains, and 27.77% of Poland's container glass market exports head to Germany, leveraging zero tariffs and one-day truck transit times to Munich, Berlin, and Hamburg bottlers. Czech, Slovak, and Baltic beverage fillers make up another sizeable share, attracted by competitive Polish freight rates and flexible order quantities. The Silesia region hosts a dense cluster of sand quarries and natural-gas pipelines that feed high-capacity furnaces, giving the area a cost-of-production edge. Meanwhile, Greater Poland’s proximity to Baltic ports enables direct containerized shipments of filled products to Scandinavian markets within 48 hours.
Domestically, the DRS that started in January 2025 improves glass collection logistics nationwide, underpinning rising cullet ratios that reduce energy intensity at furnaces from Kraków to Szczecin. Major retail chains provide 20,000 reverse-vending machines, enhancing post-consumer return rates and slashing inbound-raw-material trucking distances. Urban centers such as Warsaw and Wrocław observe higher cosmetics-package throughput, consistent with income-driven demand for premium skincare housed in glass. Pharmaceutical glass demand is strongest near the Łódź-Poznań corridor, where contract-manufacturing organizations operate GMP-compliant lines.
Poland container glass market participants also benefit from government energy-support schemes granting discounted tariffs to energy-intensive plants, easing the shock of natural-gas price spikes that battered Western European peers in late 2024. EU border-adjustment carbon mechanisms do not apply to intra-EU trade, so Polish shipments circumvent taxes facing Turkish or Ukrainian competitors, sustaining volume momentum into 2026. Infrastructure enhancements, including a new east-west highway spur, will cut lead times to the Czech border by 90 minutes when fully opened in 2027, further strengthening export competitiveness.
Regulatory Landscape
Poland's container glass manufacturers work within the packaging-waste and industrial-emissions framework led by the Ministry of Climate and Environment, with monitoring and enforcement carried out by Głowny Inspektorat Ochrony Srodowiska (GIOS). A key 2025 consolidated legal text for the Act on Packaging and Packaging Waste reinforces design and compliance requirements, including recyclability and hazardous-substance limits (for example, 100 mg/kg for the combined concentration of lead, cadmium, mercury, and chromium VI), which in turn shapes material selection and supplier specifications across glass packaging formats.
On the production side, glass plants operate under integrated-permit requirements pursuant to Environmental Protection Law. This approach aligns industrial operations with Best Available Techniques (BAT) and EU BREF guidance for emissions, monitoring, and reporting. Local permitting processes and notifications tied to industrial installations, together with sector coordination through bodies such as Zwiazek Pracodawcow Polskie Szklo (ZPPS), keeps compliance focus on furnace modernization, particulate and NOx control, and higher cullet use, which reduces the regulatory burden linked to emissions and waste-handling obligations.
Competitive Landscape
Poland's container glass market features O-I Glass, Verallia, and Ardagh Glass as anchor multinationals, supplemented by regional specialists such as BA Glass Poland and CP Glass. O-I operates Jarosław and Poznań plants with a combined capacity topping 800 kt, and its EUR 400 million senior notes offering in May 2024 earmarks funds for furnace electrification and MAGMA pilot lines.[3]O-I Glass, “€400 Million Senior Notes Offering,” o-i.comVerallia invested EUR 34.6 million in H1 2024 to upgrade Northern and Eastern Europe operations, signaling a long-term commitment to the Polish asset base despite volume softness. Ardagh’s 55% EBITDA drop in Q1 2024 triggered efficiency reviews of Polish furnaces, accelerating digital controls to improve pull-rate utilization.
Local manufacturers are carving out niches via advanced decoration technologies. Dekorglass in Działdowo operates multi-pass screen-printing lines capable of producing 8-color designs at 450 bottles per minute for craft-gin exporters. Stoelzle Częstochowa specializes in perfumery bottles with proprietary engraving molds, capturing high margins by supplying French luxury houses. Forglass, a domestic furnace-engineering firm, licenses oxy-fuel combustion chambers to regional plants, deepening local value capture in capex spend. BA Glass Poland improves flint-glass clarity through continuous oxygen-bubble removal systems, appealing to vodka brands that demand pristine transparency.
Strategic directives revolve around decarbonization and supply-chain agility. Producers prioritize cullet procurement contracts linked to DRS flows, ensuring stable quality and pricing. Hybrid furnace pilots target production of smaller lot sizes, matching demand variability in seasonal craft-beverage and limited-edition cosmetics packaging. ESG metrics influence buyer scorecards; hence, glassmakers publicize annual sustainability reports detailing. Simultaneously, portfolio rationalization sees multinationals shutter under-utilized European furnaces and concentrate output in efficient Polish hubs, raising Poland’s share of group production over the forecast horizon.
Poland Container Glass Industry Leaders
Ardagh Glass S.A.
Stoelzle Glass Group
O-I Glass, Inc.
Gerresheimer AG
Verallia Polska Sp. z o.o.
- *Disclaimer: Major Players sorted in no particular order

Market Opportunities and Future Outlook
The January 2025 national deposit return system (DRS), with a PLN 1.00 deposit on refillable glass versus PLN 0.50 on plastic or metal, improves the commercial pathway for refillable and cullet-rich container glass in beverages, where glass already holds the largest end-user share. Higher return flows also expand the operating window for plants to push cullet ratios upward, complementing factory-level investments that target energy and emissions performance rather than only incremental capacity.
A clear near-term opportunity is in decarbonization-linked upgrades and services around furnace efficiency, filtration, and recycled-glass integration. In March 2026, Stoelzle Czestochowa completed a furnace repair that incorporated a new external cullet dosing system, pointing to ongoing demand for equipment and process solutions that improve recycled input quality and reduce CO2 intensity. Ardagh Glass Packaging's technology upgrades at its Wyszkow facility, including ceramic candle filters and heat-recovery measures alongside closed-loop cooling, also indicate near-term whitespace for suppliers of emissions control, heat management, and water-saving systems, as well as for glassmakers able to commercialize lower-footprint bottles for food and non-alcoholic beverages where regional demand has been comparatively resilient.
Recent Industry Developments
- May 2026: Ardagh Glass Group launches of Clearly Ardagh transformation initiative. The initiative broadens strategic realignment across its European glass footprint, with potential EBITDA uplift and competitive repositioning that could influence Polish operations and supplier dynamics. The program reflects a broader push to modernize production networks and improve cost efficiency in the European container glass sector.
- May 2026: Stoelzle Glass Group restarts furnace no.1 at Czestochowa plant following modernization. The restart reinforces Poland production resilience for high margin segments. It enhances supply continuity for Polish beverage and cosmetic glass packaging and supports local capacity utilization.
- March 2026: Stoelzle Glass Group modernizes furnace no.1 and production lines at Czestochowa; inauguration on March 24, 2026. The modernization improves facility efficiency and expands output capacity at the Czestochowa hub. It strengthens Czestochowa hub capability, enabling higher output and potential energy efficiency gains.


Research Methodology Framework and Report Scope
Market Definition and Coverage
For this study, the market covers container glass produced and consumed in Poland for packaging uses, mainly bottles and jars, and it is sized and forecast in volume terms (tonnes) across the study period.
Scope exclusions: This sizing excludes flat glass, fiberglass, and other non-container glass products, and it also excludes packaging formats that are not glass.
Segmentation Overview
- By End-user
- Beverages
- Alcoholic
- Beer
- Wine
- Spirits
- Other Alcoholic Beverages (Cider and Other Fermented Drinks)
- Non-Alcoholic
- Juices
- Carbonated Drinks (CSDs)
- Dairy Product Based Drinks
- Other Non-Alcoholic Beverages
- Alcoholic
- Food (Jam, Jelly, Marmalades, Honey, Sausages and Condiments, Oil, Pickles)
- Cosmetics and Personal Care
- Pharmaceuticals (excluding Vials and Ampoules)
- Perfumery
- Beverages
- By Color
- Green
- Amber
- Flint
- Other Colors
Data Sources, Market Sizing, and Validation
Desk Research
Desk research was used to build the factual base for Poland-specific demand and supply signals, which then guided the interview plan and the modeling assumptions. We relied on public, non-paywalled sources such as Statistics Poland (GUS) for industrial and consumption indicators, Eurostat for trade and manufacturing series, and UN Comtrade for glass container-related import and export patterns.
To keep the model grounded in packaging reality, we also referred to the European Commission for policy timelines that affect packaging choices, and industry bodies such as FEVE for container glass context in Europe. Company annual reports, investor decks, and trusted press were used to time capacity additions, furnace rebuild cycles, and energy cost commentary that can shift output. In a few places, paid subscriptions for company financials and intelligence, news and financials, patent databases, and shipment-level trade data were used to cross-check timelines and fill missing company-level context. These sources are illustrative rather than exhaustive, since many other references were also used for data collection, validation, and research clarification.
Primary Interviews and Surveys
We use interviews and surveys with glass producers, packaging buyers, distributors, recyclers, and furnace specialists in Poland. Responses test capacity utilization, product mix, realized pricing, export exposure, and demand by end use, while filling gaps in public data and checking the final model.
Distribution of primary research fieldwork respondents
| Company type | Respondent position |
|---|---|
| Top tier: 28% | CXOs: 15% |
| Mid tier: 47% | Functional/Unit leaders: 30% |
| Smaller Players: 25% | Managers: 55% |
Market-Sizing & Forecasting
Sizing was built using a top-down approach where Poland container glass demand was reconstructed from packaging-linked indicators and trade flows, which were then mapped into tonnes using practical conversion factors and industry norms. The total was corroborated with selective bottom-up checks, such as sampled capacity-by-furnace timelines, typical utilization ranges, and a few volume cross-checks built from buyer-side procurement patterns, which helped us adjust for gaps.
Inputs that mattered most in the model included Poland beverage output and packaging intensity signals, food packaging trends for glass-suitable categories, import and export movements for glass containers, furnace rebuild and capacity change timing, and cullet collection dynamics that influence mix and effective supply. Where direct numbers were not consistently available, we used bounded assumptions that were validated in interviews and kept stable across the time series, then tested sensitivity so the model did not overreact to a single data point.
Forecasting leaned on scenario analysis supported by a light multivariate view, where demand direction was linked to consumption and production indicators, trade balance signals, and the timing of capacity normalization after maintenance cycles. Assumptions were reviewed with primary respondents so the forward curve stayed realistic for Poland rather than being driven by a generic regional growth rate.
Data Validation & Update Cycle
Validation was done through repeated triangulation across independent signals, since a single dataset rarely explains container glass movement on its own. We checked for anomalies such as sudden volume swings that did not align with trade, production, or capacity updates, and those points were reworked or re-tested through quick follow-up calls before sign-off.
A multi-step analyst review is used so arithmetic, units, and time-period alignment errors are caught early. Then the final totals are compared against external reality checks such as implied production capacity, utilization feasibility, and historical trend consistency. Reports are refreshed annually, with interim updates when material events occur, and a final pre-delivery pass is completed so clients receive the latest updated view.
Mordor Intelligence's Poland Container Glass Market Size Compared With Other Published Estimates
It is normal to see different market sizes for the same topic, because teams may size different things, in different units, and with different timing rules for currency and base years. The spread can also come from how each publisher treats trade, whether they use production or consumption logic, and how often the inputs are refreshed.
Key gap drivers in Poland container glass are usually the unit choice (volume tonnes versus value), the boundary between domestic demand and export-led production, and the way average selling price is handled when energy costs and product mix are changing. In our work, the refresh-led difference is that exchange-rate timing and price-per-ton assumptions are re-validated close to publication, which tends to keep the tonnage path stable while preventing value conversions from drifting, a discipline applied by Mordor Intelligence.
Benchmark comparison
| Source | Market Size | Gaps in Research Methodology |
|---|---|---|
| Mordor Intelligence | USD 3.02 M (2025) | |
| Trade Data Platform A | USD 293.66 M (2024) | Often represents import value for HS-coded glass containers rather than the total Poland market, so it can understate domestic production and ignore local consumption supplied by Polish plants. |
| Industry Model B | USD 5.00 B (2026) | May reflect broader glass manufacturing revenue and not only container glass packaging, and it can also mix nominal revenues with limited checks on product scope and unit consistency. |
The table shows that most differences are explainable once the boundary and the unit are clarified, since a trade-value view, a broad manufacturing revenue view, and a container-glass tonnage view are not measuring the same thing. By keeping assumptions tied to repeatable signals like capacity timing, trade direction, and packaging demand indicators, we can present a practical estimate that clients can trace and re-check over time.


Key Questions Answered in the Report
How large will Poland’s container-glass volume be in 2031?
Forecasts indicate 3.68 million tonnes by 2031, reflecting a 3.34% CAGR from 2026.
Which end-user generates the most demand?
Beverages remain dominant, delivering 60.72% of 2025 volume and benefiting most from the deposit return system.
Why is amber glass growing faster than other colors?
Pharmaceutical UV-protection needs and the craft-beer boom drive amber demand, underpinning its 3.84% CAGR outlook.
How does the national DRS influence glass demand?
The PLN 1.00 deposit on refillable bottles materially lowers lifecycle costs, boosting refillable-glass orders for beverage producers.
Which companies lead furnace-modernization investments?
O-I, Verallia and Ardagh are investing in hybrid and electric furnaces to trim energy use and meet EU decarbonization targets.
Page last updated on:


 Your data is secure and never sold or shared.


