
Market Overview
| Study Period | 2021 - 2031 |
|---|---|
| Forecast Data Period | 2026 - 2031 |
| Base Year Market Size (2025) | USD 93.99 Billion |
| Market Size (2026) | USD 99.28 Billion |
| Market Size (2031) | USD 130.62 Billion |
| Growth Rate (2026 - 2031) | 5.63 % |
| Market Concentration | Low |
Major Players *Disclaimer: Major Players sorted in no particular order Image © Mordor Intelligence. Reuse requires attribution under CC BY 4.0. | |
Poland Construction Market Analysis by Mordor Intelligence
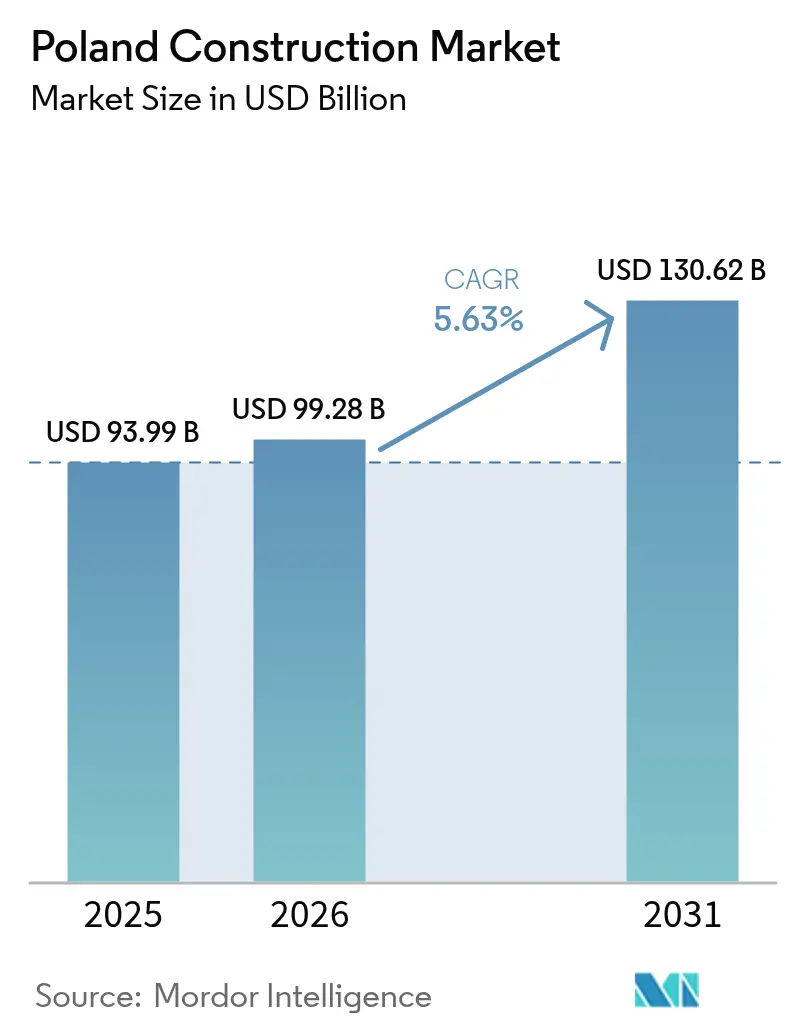
The Poland Construction Market size was valued at USD 93.99 billion in 2025 and estimated to grow from USD 99.28 billion in 2026 to reach USD 130.62 billion by 2031, at a CAGR of 5.63% during the forecast period (2026-2031). Robust EU Recovery and Resilience Facility inflows, a strategic pivot toward renewable energy assets, and private-sector appetite for housing underpin this sustained expansion in the Poland construction market. Opportunities are strongest where energy transition targets intersect with transport modernization, enabling contractors that master grid-scale renewables, offshore wind logistics, and high-speed rail works to secure premium margins. Prefabricated volumetric housing is scaling quickly as the State Development Fund accelerates factory-built supply, while ESG-linked retrofits bolster renovation volumes in commercial real estate. Competitive intensity remains high because no single firm exceeds a 5% revenue foothold, yet specialist know-how in carbon-capture cement plants and marine foundations allows smaller players to win high-value contracts.
Key Report Takeaways
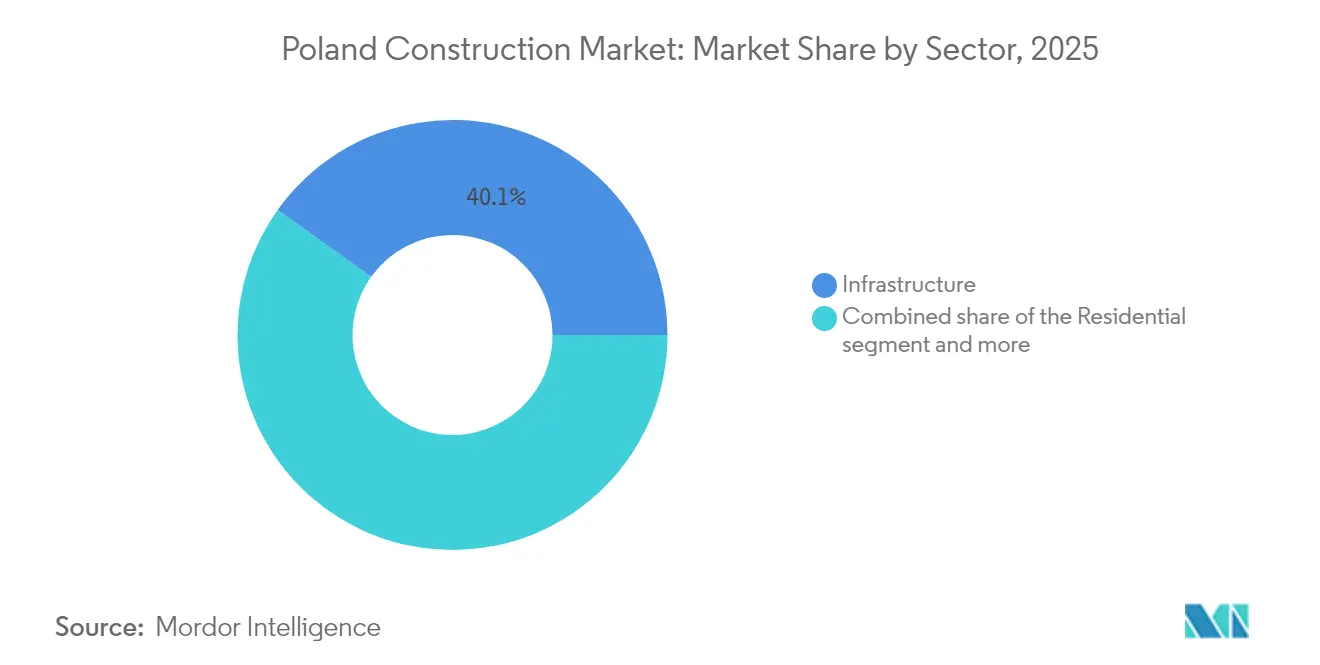
- By sector, infrastructure construction led with 40.12% of Poland's construction market share in 2025, and residential construction is expanding at a 6.76% CAGR through 2031.
- By construction type, new builds commanded 68.12% share of the Poland construction market size in 2025, while renovation is growing at a 5.73% CAGR to 2031.
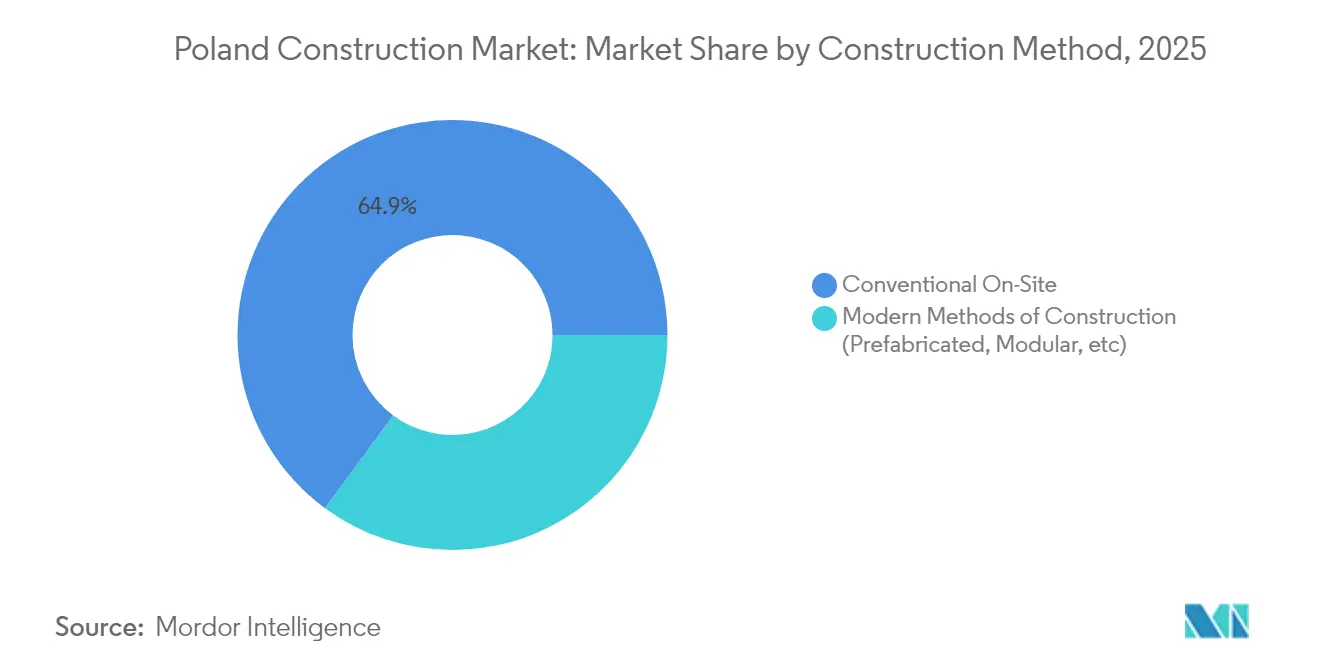
- By construction method, conventional on-site techniques held a 64.90% share in 2025, whereas modern methods are advancing at a 11.62% CAGR to 2031.
- By investment source, Public entities controlled 52.10% of project funding in 2025, yet private investment is growing briskly at a 7.01% CAGR to 2031.
- By geography, Warsaw accounted for 25.40% revenue in 2025; the Rest of Poland is projected to accelerate at a 6.24% CAGR over the forecast horizon.
Note: Market size and forecast figures in this report are generated using Mordor Intelligence’s proprietary estimation framework, updated with the latest available data and insights as of 2026.
Poland Construction Market Trends and Insights
Drivers Impact Analysis*
| Driver | % Impact on CAGR Forecast | Geographic Relevance | Impact Timeline |
|---|---|---|---|
| EU Recovery & Resilience Facility funds inflow | +1.8% | National, with concentration in Warsaw, Kraków, Gdańsk | Medium term (2-4 years) |
| Rapid urban rail & road modernization pipeline | +1.2% | National, with early gains in Warsaw, Łódź, Wrocław corridors | Long term (≥ 4 years) |
| REPowerEU-driven grid-scale renewables capex | +1.1% | Coastal regions (Pomerania), with spillover to central Poland | Long term (≥ 4 years) |
| ESG-linked green building demand from occupiers | +0.9% | Warsaw, Kraków, major metropolitan areas | Medium term (2-4 years) |
| Prefab volumetric housing promoted by the State Development Fund | +0.6% | National, with a focus on smaller municipalities | Short term (≤ 2 years) |
| Source: Mordor Intelligence | |||
EU Recovery & Resilience Facility Funds Inflow
Poland secured USD 64.58 billion under the EU Recovery and Resilience Facility, making it the bloc’s third-largest beneficiary. Nearly 47% targets green projects, front-loading demand for contractors versed in energy and transport mega-projects. Local governments already received USD 16.75 billion in 2024, disbursing USD 6.75 billion to thermal-modernization programs that cover 380,000 homes, thereby compressing tender timelines. Funding velocity exceeds historic EU averages, rewarding firms with proven procurement networks. A discrete USD 925 million Clean Air allocation keeps renovation backlogs buoyant through 2027[1]European Parliament, “Recovery and Resilience Facility Poland Country Factsheet,” European Parliament, europarl.europa.eu.
Rapid Urban Rail & Road Modernization Pipeline
The Centralny Port Komunikacyjny scheme underpins a 2,000-kilometer high-speed rail build-out that stretches into 2035, while the Łódź tunnel contract, worth USD 440 million, illustrates technical complexity that favors specialist consortia. Parallel road plans earmark USD 75 billion for 2,500 kilometers of expressways, and regulatory extensions to 2026 provide planning certainty for long-horizon assets. Multimodal hubs will fuse air, rail, and road nodes, spawning feeder works in logistics parks and intermodal yards[2]Katarzyna Głowacka, “High-Speed Rail Master Plan 2035,” Centralny Port Komunikacyjny, cpk.pl.
ESG-Linked Green Building Demand from Occupiers
Over 40% of Warsaw’s office stock now carries green certificates, an above-global average that elevates sustainability to a lease prerequisite. Incoming EU rules make zero-emission status mandatory for commercial assets by 2030, forcing landlords to commence deep retrofits or face write-downs. Industrial developer Panattoni proved cost resilience by achieving BREEAM Outstanding at its Szczecin site with 50.8% CO₂ cuts, showing how occupiers accept price uplift for lower operational carbon. Government grants worth USD 2 billion toward thermal upgrades extend green incentives to residential developers.
REPowerEU-Driven Grid-Scale Renewables Capex
Poland intends to install 26.8 GW of solar capacity by 2025, requiring major grid reinforcement. The Baltica 2 offshore wind farm alone triggers USD 3 billion of construction, while the state grid operator is injecting USD 16 billion into transmission upgrades through 2034. These commitments anchor multiyear pipelines for contractors mastering high-voltage cabling, subsea foundations, and port modernizations[3]Waldemar Bucior, “Poland’s National Grid Expansion Plan 2024-2034,” Polskie Sieci Elektroenergetyczne, pse.pl.
Restraints Impact Analysis*
| Restraint | % Impact on CAGR Forecast | Geographic Relevance | Impact Timeline |
|---|---|---|---|
| Acute skilled-labor shortages & wage inflation | -1.4% | National, with a severe impact in the Warsaw, Kraków metropolitan areas | Short term (≤ 2 years) |
| Volatile cement & steel spot prices tied to ETS costs | -0.8% | National, with manufacturing concentration in Silesia, Małopolska | Medium term (2-4 years) |
| Lengthy environmental permit appeals are slowing projects | -0.6% | National, with particular delays in renewable energy projects | Medium term (2-4 years) |
| Source: Mordor Intelligence | |||
Acute Skilled-Labor Shortages & Wage Inflation
Construction wages climbed 15% in 2024 as the labor pool thinned, eroding margins for small firms reliant on low-skill workers. German pay premiums lure tradespeople abroad and leave domestic contractors scrambling for electricians, welders, and crane operators. Management and engineering positions also face scarcity, adding supervisory bottlenecks to complex rail and energy works. Immigration-friendly policies offer some relief, yet productivity lags when language training is absent.
Volatile Cement & Steel Spot Prices Tied to ETS Costs
EU carbon rules will phase out free CO₂ allowances by 2034, forcing Polish cement plants to spend USD 400–500 million each on capture technologies. Transitional costs ripple downstream as producers pass through surcharges tied to emissions. Steelmakers shifting toward hydrogen-based direct-reduced iron face similar capital spikes, disrupting delivery rhythms for rebar and sheet. The Carbon Border Adjustment Mechanism may cushion local mills but raises input costs for builders, prompting shorter procurement windows and higher risk premiums.
*Our forecasts treat driver/restraint impacts as directional, not additive. The impact forecasts reflect baseline growth, mix effects, and variable interactions.
Segment Analysis
By Sector: Infrastructure Dominance Amid Residential Acceleration
Infrastructure controlled 40.12% of Poland construction market share in 2025, while residential projects are charted for a 6.76% CAGR up to 2031. The government channels EU grants toward rail tunnels and expressways that require specialized design-build expertise, supporting higher profit margins than commoditized office blocks. Meanwhile, housing shortages elevate apartment starts in Warsaw, Poznań, and secondary cities, a trend amplified by the “Mieszkanie na start” subsidy for first-time buyers. Industrial and logistics build also thrive on near-shoring demand, filling warehouse backlogs along S8 and A2 corridors.
A divergence in risk profiles is evident: infrastructure consortia face lengthy designs and public tender scrutiny, but revenue visibility is firm once notice-to-proceed is issued. Residential players move faster yet shoulder greater sales-cycle exposure. Contractors diversifying across both segments hedge against cyclical swings, leveraging state road income to weather private-sector slowdowns.


By Construction Type: Renovation Gains Momentum
New builds held 68.12% of the Poland construction market in 2025, yet renovation is compounding at 5.73% annually, reflecting EU zero-emission mandates. More than 70% of existing office stock misses 2030 energy thresholds, and owners rush to install heat pumps, solar rooftops, and BMS retrofits. Incentives totaling USD 925 million under the Clean Air program sweeten payback periods on home insulation, while landlords chase higher rents by upgrading Class B assets to green status.
Despite its smaller base, renovation offers faster permitting and fewer land-bank capital locks than greenfield sites. New projects now include ESG engineering from day one—smart metering, PV integration, or low-carbon materials—raising design complexity and cost baselines. Firms with both demolition-retrofit teams and new-build divisions capture end-to-end workflows, growing wallet share per client.
By Construction Method: Prefab Revolution Accelerates
Conventional on-site works held 64.90% in 2025; nonetheless, modular builds are rising at an 11.62% CAGR. Poland construction market players are increasingly shifting classroom, dormitory, and healthcare expansions to factory floors, trimming build times during harsh Baltic winters. State Development Fund grants cover interest subsidies for municipal buyers of volumetric units, catalyzing pilot projects in Pomerania and Podlaskie.
Quality gains are measurable—tight tolerances and reduced waste—yet financing norms remain a hurdle because banks still apply stage-payment models tailored to site progress. Regulators now allow modular units in public tenders, a turning point that could propel prefab toward a double-digit share by 2031.
By Investment Source: Private Sector Outpaces Public Growth
Public funding supplied 52.10% of industry volume in 2025, but private investment is forecast to accelerate at a 7.01% CAGR. Developers seized on strong rental yields to launch build-to-rent towers in Warsaw and Gdańsk, while multinationals poured USD 13.85 billion of FDI into new factories that require turnkey warehouses and utilities.
Public agencies continue to anchor mega-projects—high-speed rail, offshore wind grid nodes, and military bases—yet face municipal budget caps until EU disbursements flow uninterrupted. Private capital, by contrast, can green-light projects within weeks, awarding design-build-finance contracts without multi-tier political approval. Hybrid structures such as the USD 62.5 billion “Kaszubia” program reveal how blended finance accelerates project pipelines.
Geography Analysis
Warsaw generated 25.40% of Poland construction market size in 2025, buoyed by flagship infrastructure like the USD 7 billion Centralny Port Komunikacyjny hub. The capital’s land scarcity inflates pricing to USD 5,500 per square meter, motivating vertical builds and brownfield redevelopments. Żerań district alone will add 12,000 apartments over 25 years, and office deliveries are throttled to maintain sub-10% vacancy, keeping fit-out contractors on steady retainer.
Kraków anchors the second-largest regional pipeline. UNESCO heritage status moderates skyline height but supports premium residential pricing. The 551-unit Bagry Park and the USD 43 million Cogiteon science center illustrate cultural and housing drivers converging on the city’s tech labor magnetism. Developers position near tram extensions that cut commutes to the Special Economic Zone, where multinationals like Cisco expand R&D centers.
Rest-of-Poland metros Gdańsk, Poznań, Wrocław are pacing at 6.24% CAGR. Gdańsk basks in offshore wind spillovers as port upgrades proceed; Poznań leverages brownfield sites such as Portowo to add 3,000 homes; Wrocław benefits from future high-speed rail that will halve travel times to Warsaw. Lower land costs and more agile permitting lure first-time buyers and logistics investors, prompting build-to-suit warehouse deals along the A4 corridor.
Regulatory Landscape
Poland’s construction activity is governed primarily by the Construction Law framework, with its consolidated text published in the Journal of Laws on April 16, 2026 (item 524). Recent amendments introduced a "yellow card" mechanism for minor deviations, which indicates a more graduated compliance approach than immediate escalation, reducing the likelihood of disruption on complex design-and-build programs.
Separately, a ministerial regulation published on April 27, 2026 (Journal of Laws 2026 item 597) updated the scope and form of building project documentation. This change affects how investors and designers package submissions for permits and tendering. Industry attention also centers on the regulation on technical conditions for buildings scheduled to expire on September 19, 2026, where consultations between the market and the ministry have focused on avoiding a legal gap that could slow permitting and tender readiness if transitional provisions are unclear.
Value Chain Analysis
Poland’s construction value chain is anchored by public and private investors that convert multi-year programs into tenders and frameworks. Developers, general contractors, and specialist subcontractors then deliver civil, structural, MEP, and fit-out scopes.
The contractor layer remains fragmented. Budimex, Strabag Polska, and PORR Polska are among the largest revenue generators, while a long tail of local firms serves smaller municipal works and renovation packages. Upstream suppliers of cement, steel, aggregates, and building systems shape project cost baselines, with EU ETS-driven decarbonization requirements influencing procurement decisions for materials and industrialized construction inputs. Engineering and design capability is increasingly tied to documentation and permitting execution for rail, roads, and energy assets. Institutional programs such as PARP’s Brand Hub (FENG 2021-2027) also support internationalization of Polish construction and finishing services, reinforcing a services-export channel beyond domestic demand cycles.
Competitive Landscape
The Poland construction market is highly fragmented; the top-40 firms combined for USD 19.25 billion in 2023 revenue, yet no player surpassed a 5% stake. Budimex led with a 3.9% share on USD 2.45 billion turnover, followed by Strabag and PORR. Fragmentation grants niche specialists room to shine: Transkol’s rail-signal skills earned acquisition by Mirbud for USD 19.4 million, providing a springboard into PKP PLK’s USD 20 billion rail upgrade budget.
Technology uptake differentiates contenders. Strabag’s BIM 5D deployment on the USD 27 million Bielański Hospital raised clash-detection accuracy and trimmed schedule float, showcasing digital maturity that public buyers now reward. International diversification is accelerating; Budimex counts USD 4.5 billion in international contracts to offset a domestic plateau projected within 10 years. Renewable infrastructure, carbon-capture cement retrofits, and military facilities emerge as white-space niches where technical prequalification restricts bidder pools, supporting healthier margins.
Smaller contractors seek private-equity backing to scale. Enterprise Investors’ 80% stake in Expobud Domy marks a trend toward consolidation, offering working-capital depth required for modular housing pipelines. Yet the Poland construction industry still features long tail micro-firms that serve local renovation demand, perpetuating fragmentation at the low end.
Poland Construction Industry Leaders
BUDIMEX SA
Skanska SA
Strabag Sp. z o.o.
PORR SA
Warbud SA
- *Disclaimer: Major Players sorted in no particular order


Market Opportunities and Future Outlook
Funded pipelines create near-term whitespace for contractors that can execute rail, road, and energy works at scale while absorbing documentation changes introduced in 2026. The National Recovery and Resilience Plan structure (57 investments and 54 reforms, with 44.96% allocated to climate objectives) supports sustained tendering across grid reinforcement, thermal modernization, and broader climate-aligned infrastructure, consistent with the report’s shift toward renewables and ESG-linked retrofits.
Opportunities also cluster where program design translates into bankable procurement and capacity build-out. The government opened consultations on May 19, 2026 for the Program for the Development of Investments in the Polish Economy until 2035, adding a visible channel for long-horizon project pipelines to be codified into implementable programs. On execution, the reported year-end 2025 order book of the largest contractors (105 billion PLN) indicates active workload allocation and supports adjacent opportunities in subcontracting, materials logistics, and modern methods of construction, where labor constraints and documentation requirements favor repeatable, factory-driven delivery.
Recent Industry Developments
- June 2026: Strabag signed a contract with PKP Polskie Linie Kolejowe SA for the upgrade of Section 2 of Railway Line No. 201 between Maksymilianowo and Wierzchucin, valued at approximately EUR 255 million. The award strengthens Strabag's rail upgrade credentials in Poland and adds to the 2026-2027 backlog.
- June 2026: Skanska invested PLN 143 million in the third phase NU3 of the NU residential development in Warsaw's Wola district, comprising 156 apartments, with construction starting in May 2026. The investment expands Skanska's Warsaw residential presence and signals continued asset-light residential exposure in a top market.
- June 2026: Budimex selected by PKP Polskie Linie Kolejowe SA for the modernization of the railway line No. 16 section between Łęczyca and Kutno, with an offer value of PLN 302,464,588 net. The contract bolsters Budimex’s domestic rail execution and revenue visibility in 2026-2027.


Research Methodology Framework and Report Scope
Market Definition and Coverage
For this study, the market covers the value of construction activity carried out in Poland, captured as revenues tied to delivering building and civil engineering works, including new builds and renovation work across major end uses.
Scope exclusions: This sizing does not count the value of land transactions or pure real estate sales that happen without construction activity being delivered.
Segmentation Overview
- By Sector
- Residential
- Apartments/Condominiums
- Villas/Landed Houses
- Commercial
- Office
- Retail
- Industrial and Logistics
- Others
- Infrastructure
- Transportation Infrastructure (Roadways, Railways, Airways, others)
- Energy & Utilities
- Others
- Residential
- By Construction Type
- New Construction
- Renovation
- By Construction Method
- Conventional On-Site
- Modern Methods of Construction (Prefabricated, Modular, etc)
- By Investment Source
- Public
- Private
- By Geography
- Warsaw
- Kraków
- Rest of Poland (Pomorskie (Gdańsk), Wielkopolskie (Poznań), Dolnośląskie (Wrocław))
Data Sources, Market Sizing, and Validation
Desk Research
Desk research started with official series that show how fast construction is moving in Poland and what the work mix looks like over time. We used Statistics Poland for construction and assembly production releases and annual construction publications, Eurostat for the production in construction index plus price related metadata, and public procurement and tender portals to map demand signals and the timing of project awards.
To translate activity into a consistent value view, we also relied on public project pipelines and sector notes from sources such as national infrastructure programs, publications from energy and transport agencies, and central bank or finance ministry macro indicators that can influence investment and cost inflation. Contractor backlogs and order intake were cross checked using company filings, investor presentations, and reputable press. Where public sources were not granular enough, selected paid subscriptions were used mainly for company financials, patent data where relevant, and shipment level trade data for key materials. The sources listed here are illustrative, and many other public documents and datasets were also referenced for collection, validation, and clarification.
Primary Interviews and Surveys
In Poland, we use expert interviews and surveys with construction company leaders, project managers, procurement specialists, developers, contractors, and public infrastructure stakeholders. Their feedback helps clarify demand timing, pricing movement, renovation activity, tender pipelines, and gaps in reported small-firm output before secondary inputs are accepted and the final analysis is triangulated.
Distribution of primary research fieldwork respondents
| Company type | Respondent position |
|---|---|
| Top tier: 27% | CXOs: 16% |
| Mid tier: 48% | Functional/Unit leaders: 35% |
| Smaller Players: 25% | Managers: 49% |
Market-Sizing & Forecasting
Sizing was built from a top down view that reconstructs total construction value using Poland specific construction output indicators, investment patterns, and sector splits, and then allocates those totals into the major activity buckets used in the report. To keep the totals practical, we tracked variables such as the public versus private project mix, residential permitting and completions trends, infrastructure award timing, construction input cost inflation, and renovation intensity as key fingerprints that explain year to year movement.
After shaping the high level totals, selective bottom up checks were used to keep the results grounded, including sampled contractor revenue roll ups, channel checks on typical project budgets, and volume times price approximations for a few large work types where public signals were more consistent. Where company disclosures or project level clues were incomplete, gaps were handled through conservative extrapolation from comparable work categories, and then revisited using interview feedback.
For forecasting, scenario analysis was used because construction cycles in Poland can shift with funding releases, permitting cadence, and cost inflation, and those drivers do not always move in parallel. The base case path was tied to expected infrastructure spending flow, housing pipeline normalization, and a moderated price progression, then checked for reasonableness against what primary respondents reported for bid activity and backlog conversion.
Data Validation & Update Cycle
Validation was done through multiple passes, where model outputs were compared against independent signals such as construction production indices, major project awards, and reported backlog trends, and then outliers were investigated before the final numbers were set. When a mismatch appeared, we rechecked inputs like the timing of price inflation, sector allocation shares, and whether renovation activity was being double counted.
Before sign off, another analyst reviews key assumptions and recalculates selected blocks to confirm the math and the logic still hold. The report is refreshed annually, and interim updates are triggered when there are material events such as funding shifts, major regulatory changes, or sudden cost movements that can change execution volumes. Right before delivery, a final review pass is completed so clients receive the latest adjusted view.
Mordor Intelligence's Poland Construction Market Size Compared With Other Published Estimates
Published market sizes for Poland construction can vary widely because different studies count different value pools, apply different price timing, and do not always treat renovation work in the same way. Differences can also appear when some sources combine construction output with adjacent real estate and land values, which can inflate the number depending on the year.
Land purchase value sits outside Mordor Intelligence's scope, which is one practical reason its 2025 market figure can diverge from estimates that blend construction activity with property transaction value. In addition, the spread often comes from how public infrastructure is handled (committed budgets versus executed work), whether taxes are included, and how currency conversion is timed when local cost inflation is moving quickly.
Benchmark comparison
| Source | Market Size | Gaps in Research Methodology |
|---|---|---|
| Mordor Intelligence | USD 93.99 B (2025) | |
| Trade Publisher A | USD 22.60 B (2025) | Uses a narrower value pool that appears closer to a subset of construction spend, and the definition likely excludes parts of civil engineering and renovation, which compresses the total versus a full construction activity view. |
| Industry Data Note B | USD 55.00 B (2024) | Often stated as an approximate snapshot for a prior year, and it may be anchored to selected output series without fully normalizing for segment coverage, price timing, and executed work versus announced investment. |
The table shows that the biggest differences are usually not about arithmetic, they are about what gets counted and when it is valued. By tying the total to clear activity indicators and then cross checking with interview led reality checks, the market size stays traceable to repeatable steps that a buyer can follow.


Key Questions Answered in the Report
How large is the Poland construction market in 2026?
The Poland construction market size reached USD 99.28 billion in 2026 and is projected to rise to USD 130.62 billion by 2031.
Which segment is growing fastest in Polish construction?
Residential construction leads growth with a 6.76% CAGR through 2031, driven by housing shortages and subsidy programs.
Why is prefabricated building gaining traction?
Prefab methods cut project timelines in half and receive State Development Fund support, resulting in an 11.62% CAGR to 2031.
What geographic area offers the highest growth outlook?
Regions outside Warsaw, notably Gdańsk, Poznań, and Wrocław, are expected to expand at a 6.24% CAGR on logistics and industrial investments.
How competitive is the contractor landscape?
Highly fragmented, no firm controls more than 5% revenue, and the top 40 captured USD 19.25 billion combined in 2023.
Page last updated on:


 Your data is secure and never sold or shared.


