
Point-of-Care Data Management Software Market Size and Share
Market Overview
| Study Period | 2020 - 2031 |
|---|---|
| Market Size (2026) | USD 1.27 Billion |
| Market Size (2031) | USD 2.43 Billion |
| Growth Rate (2026 - 2031) | 13.79% CAGR |
| Fastest Growing Market | Asia Pacific |
| Largest Market | North America |
| Market Concentration | Medium |
Major Players *Disclaimer: Major Players sorted in no particular order Image © Mordor Intelligence. Reuse requires attribution under CC BY 4.0. | |
Point-of-Care Data Management Software Market Analysis by Mordor Intelligence
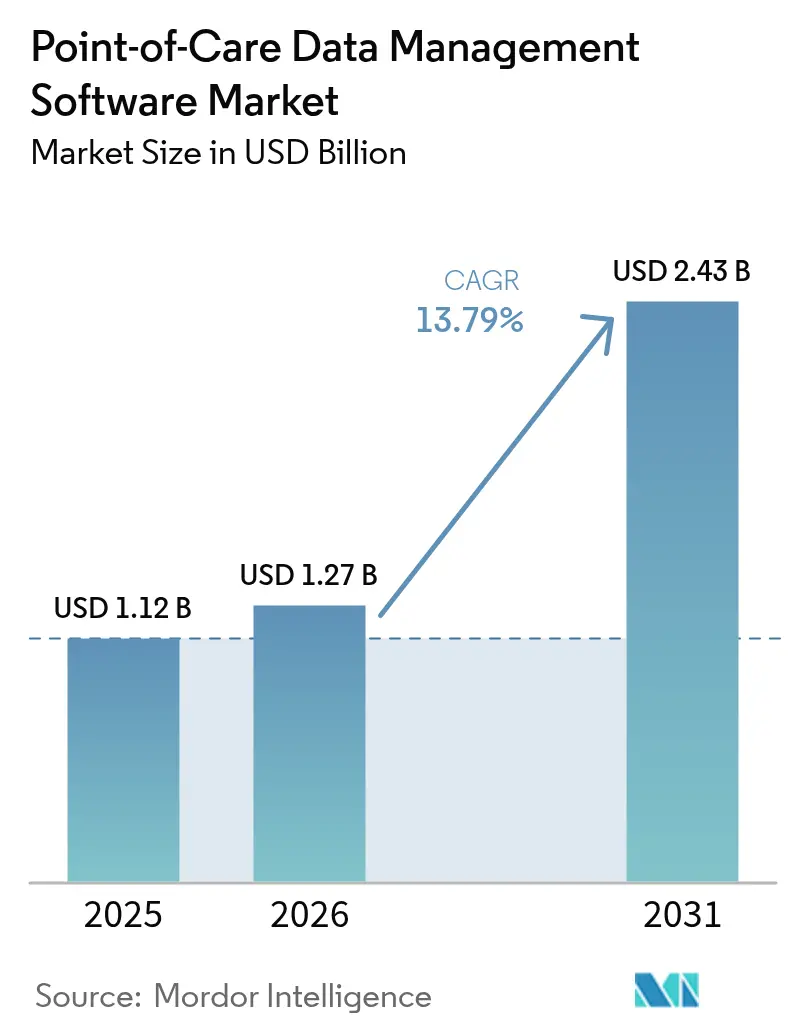
The point-of-care data management software market size is expected to grow from USD 1.12 billion in 2025 to USD 1.27 billion in 2026 and is forecast to reach USD 2.43 billion by 2031 at 13.79% CAGR over 2026-2031. This brisk expansion springs from health systems’ pivot toward real-time diagnostics, wider government funding for flexible connectivity, and a rising preference for outcome-based reimbursement. Cloud migration, AI-driven analytics, and middleware that links hundreds of device types are now central buying criteria. Vendors able to bundle software, services, and cybersecurity safeguards stand to capture share as hospitals standardize data workflows and home-care programs scale. Consolidation among large incumbents coexists with niche innovators, creating a moderate-concentration landscape poised for steady deal activity.[1]National Institutes of Health, “Point-of-Care Technologies Research Network,” nih.gov
Key Report Takeaways
- By deployment mode, on-premises solutions held 51.62% of the point-of-care data management software market share in 2025, whereas cloud platforms are projected to post the fastest 15.88% CAGR through 2031.
- By end user, hospitals and critical-care units led with 46.15% revenue share in 2025, while home healthcare is tracking the highest 14.71% CAGR to 2031.
- By application, glucose monitoring accounted for 31.17% of the point-of-care data management software market size in 2025; infectious-disease testing devices are accelerating at a 15.46% CAGR over the same horizon.
- By component, middleware captured 39.61% share in 2025, yet services are projected to expand at a 16.07% CAGR as buyers seek turnkey support.
- By geography, North America remained dominant with 38.21% share in 2025, but Asia Pacific is forecast to grow the quickest at 16.52% CAGR through 2031.
Note: Market size and forecast figures in this report are generated using Mordor Intelligence’s proprietary estimation framework, updated with the latest available data and insights as of 2026.
Global Point-of-Care Data Management Software Market Trends and Insights
Drivers Impact Analysis*
| Driver | (~) % Impact on CAGR Forecast | Geographic Relevance | Impact Timeline |
|---|---|---|---|
| Innovation in Flexible Connectivity and Interface Solutions | +2.30% | Global, with early adoption in North America and Europe | Medium term (2-4 years) |
| Expansion of Healthcare Infrastructure Budgets | +2.10% | Asia Pacific core, spillover to Middle East and Africa | Long term (≥ 4 years) |
| Government Funding Initiatives for POC Testing | +1.80% | North America and Europe, emerging in Asia Pacific | Short term (≤ 2 years) |
| Payor Shift Toward Outcome-Based Reimbursement | +1.60% | North America and Europe primary, limited Asia Pacific | Medium term (2-4 years) |
| AI-Driven Analytics Modules for Antimicrobial Stewardship | +1.40% | Global, with regulatory leadership in North America | Medium term (2-4 years) |
| Growing Cybersecurity Compliance Requirements | +1.20% | Global, with stringent requirements in North America and Europe | Short term (≤ 2 years) |
| Source: Mordor Intelligence | |||
Innovation in Flexible Connectivity and Interface Solutions
Health systems are demanding interoperable middleware that links more than 200 distinct point-of-care devices through standardized FHIR R4 APIs, a capability spurred by CMS’s Interoperability and Patient Access Rule.[2]Centers for Medicare and Medicaid Services, “Interoperability and Patient Access Final Rule,” cms.gov Vendors now treat connectivity as core infrastructure, not add-on code, to avoid data silos and accelerate clinical decision-making. The arrival of 5G and edge-computing nodes cuts latency for cloud-native deployments, letting multi-site operators harmonize workflows across dispersed facilities. FDA’s Digital Health Software Precertification Program further elevates connectivity by embedding it in regulatory review, creating an incentive for continuous performance monitoring. As a result, buyers prioritize middleware depth and future-proof interface roadmaps when awarding contracts.
Expansion of Healthcare Infrastructure Budgets
Governments spent USD 200 billion on health-infrastructure projects in 2024, earmarking sizable funds for digital platforms that include point-of-care data management software.[4]World Health Organization, “Global Health Observatory Data Repository,” who.int Programs like India’s National Digital Health Mission and China’s Healthy China 2030 channel budget toward IT modernization, opening doors for vendors able to meet country-specific data-localization rules. Private-public partnerships often bundle software clauses into construction tenders, effectively converting optional tech into mandatory kit. As new hospitals and diagnostic centers go live, they specify analytics suites that feed value-based care dashboards, ensuring software procurement aligns with bricks-and-mortar schedules. This spends surge enlarges the addressable base in mid-income economies and smooths revenue visibility for suppliers through long-term maintenance deals.
Government Funding Initiatives for POC Testing
Federal bodies such as NIH and BARDA injected USD 3.2 billion into rapid-diagnostics programs, each grant mandating data-management compatibility from day one. The RADx portfolio alone backed 19 platforms in 2024, all of which require real-time data capture for regulatory dossiers and clinical-workflow integration. Funding calls explicitly reward AI-enhanced analytics that shorten diagnostic turnarounds, steering software roadmaps toward predictive insights. International donors, including the Global Fund, now embed digital-health criteria in grants, so vendors aligned to grant templates gain early-mover status in lower-income markets. Streamlined review pathways for government-funded prototypes also lower time-to-market, padding CAGR gains in the forecast window.
Restraints Impact Analysis*
| Restraint | (~) % Impact on CAGR Forecast | Geographic Relevance | Impact Timeline |
|---|---|---|---|
| High Deployment and Integration Costs | -2.80% | Global, with acute impact in emerging markets | Short term (≤ 2 years) |
| Data Privacy and Cybersecurity Threats | -1.90% | Global, with regulatory complexity in Europe and North America | Medium term (2-4 years) |
| Fragmented Legacy Device Firmware Ecosystem | -1.50% | Global, with concentration in established healthcare markets | Medium term (2-4 years) |
| Shortage of Skilled IT Staff in Rural Facilities | -1.30% | North America and Europe rural areas, emerging in Asia Pacific | Long term (≥ 4 years) |
| Source: Mordor Intelligence | |||
High Deployment and Integration Costs
Comprehensive rollouts cost USD 500,000-USD 2 million per facility, a hurdle that stalls adoption in smaller or rural hospitals where 40% of IT posts sit vacant. Legacy-system heterogeneity inflates interface coding and workflow redesign, often stretching timelines past budget cycles. Total cost of ownership widens when annual maintenance, staff training, and upgrade subscriptions enter the calculus. For facilities with thin patient volumes, payback models remain weak, nudging them toward grant funding or SaaS options with phased billing. Vendors able to package modular, cloud-hosted offerings at lower entry prices can unlock pent-up demand and counter this drag on CAGR.
Data Privacy and Cybersecurity Threats
Healthcare cyberattacks rose 93% in 2024, costing an average USD 4.88 million per breach, a figure that includes HIPAA fines and legal restitution. Point-of-care systems multiply network touchpoints, creating a wider attack surface that often outstrips in-house monitoring capacity. Compliance frameworks such as ISO 27001 and updated HIPAA Security rules compel continuous vulnerability scanning, encryption, and audit logging, adding recurring expense and lengthening procurement cycles. Providers risk reputational damage and payer penalties when breaches compromise outcome-based contracts, so they vet vendors for mature security postures and incident-response playbooks, factors that can elongate buying decisions.
*Our forecasts treat driver/restraint impacts as directional, not additive. The impact forecasts reflect baseline growth, mix effects, and variable interactions.
Segment Analysis
By Deployment Mode: Cloud Migration Gains Ground Amid Legacy Strongholds
On-premises deployments still commanded 51.62% revenue in 2025, showing the historical sway of in-house servers for direct data custody. Yet cloud solutions are sprinting at a 15.88% CAGR, fuelled by robust disaster-recovery, auto-patching, and elastic storage benefits. A hybrid approach acts as a transition bridge: many systems keep latency-sensitive modules on-site while pushing analytics to HIPAA-compliant clouds. Multi-site chains prize cloud-centric dashboards that synchronize performance metrics across campuses, trimming duplicated infrastructure. FDA’s recent guidance equating validated cloud configurations with local installations further eases CIO concerns, nudging purchase orders toward SaaS models. Savings from hardware refresh deferral often finance cybersecurity upgrades, accelerating the migration curve.
Cloud vendors tout FedRAMP and HITRUST credentials to win federal and academic accounts, denting the head-start enjoyed by legacy on-premises incumbents. Rising ransomware threats also make off-site backups imperative, a default feature in many cloud contracts. Conversely, research institutes handling genomic data still lean on local clusters to maximize compute throughput. Even here, containerized workloads permit burst capacity in the cloud during peak demand, showcasing a future where line-blurring hybrid architectures dominate. Over time, service-based pricing shifts vendor focus from perpetual licenses to retention-driven roadmaps rich in AI modules and API marketplaces that monetize ecosystem participation.


By End User: Home Healthcare Rapidly Reshapes Demand Patterns
Hospitals and critical-care units retained the lion’s 46.15% share in 2025, supported by emergency-department throughput targets and lab turnaround mandates. Nevertheless, home-health programs are clocking a 14.71% CAGR, buoyed by Medicare’s Hospital-at-Home expansion and aging-population dynamics. Portable analyzers and telehealth kits feed a need for lightweight, browser-based dashboards that caregiver’s access from patient residences. Diagnostic centers integrate auto-verification rules to handle ballooning specimen loads while clinics lean on point-of-care data to shorten visit cycles under capitated payment plans.
Home-care operators grapple with variable broadband quality, propelling interest in store-and-forward architecture that syncs when connectivity resumes. Hospitals continue to invest in enterprise-wide middleware that flags quality-control drifts and consolidates reagent inventory data, improving supply chain efficiency. Outpatient clinics adopt shared-service models, licensing centralized analytics but maintaining autonomy over local device pools. The growing “other” category spanning long-term care and occupational-health sites creates opportunities for modular UI skins tailored to non-hospital workflows, widening addressable revenue.
By Application: Infectious Disease Testing Surges on Stewardship Mandates
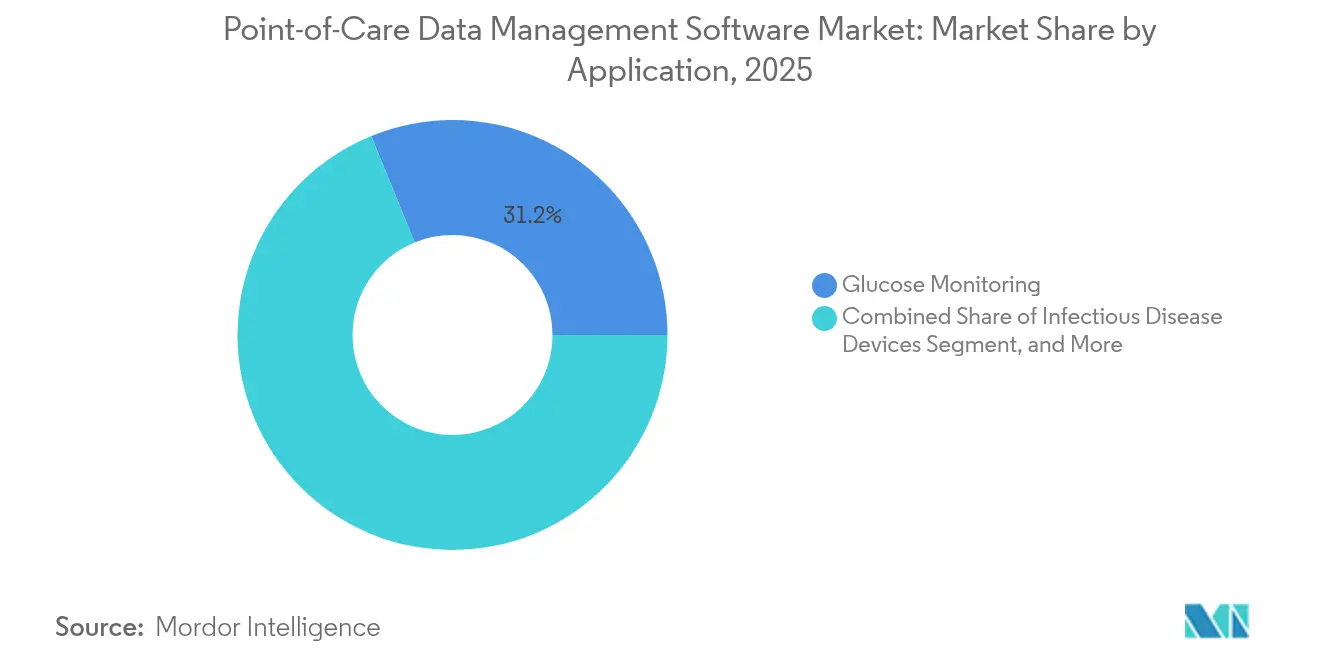
Glucose monitoring held 31.17% share in 2025, propelled by continuous-glucose sensors and population-health programs targeting diabetes. Infectious-disease devices, however, are scaling fastest at 15.46% CAGR as antimicrobial-resistance stewardship moves from policy to practice. Labs now rely on software that auto-pushes susceptibility data into hospital formularies, enabling real-time prescribing alerts. Coagulation monitoring occupies a stable niche in cardiac and anticoagulation clinics, while urinalysis remains a high-volume staple for routine screening.
Cardiometabolic panels gain from corporate-wellness contracts that reimburse on biomarker targets, requiring near-instant scorecards. Cancer markers, though smaller, ride precision-medicine funding that mandates longitudinal data capture tied to treatment regimens. Emerging respiratory and molecular assays nest in the “other” bucket, each bringing unique QC flags and regulatory filing prerequisites. Vendors able to pre-configure application-specific report templates cut adoption friction and differentiate in RFP scoring.
By Component: Services Uptick Signals Market Maturation
Middleware led with a 39.61% slice in 2025, underscoring its role as the synaptic layer binding disparate analyzers to EHRs. Yet the services line item is pacing a 16.07% CAGR, mirroring buyers’ desire for hands-on workflow mapping, training, and 24-7 support. Software platforms now compete on AI-embedded decision support, natural-language result explanations, and mobile-first UI.
Hospitals outsourcing integration gain predictable budgets but expect continual KPI optimization, pushing vendors toward managed-service agreements. Consulting add-ons include cybersecurity audits and ISO 13485 documentation assistance, illustrating rising compliance complexity. Middleware itself grows more contextual, triggering alerts when QC coefficients deviate or reagent lots near expiry, thereby shifting value upstream from simple connectivity to actionable intelligence. Subscription bundles that pair software and services hence secure stickier revenue and deepen client lock-in.
Geography Analysis
North America maintained a 38.21% share in 2025, anchored by NIH grants, BARDA’s DRIVe program, and mature EHR penetration. U.S. hospitals deploy analytics to satisfy Medicare Advantage quality metrics, whereas Canada’s provincial systems fund rural-access upgrades that hinge on middleware interoperability. Venture capital flows and predictable FDA pathways make the region a test bed for AI-rich modules, giving suppliers early feedback loops.
Asia Pacific is set to compound at 16.52% CAGR, the fastest worldwide. China’s USD 15 billion health-digitization budget funnels into county-level hospitals eager for cloud-hosted dashboards. India’s Ayushman Bharat Digital Mission enforces interoperability, nudging buyers toward standards-compliant software. Japan leverages Society 5.0 to back aging-care pilots that marry home-monitoring kits with centralized analytics. Singapore acts as the regional deployment hub, exporting expertise across Southeast Asia. The mosaic of regulations rewards platforms sporting flexible data-sovereignty toggles and multilingual interfaces.
Europe exhibits steady, regulation-driven uptake. Germany’s Digital Healthcare Act finances hospital IT overhauls, while the United Kingdom’s NHS Digital campaign pushes all acute trusts onto a shared interoperability standard. France and Spain tap EU Recovery funds for telemedicine and lab IT modernization. Strict GDPR rules require baked-in consent management and encryption, extending deployment cycles but enhancing trust. Suppliers that pre-validate compliance templates gain bidding advantages. South America, the Middle East, and Africa trail in share but post mid-teens growth as public-private buildouts stipulates digital kits from the outset.


Regulatory Landscape
Point-of-care data management software sits at the intersection of medical device software, clinical decision support (CDS), and health IT interoperability rules. In the United States, the FDA issued revised final guidance on Clinical Decision Support Software in January 2026 (followed by a public town hall in March 2026) clarifying how certain CDS functions can fall outside the medical device definition under the 21st Century Cures Act. This increases the importance of precise intended-use and functionality mapping for analytics modules embedded in POC data platforms.
Quality and software engineering controls continue to shape procurement and vendor qualification. The FDA Quality Management System Regulation (QMSR) at 21 CFR Part 820 became effective in February 2026, harmonizing quality system expectations with ISO 13485:2016 and reinforcing documentation discipline for vendors delivering regulated modules. Globally, IEC 62304 and ISO 14971 anchor software lifecycle and risk management for development and change control. In Europe, EU IVDR (Regulation 2017/746) applies case-by-case assessment, with software that interprets or calculates clinical parameters for diagnostic decisions potentially regulated as an IVD, while software limited to storage, display, or transmission may fall outside IVD classification.
Competitive Landscape
The point-of-care data management software market shows moderate concentration: top multinationals carry sizable reach, yet local specialists still thrive. Siemens Healthineers, Abbott, and Danaher engineer end-to-end ecosystems, often buying niche firms to plug feature gaps, as seen in Siemens’ USD 16.4 billion Varian deal. Their scale yields bundled pricing across devices, middleware, and support.
Emerging challengers harness cloud-native microservices, AI-driven antimicrobial alerts, and zero-trust security frameworks to woo greenfield deployments. They exploit incumbent technical debt, especially among legacy on-premises suites slow to adopt open APIs. Cybersecurity posture now doubles as a sales lever; platforms boasting ISO 27001 and SOC 2 Type II audits shorten procurement cycles in North America and Europe.
Outcome-based reimbursement pressures favour vendors that correlate device data with length-of-stay or readmission reductions, which can be validated in payer negotiations. Strategic alliances with EHR giants or 5G telcos also surface as differentiators, supplying embedded distribution channels. As consolidation continues, bolt-on valuations trend upward, pushing innovators either toward premium exits or specialized niches like home-care analytics.
Point-of-Care Data Management Software Industry Leaders
Siemens Healthineers AG + (Conworx)
Abbott Point of Care Inc. + (Alere)
Danaher Company (HemoCue and Radiometer Medical ApS)
Roche Diagnostics Corporation
TELCOR Inc.
- *Disclaimer: Major Players sorted in no particular order


Market Opportunities and Future Outlook
Standards-led interoperability creates near-term whitespace for vendor-neutral connectivity layers that reduce custom interface work across multi-vendor device fleets. One concrete signal is the May 2026 launch of HL7 International's Caliper FHIR Accelerator, which is organized to improve how medical and personal health device data is exchanged and used. This reinforces FHIR-aligned integration as a buying criterion alongside legacy connectivity, pushing demand toward reusable device connectors, FHIR R4 mappings, and governance tooling such as identity, audit trails, and consent-aware data handling, particularly for hospital networks running mixed point-of-care estates.
Workflow-embedded analytics and high-acuity device data capture inside EHR environments also represent a practical expansion lane, supported by named deployments and partnerships. In 2026, Medasense Biometrics enabled pain-monitoring data documentation into hospital EHRs via Philips Capsule MDIP integration (July 2026), and Bayside Health completed a FHIR-based integration of DoseMeRx with Oracle Health Foundation EHR across multiple hospitals (July 2026). These deployments reduce manual data entry and normalize device or dosing data for clinical use. In parallel, US program requirements that tie performance reporting and interoperability to certified health IT, including CMS MIPS requirements for the 2026 performance period and ONC's 2026 SVAP cycle allowing updated standard versions starting August 29, 2026, increase incentives for point-of-care data management vendors to keep pace with certified interface expectations and to package services that help providers operationalize compliance.
Recent Industry Developments
- March 2026: Abbott expanded access to its Precision Oncology portfolio through integration with Flatiron Health's cloud-based OncoEMR platform, enabling digital test ordering and result delivery within oncology workflows. The integration reinforces the shift toward embedding diagnostic data and reporting directly inside specialty clinical systems rather than relying on standalone portals. It also raises expectations for tighter interoperability between test workflows, results management, and downstream clinical decision processes.
- April 2025: Abbott announced integration of FreeStyle Libre glucose data with Epic's electronic health record, allowing clinicians to view glucose monitoring information within established care workflows. This integration supports broader adoption of point-of-care and near-patient data streams by reducing manual reconciliation and improving continuity across inpatient and outpatient settings. It also increases competitive pressure on data management platforms to maintain robust EHR connectivity and governance features for longitudinal monitoring.
- May 2024: Radiometer announced a commercial partnership with Etiometry to integrate the Etiometry clinical intelligence platform with Radiometer acute care diagnostics, consolidating blood gas results and physiologic parameters alongside analytics. The partnership highlights the market direction toward combining point-of-care diagnostic outputs with clinical intelligence layers used in high-acuity settings. It underscores demand for data management architectures that can feed near-real-time device data into advanced analytics and bedside decision-support environments.


Research Methodology Framework and Report Scope
Market Definition and Coverage
This market covers software used to capture, transmit, manage, and validate point-of-care testing (POCT) results, so they can flow into laboratory and clinical records and be used for reporting and decision support.
Scope exclusions: This sizing excludes POCT instruments and consumables, and it also excludes general hospital IT systems that are not purpose-built for POCT data connectivity and governance.
Segmentation Overview
- By Deployment Mode
- Cloud-Based
- On-Premise
- Hybrid
- By End User
- Hospitals / Critical Care Units
- Diagnostic Centers
- Clinics / Outpatient
- Home Healthcare
- Other End Users
- By Application
- Infectious Disease Devices
- Glucose Monitoring
- Coagulation Monitoring
- Urinalysis
- Cardiometabolic Monitoring
- Cancer Markers
- Hematology
- Other POC Applications
- By Component
- Software Platform
- Middleware
- Services
- By Geography
- North America
- United States
- Canada
- Mexico
- Europe
- United Kingdom
- Germany
- France
- Italy
- Rest of Europe
- Asia-Pacific
- China
- Japan
- India
- South Korea
- Rest of Asia
- Middle East
- Israel
- Saudi Arabia
- United Arab Emirates
- Turkey
- Rest of Middle East
- Africa
- South Africa
- Egypt
- Rest of Africa
- South America
- Brazil
- Argentina
- Rest of South America
- North America
Data Sources, Market Sizing, and Validation
Desk Research
Desk work was used to set clear market boundaries and build practical input ranges before speaking with experts. We referenced public healthcare and IT standards and evidence bases, including FDA public databases for device context, CMS materials for reimbursement direction, CDC documentation for infectious disease testing use cases, and HL7 materials to understand interoperability expectations.
To anchor adoption signals, we also reviewed sources such as OECD health statistics, publicly available hospital laboratory guidelines, peer-reviewed literature on POCT quality control and connectivity, and regular disclosures like annual reports and investor decks from relevant software and diagnostics groups. Paid subscriptions were used selectively for company financials and intelligence, patent lookups, and shipment-level import and export checks when they helped validate directional assumptions. These examples are not exhaustive, and additional public sources were also used for data collection, cross-checking, and clarifying definitions.
Primary Interviews and Surveys
Primary work focused on how POCT connectivity software is bought, priced, and renewed across hospitals, diagnostic networks, and outpatient settings, since contract structure can shift revenue timing. We spoke with a mix of software-focused executives, product and interoperability leaders, and operational managers (including lab and POCT coordinators) to confirm what is counted as POCT data management versus adjacent LIS, middleware, or EMR modules. For global coverage, we balanced discussions across mature and fast-adopting healthcare systems so assumptions could be tested against local workflow and regulatory realities.
Distribution of primary research fieldwork respondents
| Company type | Respondent position | Region |
|---|---|---|
| Top tier: 36% | CXOs: 12% | APAC: 41% |
| Mid tier: 47% | Functional/Unit leaders: 33% | EMEA: 32% |
| Smaller Players: 17% | Managers: 55% | Americas: 27% |
Market-Sizing & Forecasting
The sizing starts from a top-down demand pool build-up that reconstructs how many POCT sites need connectivity, and how frequently results are generated and routed into clinical records, which is then translated into expected software platform, middleware, and services spend. We then corroborated totals using selective bottom-up approximations, such as sampling typical contract sizes by site type and comparing those with a roll-up of observable vendor revenues where disclosures allow it.
Key inputs that shaped the model included the installed base of POCT analyzers by care setting, the share of sites connected to LIS and EMR workflows, the split between cloud-based and on-premise deployments, typical pricing logic (subscription versus perpetual license plus maintenance), and service intensity for implementation and integration. Where primary inputs varied by region, assumptions were normalized using currency conversion at consistent timing and then tested against local procurement patterns. Forecasts were produced using scenario analysis that links the above drivers to adoption pace, IT budget cycles, and integration requirements, then narrowed based on expert consensus on what is realistic within the forecast window. When a bottom-up trail was incomplete (for example, private revenue not disclosed), we filled gaps using conservative ranges for ASPs and attach rates, and then rechecked results against demand-side indicators.
Data Validation & Update Cycle
Validation was handled through multiple checks so results are traceable to real market signals and not only to one assumption. We compared model outputs against independent indicators such as public digitization programs, interoperability mandates, POCT utilization growth cues in published care guidance, and observed shifts in software contracting, and then reviewed any outliers before sign-off.
A second analyst review was used to stress-test currency conversions, pricing progressions, and the split between platform and services revenue, and follow-up calls were triggered when interview feedback materially diverged from the desk-based ranges. The report is refreshed on an annual cycle, with interim updates when major events change budgets, regulation, or technology adoption. Before delivery, an analyst performs a final pass so clients receive the latest updated view.
Mordor Intelligence's Point of Care Data Management Software Market Estimate Compared With Other Published Estimates
Published market values for POCT data management software can vary because the category sits next to LIS, middleware, and broader clinical IT, and each publisher draws the line differently. Differences also come from how subscription revenue is timed, how services are treated, and whether currency conversion is aligned to a consistent point in the year.
In our work, a tight refresh cycle is applied to pricing progressions and currency timing, and then totals are rechecked using contract structure and deployment mix signals. As a result, the 2026 number used here differs from figures that rely on older price points or a wider IT scope, which is the modeling choice applied by Mordor Intelligence.
Benchmark comparison
| Source | Market Size | Gaps in Research Methodology |
|---|---|---|
| Mordor Intelligence | USD 1.27 B (2026) | |
| Trade Publisher A | USD 1.00 B (2023) | Uses an earlier base year and a longer horizon, and the scope is not clearly separated from adjacent health IT modules, which can compress or expand the starting value depending on what is bundled. |
| Industry Tracker B | USD 0.78 B (2024) | Covers point-of-care data management systems using a narrower definition and a different segmentation lens, and it may undercount services and integration-heavy deployments that lift revenue in enterprise hospital rollouts. |
The spread in published values mostly traces back to boundary choices (software-only versus broader systems), plus how recurring revenue and services are recognized across years. By keeping pricing, deployment mix, and currency timing consistent and then cross-checking with demand-side adoption signals, the estimate stays transparent and repeatable for decision-making.


Key Questions Answered in the Report
How large is the point-of-care data management software market in 2026?
The market stands at USD 1.27 billion in 2026 and is on track to reach USD 2.43 billion by 2031.
What is the expected CAGR for point-of-care data platforms through 2031?
Industry revenue is projected to climb at a 13.79% compound annual growth rate through 2031.
Which deployment model is growing the fastest?
Cloud-based deployments show the quickest rise, advancing at a 15.88% CAGR as hospitals shift workloads off-premise.
Why is Asia Pacific considered the most attractive growth region?
Government digitization drives, including India's Ayushman Bharat and China's Healthy China 2030, fuel a 16.52% CAGR for the region.
Which application segment is expanding most rapidly?
Infectious-disease testing devices lead growth, rising at a 15.46% CAGR on the back of antimicrobial stewardship policies.
What are the key barriers to adoption?
High integration costs and cybersecurity compliance requirements remain the foremost hurdles for prospective buyers.
Page last updated on:






