
Pneumatic Equipment Market Size and Share
Market Overview
| Study Period | 2020 - 2031 |
|---|---|
| Market Size (2026) | USD 37.41 Billion |
| Market Size (2031) | USD 52.29 Billion |
| Growth Rate (2026 - 2031) | 6.93 % |
| Fastest Growing Market | Asia Pacific |
| Largest Market | North America |
| Market Concentration | Medium |
Major Players *Disclaimer: Major Players sorted in no particular order Image © Mordor Intelligence. Reuse requires attribution under CC BY 4.0. | |
Pneumatic Equipment Market Analysis by Mordor Intelligence
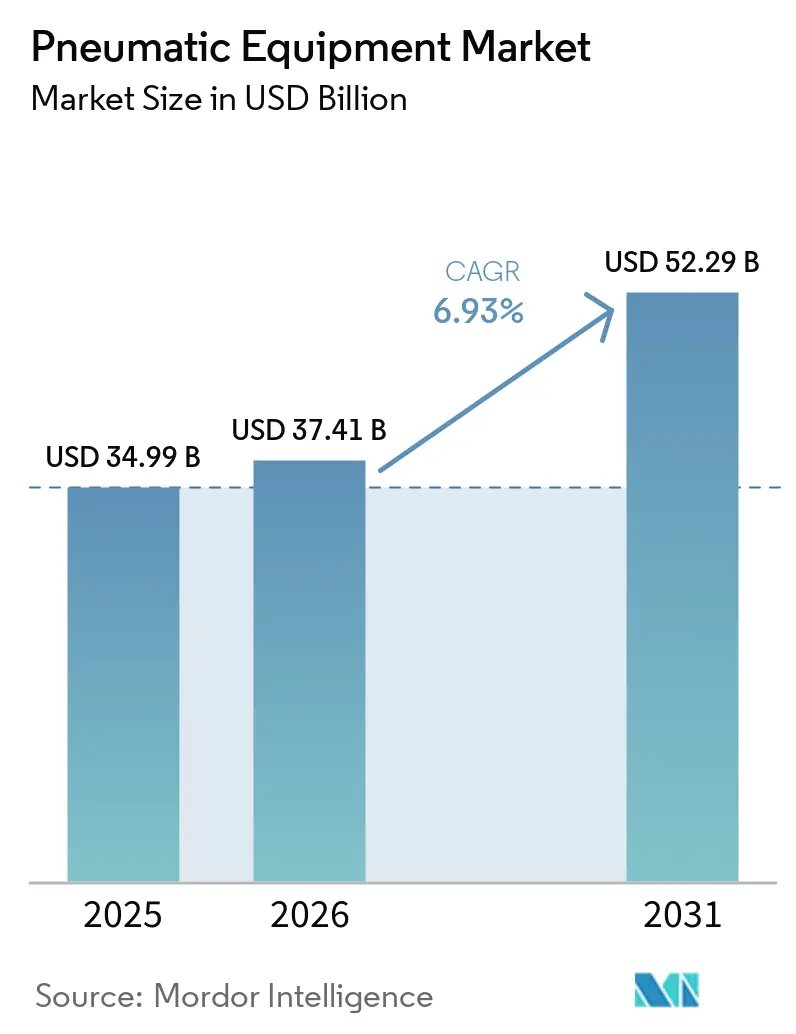
The pneumatic equipment market size in 2026 is estimated at USD 37.41 billion, growing from 2025 value of USD 34.99 billion with 2031 projections showing USD 52.29 billion, growing at 6.93% CAGR over 2026-2031. Industrial automation upgrades, energy-efficient compressed-air retrofits, and the fusion of pneumatic hardware with IIoT diagnostics are the primary growth catalysts. Demand spikes from semiconductor clean rooms, electric-vehicle battery lines, and hygienic food plants underscore the sector’s expanding application scope. Competitive intensity is rising as market leaders pair traditional pneumatics with digital monitoring to cut downtime and energy loss. At the same time, tightening efficiency rules in major economies are accelerating the shift toward hybrid electro-pneumatic solutions, giving suppliers a new avenue for differentiation.
Key Report Takeaways
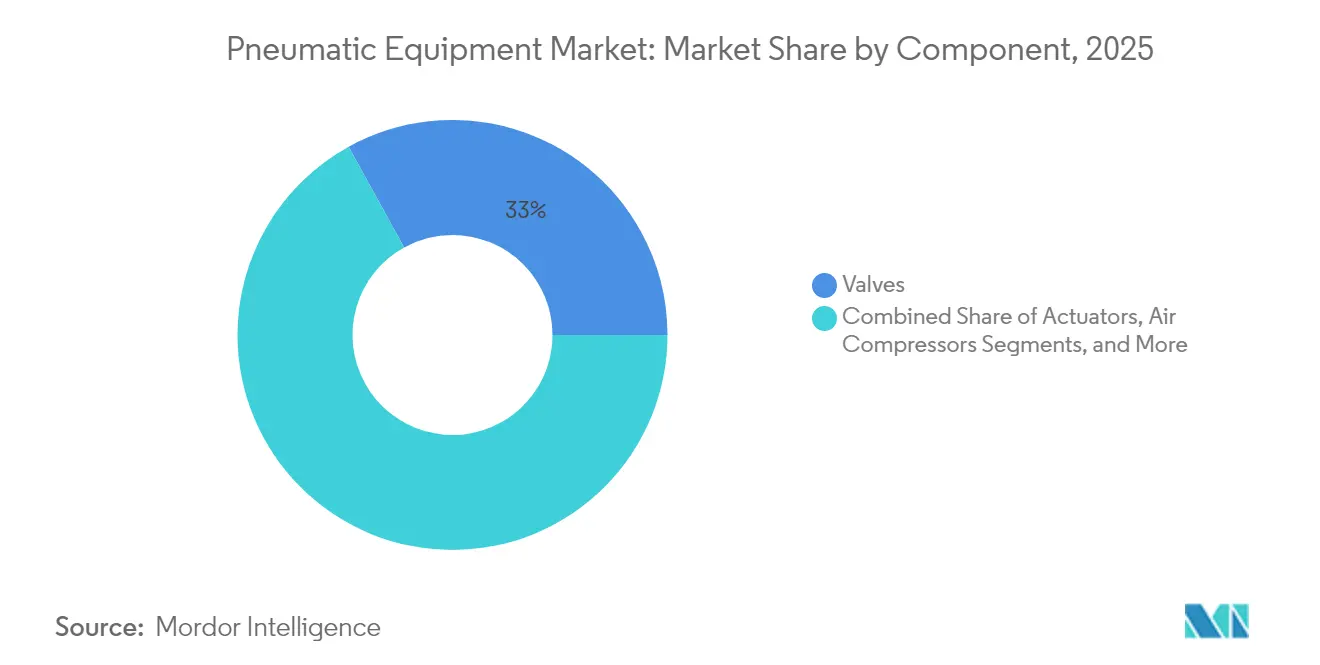
- By component, valves led with 33.02% of pneumatic equipment market share in 2025, while actuators are projected to post the fastest 7.46% CAGR through 2031.
- By function, motion control dominated with 40.02% share of the pneumatic equipment market size in 2025; material handling is set to expand at an 7.95% CAGR to 2031.
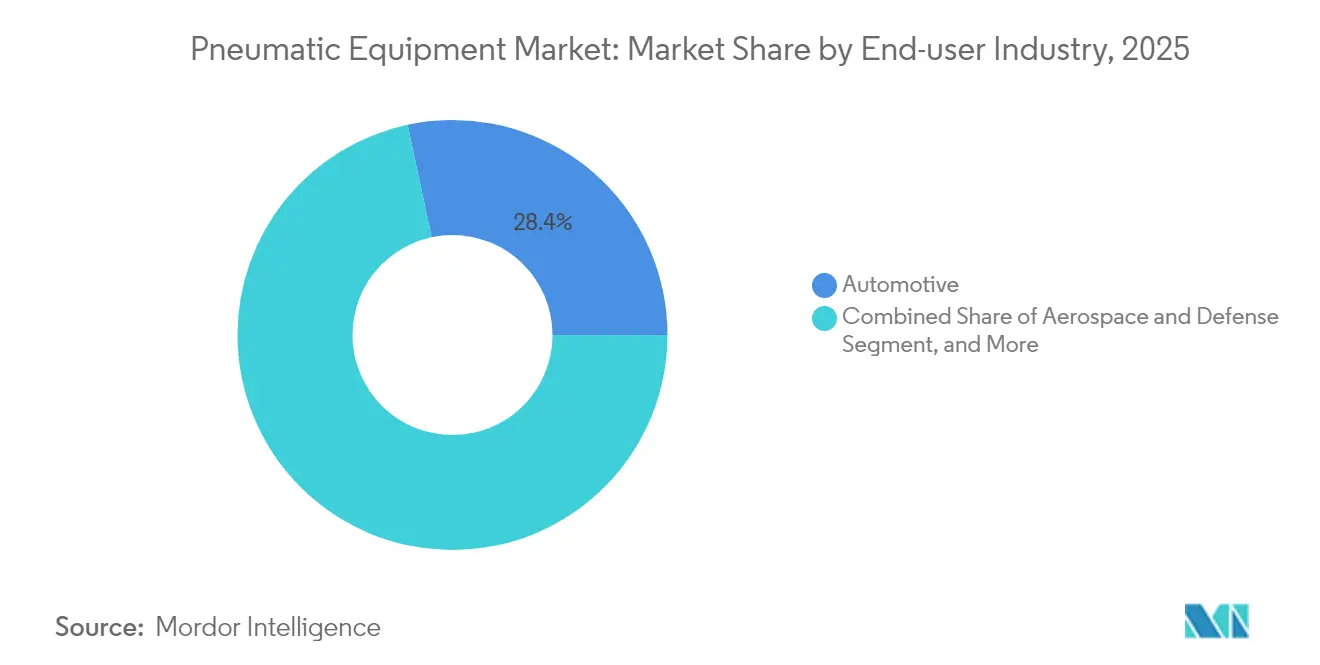
- By end-user industry, automotive held 28.35% of 2025 revenue, whereas life sciences record the highest 7.20% growth trajectory to 2031.
- By pressure range, low-pressure systems captured 45.12% of the 2025 base, yet high-pressure equipment is poised for the quickest 8.06% CAGR through 2031.
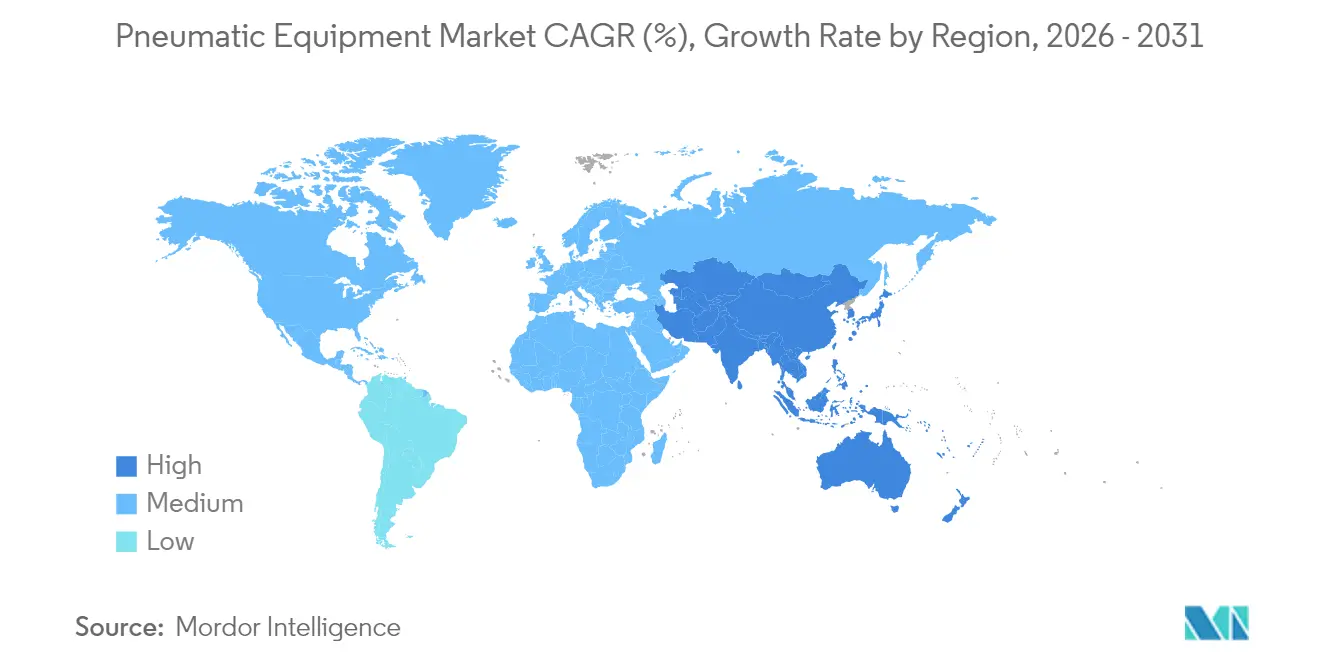
- By geography, North America accounted for 34.21% revenue in 2025, while Asia Pacific is advancing at a 7.66% CAGR and is on track to narrow the gap by 2031.
Note: Market size and forecast figures in this report are generated using Mordor Intelligence’s proprietary estimation framework, updated with the latest available data and insights as of 2026.
Market Trends and Insights
Drivers Impact Analysis of Pneumatic Equipment Market*
| Driver | (~) % Impact on CAGR Forecast | Geographic Relevance | Impact Timeline |
|---|---|---|---|
| Increasing automation across industries | +1.8% | Global, with concentration in APAC and North America | Medium term (2-4 years) |
| Demand for energy-efficient compressed-air systems | +1.2% | Europe and North America, expanding to APAC | Long term (≥ 4 years) |
| Rapid growth of hygienic F&B processing lines | +0.9% | Global, with early adoption in developed markets | Short term (≤ 2 years) |
| Expansion of EV manufacturing facilities | +1.1% | APAC core, spill-over to North America and Europe | Medium term (2-4 years) |
| Micro-fluidic assembly demand for micro-actuators | +0.6% | APAC and North America semiconductor hubs | Long term (≥ 4 years) |
| IIoT-enabled predictive maintenance retrofits | +0.8% | Global, led by North America and Europe | Medium term (2-4 years) |
| Source: Mordor Intelligence | |||
Increasing Automation Across Industries
Mass-scale factory digitalization is reshaping pneumatic design, prompting suppliers to embed sensors and wireless modules that allow predictive analytics. SMC’s EXW1 wireless node trims valve-manifold size by 86% and supports leading industrial Ethernet protocols, demonstrating how miniaturization and connectivity now converge in a single package.[1] For plant managers, real-time health data on cylinders and valves translates into fewer unplanned stops and faster root-cause analysis. Adoption momentum is especially strong in electronics, automotive, and packaged-goods plants building greenfield “lights-out” lines. Compliance audits under ISO 11011 give added weight to solutions that quantify compressed-air baselines, making digitally enabled pneumatics a compelling investment. Suppliers able to prove measurable OEE gains are winning head-to-head bids against legacy offerings.
Demand for Energy-Efficient Compressed-Air Systems
Compressed air accounts for roughly 10% of industrial electricity load, and new U.S. DOE efficiency rules effective January 2025 are forcing upgrades across the installed base. Atlas Copco’s hybrid compressor portfolio, which toggles between fixed-speed and VSD modes, can trim annual CO₂ output by 9 tons per unit while keeping pressure stability within ±0.1 bar.[2] In Europe, ASHRAE 90.1-2022 inclusion of compressed air raises the bar for building designers as well. From a financial angle, leak rates often exceed 30% and cost individual factories tens of thousands of dollars in wasted power each year, incentivizing rapid payback retrofits. Enterprise sustainability officers now view leak-detection programs as low-hanging decarbonization wins, further accelerating demand for high-efficiency pneumatics.
Expansion of EV Manufacturing Facilities
Gigafactories assembling lithium-ion packs require class-0 compressed-air and nitrogen infrastructure to prevent particle contamination during electrode coating and cell sealing. Festo’s degassing cell integrates pneumatic cylinders with electric axes to pierce and vent pouch cells in one synchronized motion, illustrating the hybrid architectures emerging in battery lines [FESTO.COM]. With Asian battery supply chains clustering in Korea and China, local tier-one automakers are sourcing regionally to cut logistics risk, thereby boosting Asia Pacific demand. North American expansion from legacy carmakers broadens the opportunity set for vendors that can meet strict validation protocols and support multi-site rollouts.
IIoT-Enabled Predictive Maintenance Retrofits
Brownfield factories often run 10-year-old manifolds lacking diagnostics, so retrofittable sensor blocks and edge gateways offer an attractive upgrade path. Emerson’s Aventics platform channels pressure and flow data to cloud dashboards, enabling alerts before seal wear triggers downtime. Field case studies show that predictive algorithms can reduce unscheduled stoppages by 25% and cut mean-time-to-repair by 30%. The strongest uptake is in packaging and life-science plants where batch integrity and traceability are paramount. As subscription-based software revenues grow, leading vendors are evolving from hardware sellers into lifecycle solution partners.
Restraints Impact Analysis of Pneumatic Equipment Market*
| Restraint | (~) % Impact on CAGR Forecast | Geographic Relevance | Impact Timeline |
|---|---|---|---|
| High lifetime maintenance and energy costs | -1.4% | Global, particularly in energy-intensive regions | Long term (≥ 4 years) |
| Substitution by electric actuators in precision tasks | -1.1% | North America and Europe, expanding to APAC | Medium term (2-4 years) |
| ESG-driven penalties on compressed-air leakage | -0.8% | Europe and North America, with regulatory expansion to APAC | Medium term (2-4 years) |
| Shortage of ultra-clean compressed air for semicon fabs | -0.6% | APAC core semiconductor hubs, spill-over to North America | Short term (≤ 2 years) |
| Source: Mordor Intelligence | |||
High Lifetime Maintenance and Energy Costs
Total cost-of-ownership audits reveal that energy can make up 77% of compressor lifecycle expense, dwarfing capital outlay. Leak-fix programs cut consumption, yet they demand instrumentation and staff hours that smaller plants often lack. Government studies in Australia report average leakage at 30%, confirming a global inefficiency pattern.[3] While IIoT sensors promise automated leak tracking, initial hardware and analytics subscriptions deter price-sensitive operators. The persistence of double-digit electricity inflation in parts of Europe amplifies scrutiny on pneumatic bills and nudges buyers toward alternative actuation modes when duty cycles permit.
Substitution by Electric Actuators in Precision Tasks
Electric rod actuators deliver 75–80% energy efficiency versus 10–20% for equivalent pneumatic cylinders, and cycle life now exceeds 100 million strokes. Falling motor-drive prices are narrowing the upfront cost gap, particularly in semiconductor tooling and medical-device assembly where micron-level repeatability matters. Suppliers such as SMAC are streamlining production to lower list prices, signaling an intensifying replacement threat. However, pneumatics still excel in high-force, harsh-environment, and fail-safe spring-return scenarios, giving the technology a defensible role in many heavy-duty lines.
*Our forecasts treat driver/restraint impacts as directional, not additive. The impact forecasts reflect baseline growth, mix effects, and variable interactions.
Pneumatic Equipment Market Segment Analysis
By Component:
Valves Preserve Leadership Amid Smart-ActuatorUpswing Valves captured 33.02% of the pneumatic equipment market share in 2025, underscoring their central role in pressure and flow governance inside automated lines. Their dominance persists because every circuit, from pick-and-place robots to bulk conveyors, relies on directional and proportional valves to orchestrate motion sequences. Growth leans toward compact, protocol-agnostic manifolds that shorten installation time and align with smart-factory architectures.
Actuators are accelerating with a 7.46% CAGR, reflecting manufacturers’ need for higher payload accuracy and faster cycle rates. Emerson’s XV Series pushes 350 NL/min in a slim footprint, allowing designers to shrink cabinets without sacrificing throughput. Air preparation units and precision fittings round out the component mix as clean-air mandates intensify, while sensor accessories flourish thanks to predictive-maintenance adoption. As a result, the pneumatic equipment market continues to migrate from stand-alone parts to fully integrated, data-rich assemblies.

By Function:
Motion Control Dominant; Material Handling Gains SteamMotion control held 40.02% of 2025 demand across the pneumatic equipment market, reflecting its ubiquity in linear slides, rotary tables, and pressing stations. Linear cylinders anchored 82.3% of the pneumatic cylinder market share in 2024 as push-pull motions remain ubiquitous in assembly, press-fitting, and clamping jobs. The segment benefits from pneumatics’ favorable power-to-weight ratio and millisecond response, assets prized on high-speed assembly lines. Emphasis is now on feedback-ready cylinders that feed stroke data to MES platforms for traceability.
Material handling posts the swiftest 7.95% CAGR as e-commerce logistics fuels automated sortation centers. SMC’s RMH grippers, certified for cobot collaboration, illustrate how soft-touch gripping opens new SKU handling capabilities. Fluid control retains a niche in process industries, while vacuum generation expands in semiconductor wafer transport. Convergence is evident: advanced manifolds are combining positioning, gripping, and vacuum logic in one node, fortifying supplier stickiness in the pneumatic equipment market.
By End-user Industry:
Automotive Still on Top, Life Sciences in Catch-Up ModeAutomotive lines commanded 28.35% of 2025 sales, keeping the segment at the forefront of the pneumatic equipment market size. Traditional uses include spot-weld gun actuation and body-in-white clamping, with pneumatic tools supporting assembly and fastening applications; newer EV pack stations demand class-0 compressed air and finer pressure control. Rockwell Automation promotes modular cells that let line builders switch from ICE to battery variants with minimal downtime, a capability underpinned by smart pneumatics.
Life sciences register the fastest 7.20% CAGR as vaccine fill-finish suites and single-use bioreactors multiply. FDA cGMP rules push for stainless-steel valve blocks, redundant filters, and documentation-ready sensor kits, all of which deepen integration needs between OEMs and pneumatic suppliers. Packaging, electronics, and aerospace remain sizable niches, each with specialized cleanliness, force, or redundancy specifications that sustain healthy diversity within the pneumatic equipment industry.
By Pressure Range:
Low-Pressure Prevalence Faces High-Pressure NichesLow-pressure (less than 7 bar) systems delivered 45.12% revenue in 2025, supported by energy-optimization campaigns such as SMC’s 4-bar factory initiative, which promises CO₂ and cost cuts without throughput loss. Lower operating levels pair well with modern high-efficiency tooling, extending compressor life and shrinking leaks.
High-pressure (above 15 bar) units, though smaller in base, exhibit an 8.06% CAGR driven by aerospace fatigue testing, injection molding, and hydrogen refueling skids. Vendors are investing in composite-wound receiver tanks and advanced sealing to handle the added stress. Mid-pressure solutions bridge both worlds, enabling balanced force and economy for general industry. This dynamic keeps suppliers targeting tailored offerings rather than one-pressure-fits-all approaches, sustaining expansion across the pneumatic equipment market.
Geography Analysis
North America Pneumatic Equipment Market
North America generated 34.21% of global 2025 revenue owing to mature aerospace, pharmaceutical, and automotive sectors that demand high-specification solutions. Siemens’ USD 10 billion commitment to new Texas and California plants illustrates the region’s ongoing reshoring trend, which lifts component orders for motion, valve, and compressor packages. Imminent DOE compressor rules are sparking retrofit waves that stabilize equipment replacement cycles.
APAC Pneumatic Equipment Market
Asia Pacific posts the steepest 7.66% CAGR and is set to narrow the gap by 2031 as China, India, and ASEAN states erect new fabs and battery plants. Atlas Copco’s USD 46.5 million purchase of Korea-based Kyungwon Machinery signals strategic moves to localize supply and meet skyrocketing regional demand. Government incentives for semiconductor self-reliance in India and Vietnam add fresh pull for ultra-clean pneumatics.
Europe, Middle East and South America Pneumatic Equipment Market
Europe maintains a solid share, buoyed by stringent energy and sustainability directives. Bosch Rexroth’s EUR 160 million plant in Mexico underscores European OEMs’ split-market strategy: retain R&D at home while building cost-effective capacity near the U.S. customer base. Smaller but rising opportunities in South America and the Middle East hinge on petrochemical diversification projects that require rugged high-pressure pneumatic arrays, adding incremental volume to the pneumatic equipment market.
Regulatory Landscape
Pneumatic equipment suppliers operate under a mix of machinery safety, functional safety, and compressed-air efficiency requirements that increasingly shape product design and documentation. In the European Union, Regulation (EU) 2023/1230 (Machinery Regulation) replaces the prior Machinery Directive framework and sets updated essential health and safety requirements for machinery placed on the market, with full application effective 20 January 2027. That timeline is pushing OEMs and component makers to refresh conformity assessments and technical files.
Energy and trade actions are also influencing procurement and supply strategies for compressors and downstream pneumatic packages. In the United States, new DOE energy-efficiency standards for rotary air compressors effective January 2025 are accelerating retrofit decisions, while 2026 actions broadened compliance and sourcing considerations. The US Department of Commerce initiated investigations on 27 May 2026 and the US International Trade Commission initiated preliminary antidumping and countervailing duty investigations on 5 May 2026 into stationary and portable air compressors from China, Malaysia, and Vietnam. Standards bodies continue to update technical baselines, including ISO 4414 for pneumatic fluid power safety and ISO/FDIS 18623-1 advancing in early 2026 for air compressors and compressed air systems.
Competitive Landscape
The pneumatic equipment market shows moderate consolidation as top players blend hardware proficiency with software analytics. Festo, SMC, Parker-Hannifin, and Emerson collectively channel double-digit R&D budgets into sensor-rich valves and cloud dashboards that convert air data into actionable OEE insights. Patent filings on MEMS-based proportional valves highlight a migration toward finer pressure modulation suited for micro-assembly lines.
Strategic M&A is a key lever. Emerson’s Aventics buyout deepens fluid-automation intellect, while Ingersoll Rand’s bolt-ons in nitrogen generation widen its downstream reach. Applied Industrial Technologies’ USD 260 million Hydradyne deal adds fluid-power distribution heft and accelerates aftermarket parts access. Such moves aim to lock in regional presence and round out product gaps, maintaining a robust defense against niche challengers.
Emergent disruptors target wireless, battery-powered sensor nodes that clip onto legacy actuators, promising leak alerts within minutes. Simultaneously, ESG-focused innovators such as Kathairos pioneer zero-emission nitrogen-powered devices for oil-field pads, carving out green-premium niches. Established brands counter by pledging carbon-neutral operations, evidenced by Festo’s German sites achieving neutrality in 2023, an initiative that resonates with OEMs chasing Scope 3 reductions.
Pneumatic Equipment Industry Leaders
-
Emerson Electric Co.
-
SMC Corporation
-
Siemens AG
-
Festo SE and Co. KG
-
Janatics India Pvt Ltd
- *Disclaimer: Major Players sorted in no particular order

Pneumatic Equipment Market Companies Covered in this Report
- Festo SE and Co. KG
- Emerson Electric Co.
- SMC Corporation
- Parker-Hannifin Corporation
- Siemens AG
- Ingersoll Rand Inc.
- Atlas Copco AB
- Bosch Rexroth AG
- Norgren Ltd. (IMI plc)
- Airtac International Group
- CKD Corporation
- Camozzi Automation S.p.A.
- Danfoss A/S
- Honeywell International Inc.
- Eaton Corporation plc
- ROSS Operating Valve Co.
- Bimba Manufacturing LLC (IMI)
- Janatics India Pvt Ltd
- Chicago Pneumatic Tool Co. LLC
- Koki Holdings Co., Ltd.
- Yamaha Motor Co., Ltd. (Robotics)
Market Opportunities and Future Outlook
A near-term opportunity is turning compressed-air efficiency mandates into measurable, auditable retrofit programs that pair hardware upgrades with diagnostics and leak governance. With US DOE compressor efficiency standards in effect from January 2025 and plant audits increasingly referencing ISO 11011 practices, suppliers that bundle high-efficiency compressors, FRLs, flow and pressure sensing, and software for baseline and leak tracking have an advantage in brownfield factories where energy can dominate lifecycle cost. Offerings that quantify no-load loss and leakage, along with documentation-ready results, also align with ESG-driven scrutiny in Europe and North America.
A second opportunity is localized capacity and application engineering support for high-spec demand pockets, including semiconductor clean rooms, EV battery lines that need class-0 air and nitrogen infrastructure, and hygienic food and life-science plants that require traceability and validated components. Recent investments and launches indicate this shift is already underway: Andritz-Western Pneumatics added equipment via a USD 1.4 million Ruston, Louisiana facility expansion in May 2026, Francois Compressors India began factory extension works in Pirangut, Pune in January 2026, and Kirloskar Pneumatic launched a new centrifugal compressor model in June 2026. These actions support demand for suppliers that reduce lead times through regional manufacturing while delivering hybrid electro-pneumatic architectures and IIoT-enabled service models for multi-site rollouts.
Recent Industry Developments in Pneumatic Equipment Market
- April 2026: Siemens AG expanded its Industrial Edge ecosystem with added cybersecurity functionalities and enhanced data and AI integration, with a broader rollout targeted for the second half of 2026. The update strengthens the digital layer that connects shop-floor assets, including pneumatic control components, to standardized analytics and governance. It supports OEMs and end users seeking secure, interoperable edge-to-cloud diagnostics across mixed automation stacks.
- March 2026: SMC Corporation opened a new Japan Technical Center (JTC) in Kashiwanoha Smart City, Kashiwa, Japan, positioning it as a central global R&D hub for automation solutions. The facility supports faster development and validation of compact, connected pneumatic systems designed for smart-factory requirements. It also reinforces SMC's ability to industrialize wireless and sensor-integrated manifolds for demanding applications.
- July 2024: Emerson Electric Co. launched the AVENTICS Series XV pneumatic valve line aimed at improved interoperability and flow efficiency for factory automation. The release updates core valve technology used in motion and material-handling circuits while aligning with demand for energy-aware pneumatics. It also expands the Emersonecosystem for OEMs standardizing on modular valves and digital-ready architectures.
Pneumatic Equipment Market Report Scope and Research Methodology
Market Definition and Coverage
This market covers revenue generated from pneumatic equipment used to create motion and control using compressed air or pressurized gas, across industrial and commercial settings. It includes common pneumatic components and assembled systems sold through OEM and aftermarket channels.
Scope exclusions: We exclude purely hydraulic and purely electric motion-control hardware, plus general construction compressors that are not sold for pneumatic system use.
Segments Covered in This Report
- By Component
- Actuators
- Valves
- Air Preparation Units (FRLs)
- Fittings and Tubing
- Air Compressors
- Vacuum Generators
- Accessories
- By Function
- Motion Control
- Fluid Control
- Material Handling
- Vacuum Creation
- Power Generation / Air Supply
- By End-user Industry
- Automotive
- Food and Beverage Processing and Packaging
- Aerospace and Defense
- Life Sciences (Pharma and Medical Devices)
- Electronics and Semiconductor
- Chemical and Petrochemical
- Packaging Machinery
- Other End-user Industries
- By Pressure Range
- Low Pressure (less than 7 bar)
- Medium Pressure (7 - 15 bar)
- High Pressure (above 15 bar)
- By Geography
- North America
- United States
- Canada
- South America
- Brazil
- Argentina
- Chile
- Rest of South America
- Europe
- United Kingdom
- Germany
- France
- Italy
- Spain
- Russia
- Rest of Europe
- Asia Pacific
- China
- Japan
- India
- South Korea
- ASEAN-5
- Rest of Asia Pacific
- Middle East and Africa
- Middle East
- Saudi Arabia
- United Arab Emirates
- Turkey
- Rest of Middle East
- Africa
- South Africa
- Nigeria
- Egypt
- Rest of Africa
- Middle East
- North America
Data Sources, Market Sizing, and Validation
Desk Research
To build the base structure of the model, we start with public references that anchor industrial output, automation adoption, and trade flows for key pneumatic categories. Sources used include US Census Bureau manufacturing statistics, Eurostat industrial production series, UN Comtrade trade data, International Energy Agency energy efficiency indicators, and OSHA or EU machinery safety guidance that can influence equipment replacement cycles.
We then layer in company filings, annual reports, investor decks, and reputable press coverage to understand product mix patterns and pricing direction in a straightforward way. For cross-checking supplier footprints and patent intensity, especially for valves, actuators, and air-prep units, we also refer to paid subscriptions for company financials and patent databases where needed. These desk inputs are not exhaustive, and other public documents were used for clarification, cross-checks, and data validation.
Primary Interviews and Surveys
Primary work is used to validate what desk research cannot explain cleanly, such as how much demand is OEM-driven versus replacement, and how price realization changes by pressure class and duty cycle. We speak with manufacturers, distributors, integrators, and large end users across APAC, EMEA, and the Americas so assumptions can be checked across different factory maturity levels and regulatory environments.
Distribution of primary research fieldwork respondents
| Company type | Respondent position | Region |
|---|---|---|
| Top tier: 29% | CXOs: 16% | APAC: 45% |
| Mid tier: 52% | Functional/Unit leaders: 33% | EMEA: 29% |
| Smaller Players: 19% | Managers: 51% | Americas: 26% |
Market-Sizing & Forecasting
The core sizing starts with a top-down build where industrial production, automation investments, and trade data are used to reconstruct the addressable demand pool for pneumatic equipment across major regions. To keep totals realistic, we corroborate the output with selective bottom-up approximations, such as sampled supplier revenue splits by pneumatics, distributor channel checks, and an ASP x shipment logic for high-volume items like fittings, tubing, and standard cylinders.
Key inputs used in the model include manufacturing PMI and production indices, factory automation and packaging line additions, installed-base replacement cycles for valves and actuators, compressor and air-treatment retrofits linked to energy-saving programs, and import-export movement for common pneumatic parts. Where a data gap exists for smaller component categories, ratios are inferred from interview-based mix shares and then stress-tested against observable procurement behavior in end-user plants.
For forecasting, scenario analysis is used with a simple set of demand drivers and price assumptions that are reviewed with industry participants, and then converted into yearly growth paths by region. The final forecast is adjusted for expected shifts toward electro-pneumatic control, efficiency-driven upgrades, and normalization in project timing across cyclical industries.
Data Validation & Update Cycle
Outputs are checked against independent signals before sign-off, including industrial production trends, trade direction, and replacement-led demand cues shared by channel participants. If a region or component shows an unusual swing, assumptions are revisited, and follow-up calls are triggered to confirm whether the change is real or model-driven.
A multi-step review is applied where another analyst checks arithmetic, scope alignment, and year-over-year consistency, followed by a final pass for narrative and table coherence. Reports are refreshed annually, and interim updates are made when material events occur, such as regulatory shifts, sharp currency moves, or major capacity changes that can affect realized pricing.
Mordor Intelligence's Pneumatic Equipment Market Size Measured Against Other Published Estimates
Published market sizes for pneumatic equipment often vary because researchers draw the market box differently and also use different ways to convert volumes into revenue. Differences commonly come from what gets counted as pneumatic equipment, the base year chosen, and how pricing is assumed to move across regions.
Some estimates lean toward a broader definition and can fold in adjacent factory hardware, which raises the total even if the growth story is similar. In Mordor Intelligence, the count is limited to pneumatic components and systems that operate on compressed air or pressurized gas, and the totals are cross-checked using component mix, end-use activity, and trade-linked sanity checks.
Benchmark comparison
| Source | Market Size | Gaps in Research Methodology |
|---|---|---|
| Mordor Intelligence | USD 37.41 B (2026) | |
| Industry Research House A | USD 36.20 B (2025) | Uses a different base year and a longer forecast window, and it is unclear how aftermarket and small pneumatic sub-components are treated across end-user industries. |
| Market Publisher B | USD 34.90 B (2025) | States a 2024 base year and reports a 2025 value, but provides limited clarity on whether general-purpose compressors and tools are counted consistently across regions and channels. |
The spread in the table is mainly explained by year selection and scope discipline, not a disagreement on core demand drivers like automation and plant upgrades. By tying totals to repeatable indicators such as industrial activity, component mix, and trade direction, the result stays traceable and easier to reconcile when assumptions need updating.
Key Questions Answered in the Report
How big is the pneumatic equipment market in 2026?
The pneumatic equipment market size is USD 37.41 billion in 2026 and is projected to reach USD 52.29 billion by 2031.
What is the forecast CAGR for pneumatic equipment through 2031?
The sector is expected to post a 6.93% CAGR between 2026 and 2031.
Which component segment grows the fastest?
Actuators lead growth with a 7.46% CAGR, driven by demand for higher-precision motion in automated lines.
Which region is expanding most rapidly?
Asia Pacific records the quickest pace at 7.66% CAGR through 2031, propelled by battery and semiconductor investments.
What regulation is influencing compressor upgrades in the United States?
New DOE energy-efficiency standards for rotary air compressors, effective January 2025, are triggering nationwide retrofits.