
PMMA Microspheres Market Size and Share
Market Overview
| Study Period | 2020 - 2031 |
|---|---|
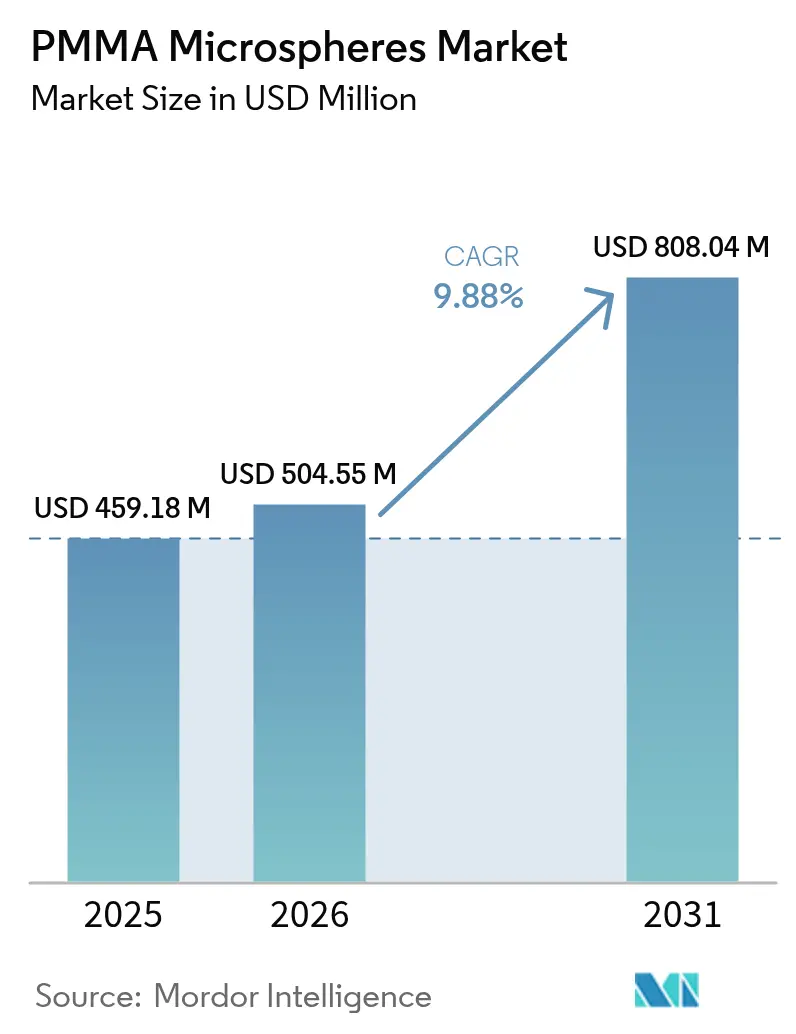
| Market Size (2026) | USD 504.55 Million |
| Market Size (2031) | USD 808.04 Million |
| Growth Rate (2026 - 2031) | 9.88 % |
| Fastest Growing Market | Asia Pacific |
| Largest Market | Asia Pacific |
| Market Concentration | Medium |
Major Players *Disclaimer: Major Players sorted in no particular order Image © Mordor Intelligence. Reuse requires attribution under CC BY 4.0. | |
PMMA Microspheres Market Analysis by Mordor Intelligence
The PMMA Microspheres market size is expected to grow from USD 459.18 million in 2025 to USD 504.55 million in 2026 and is forecast to reach USD 808.04 million by 2031 at 9.88% CAGR over 2026-2031. This strong trajectory reflects broadening adoption across aesthetic medicine, drug-delivery, advanced optics, and high-performance coatings. Growing demand for permanent dermal fillers, expansion of energy-efficient LED/LCD production, and the shift toward precision drug-delivery platforms are elevating volume and value growth. Producers are prioritizing monodisperse, surface-modified grades that command price premiums in life-science and electronics applications. Regulatory pressure on commodity microplastics is steering innovation toward sustainable or high-value niches rather than suppressing overall demand, while capacity optimization by large MMA suppliers is underpinning a tighter but more profitable supply environment.
Key Report Takeaways
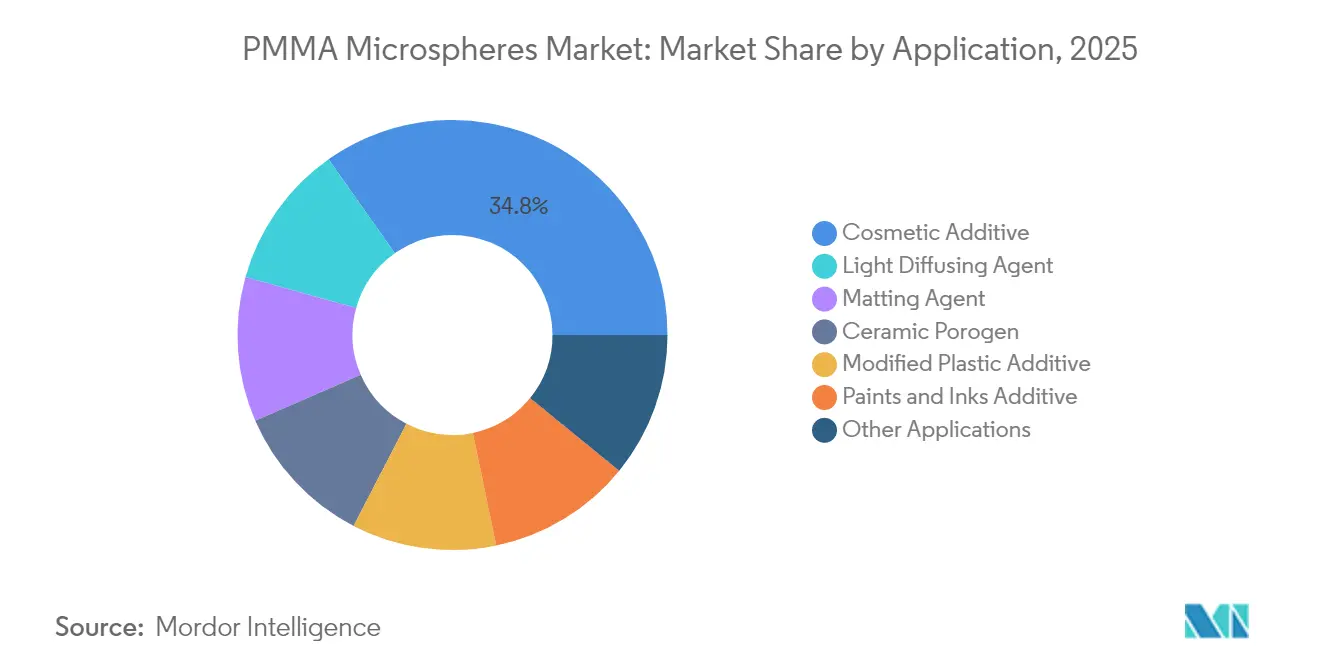
- By application, Cosmetic Additive led with 34.78% of PMMA microspheres market share in 2025; Ceramic Porogen applications are projected to expand at an 11.55% CAGR through 2031.
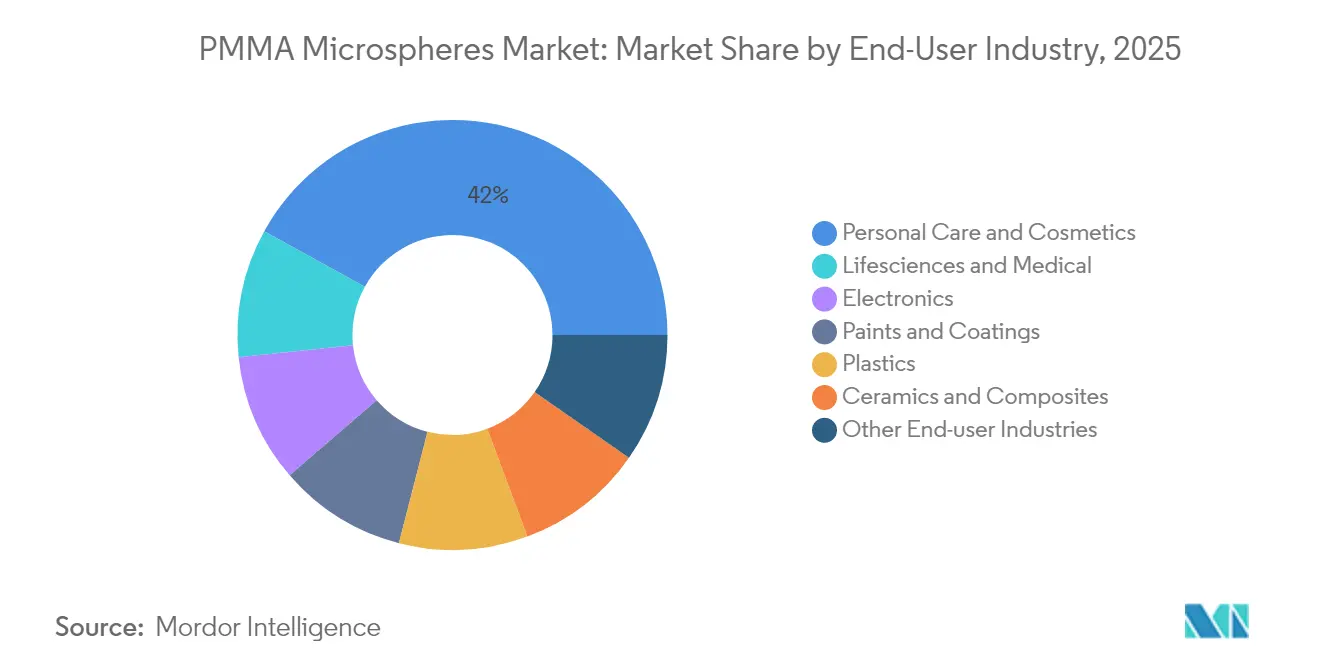
- By end-user industry, Personal Care & Cosmetics held 41.98% of the PMMA microspheres market share in 2025, while Lifesciences & Medical is forecast to grow the fastest at 12.35% CAGR to 2031.
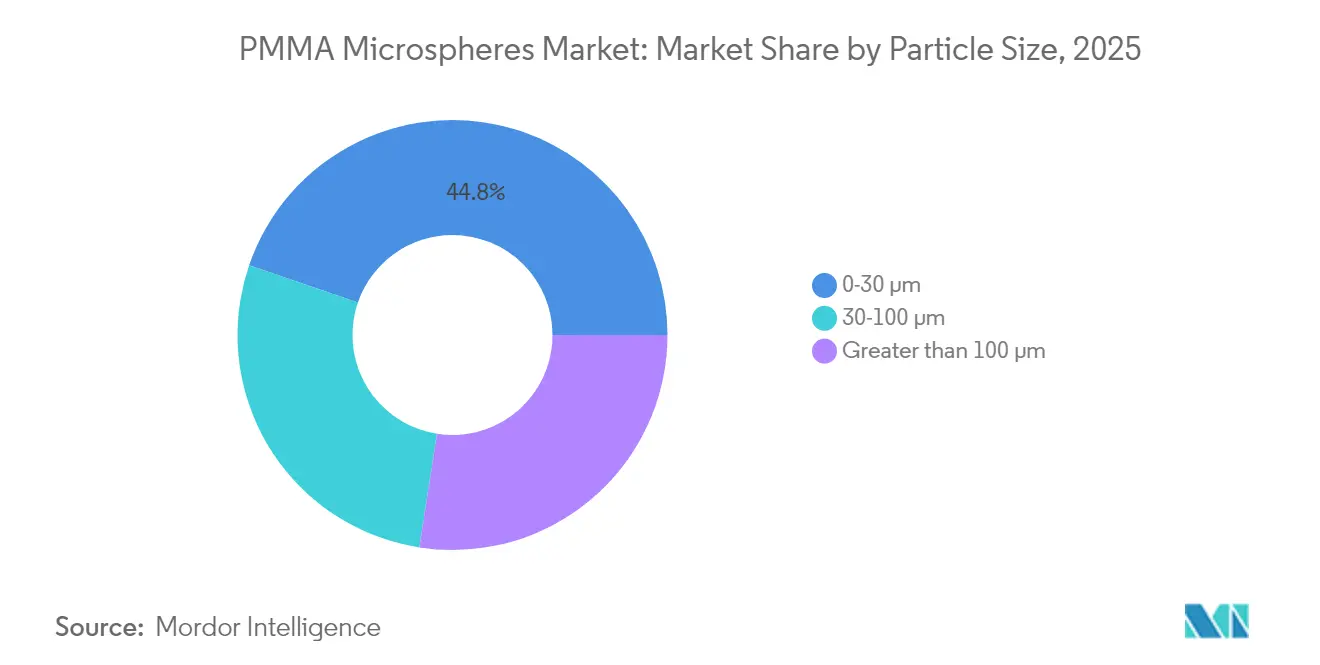
- By particle size, the 0-30 µm segment commanded 44.75% of the PMMA microspheres market size in 2025, whereas the 30-100 µm range is expected to post a 13.62% CAGR during 2026-2031.
- By region, Asia-Pacific captured 39.05% of PMMA microspheres market share in 2025 and is projected to expand at a 10.44% CAGR through 2031.
Note: Market size and forecast figures in this report are generated using Mordor Intelligence’s proprietary estimation framework, updated with the latest available data and insights as of 2026.
Market Trends and Insights
Drivers Impact Analysis of PMMA Microspheres Market*
| Driver | (~) % Impact on CAGR Forecast | Geographic Relevance | Impact Timeline |
|---|---|---|---|
| Growing demand for PMMA dermal fillers in minimally-invasive aesthetics | +2.80% | North America & EU, expanding to APAC | Medium term (2-4 years) |
| Expanding use in drug-delivery & embolization therapies | +2.10% | Global, with concentration in developed markets | Long term (≥ 4 years) |
| Adoption as light-diffusing & matting agents in LED/LCD, coatings | +1.90% | APAC core, spill-over to global electronics hubs | Short term (≤ 2 years) |
| Rising utilisation in personal-care formulations for texture enhancement | +1.70% | Global, led by premium cosmetics markets | Medium term (2-4 years) |
| Microfluidic diagnostic devices requiring PMMA calibration beads | +1.20% | North America & EU, emerging in APAC | Long term (≥ 4 years) |
| Source: Mordor Intelligence | |||
Growing Demand for PMMA Dermal Fillers in Minimally-Invasive Aesthetics
Bellafill, the only FDA-approved permanent injectable containing 20% PMMA microspheres, delivers wrinkle correction that persists for up to 15 years. A low 0.011% granuloma incidence reported across 4,725 gluteal-augmentation procedures underscores long-term safety[1]Berthold Lemperle, “Fifteen-Year Follow-Up of PMMA Microsphere Fillers,” Aesthetic Surgery Journal, aestheticsurgeryjournal.org . Microspheres in the 30-50 µm range resist phagocytosis yet foster collagen ingrowth, providing durable tissue support. Large-volume body-contouring usage is expanding the PMMA microspheres market by broadening the patient base beyond facial aesthetics. Clinics value reduced retreatment frequency, creating steady pull-through for medical-grade suppliers.
Expanding Use in Drug-Delivery & Embolization Therapies
PMMA microspheres offer lower nonspecific protein binding than polystyrene, improving biocompatibility in controlled-release systems. Surface carboxyl functionality enhances drug conjugation, while the density of 1.19 g/cc eases centrifugation handling. Continuous production of monodisperse porous particles with 50 nm pores now supports oncology drug-eluting beads. Commercial interest is rising as continuous manufacturing cuts costs and tightens batch consistency.
Rising Utilisation in Personal-Care Formulations for Texture Enhancement
Encapsulation of ethylhexyl salicylate within PMMA microspheres increases SPF by 40% while mitigating skin irritation. Spray-dried PMMA-boron nitride composites deliver soft focus and thermal conductivity for high-definition makeup. EU Regulation 2023/2055 restricts synthetic polymer microparticles in rinse-off products by 2027 and leave-on products by 2029, encouraging premium brands to reserve PMMA microspheres for high-value leave-on creams and exploring bio-based substitutes for mass lines.
Microfluidic Diagnostic Devices Requiring PMMA Calibration Beads
Diagnostic-chip manufacturers employ monodisperse PMMA beads as flow-rate calibrants and optical reference standards, leveraging tight coefficient-of-variation control below 3%. As point-of-care testing expands, reliable bead supplies underpin assay reproducibility, especially in infectious-disease and oncology panels across advanced health-care markets.
Restraints Impact Analysis of PMMA Microspheres Market*
| Restraint | (~) % Impact on CAGR Forecast | Geographic Relevance | Impact Timeline |
|---|---|---|---|
| Regulatory scrutiny over permanent dermal-filler safety | -1.40% | Global, stricter in EU and emerging markets | Medium term (2-4 years) |
| MMA monomer price volatility impacting production costs | -0.90% | Global, acute in regions with limited MMA capacity | Short term (≤ 2 years) |
| Limited global capacity for monodisperse high-precision grades | -0.70% | Global, concentrated in specialized applications | Long term (≥ 4 years) |
| Source: Mordor Intelligence | |||
Regulatory Scrutiny Over Permanent Dermal-Filler Safety
Only one PMMA-based filler has FDA clearance, underscoring rigorous evidence requirements. Adverse events correlate with injection depth; submucosal placement increases nodule formation, prompting practitioner training mandates[2]João de Jesus, “Complication Rates in PMMA Gluteal Augmentation,” PubMed, pubmed.ncbi.nlm.nih.gov . Mandatory skin tests for bovine collagen carriers add cost. Emerging markets are tightening regulations, potentially lengthening approval timelines, and limiting broad uptake despite clinical durability advantages.
MMA Monomer Price Volatility Impacting Production Costs
Sumitomo Chemical cut 80% of MMA and 70% of PMMA capacity in Singapore in late 2024, tightening Asian supply and lifting spot prices. Kuraray’s integration moderates volatility in Japan, yet feedstock shortages periodically raise costs for downstream bead producers. Chemical recycling initiatives such as Mitsubishi Chemical’s microwave-depolymerization may temper input-price swings once scaled.
*Our forecasts treat driver/restraint impacts as directional, not additive. The impact forecasts reflect baseline growth, mix effects, and variable interactions.
PMMA Microspheres Market Segment Analysis
By Application:
Cosmetic Additive Retains Leadership amid Sustainability PivotCosmetic Additive applications held 34.78% of PMMA microspheres market share in 2025, valued for imparting silky texture, soft-focus optics, and controlled release of actives. Premium skincare, color cosmetics, and suncare continue to specify medical-grade, low-residual MMA beads to satisfy safety audits. EU microplastic rules, however, are shifting large-volume mass-market lotions toward bio-based fillers, redirecting PMMA demand into leave-on serums and targeted anti-aging lines. Ceramic Porogen uses are accelerating at an 11.55% CAGR, as additive-manufactured alumina and zirconia components require sacrificial PMMA templates to engineer uniform pore networks critical for thermal-shock resistance. Light-diffusing agents in display films and matting additives in industrial coatings sustain mid-single-digit growth by delivering energy efficiency and low-gloss finishes, respectively. Modified Plastic Additive and Paints & Inks Additive segments absorb steady volumes where PMMA microspheres improve impact strength and rheology control.


By End-User Industry:
Personal Care Dominance Meets Medical MomentumPersonal Care & Cosmetics accounted for 41.98% of the PMMA microspheres market size in 2025, leveraging enduring consumer appetite for premium tactile and optical performance. Brand owners fund extensive formulation trials that keep demand resilient despite regulatory headwinds. Lifesciences & Medical applications are expanding at 12.35% CAGR on the back of durable dermal-fillers, embolization beads, and in vitro diagnostics. Electronics manufacturers rely on PMMA microspheres to balance luminance and haze in LED light-guides, sustaining double-digit demand as screen sizes enlarge. Paints & Coatings value beads for uniform gloss reduction in high-durability architectural finishes. Plastics compounders incorporate larger spheres to enhance impact resistance in PMMA-based alloys used in automotive lenses. Ceramics & Composites players exploit sacrificial porogens to fine-tune density in aerospace and energy-storage components, pushing technical-grade volume growth above industrial averages.
By Particle Size:
Fine-Particle Dominance with Mid-Range UpswingFine 0-30 µm grades delivered 44.75% of PMMA microspheres market size in 2025, essential for smooth sensory feel in skincare and accurate calibration in immunoassays. High surface-area-to-volume ratios favor efficient drug loading and consistent optical diffusion in thin films. The 30-100 µm band is projected to expand at a 13.62% CAGR, reflecting rising usage in ceramic porogens, injectable body-contouring fillers, and lightweight composite cores. Demand in this range benefits from improved processability through narrowing size tolerances. Particles above 100 µm remain niche, serving specialty calibration kits, filtration media, and academic research. However, tighter monodispersity in large diameters attracts premium pricing that offsets smaller volumes, sustaining a profitable if specialized sub-market.
Geography Analysis
APAC PMMA Microspheres Market
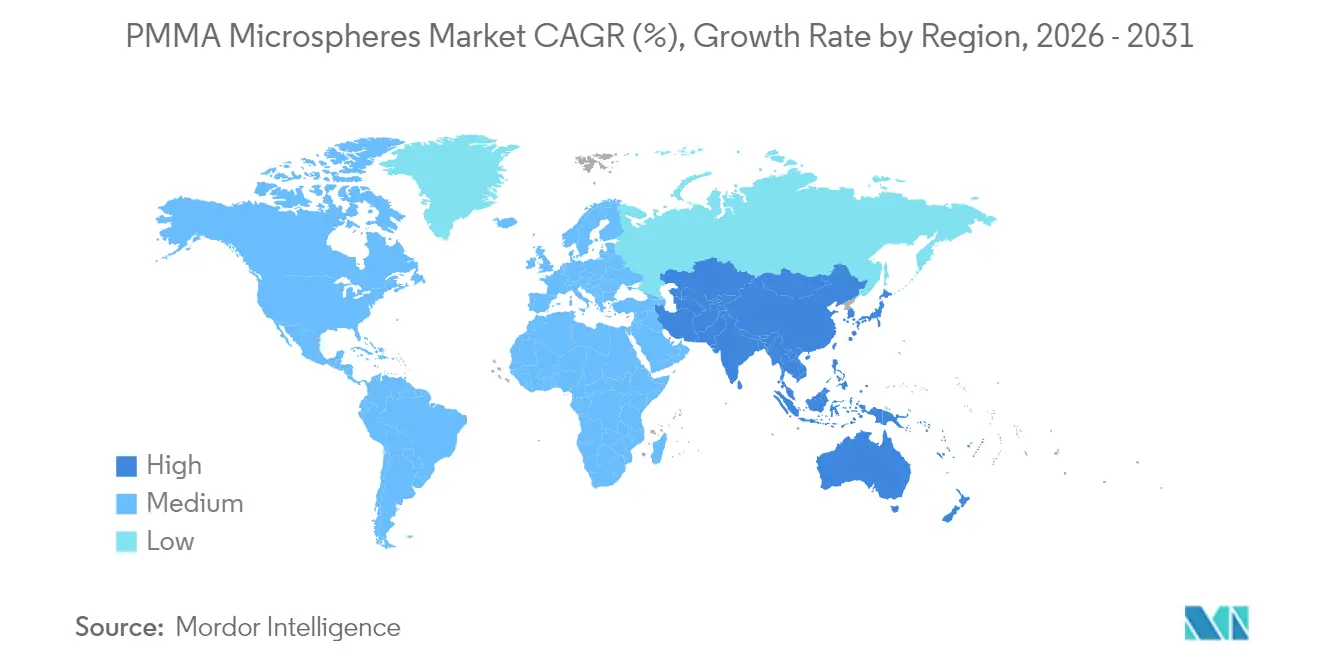
Asia-Pacific led with 39.05% of PMMA microspheres market share in 2025. China’s display-panel makers, Japanese fine-chemicals specialists, and South Korean consumer-electronics brands provide a robust demand backbone. Capacity consolidation, including Sumitomo Chemical’s Singapore restructuring, nudges regional supply toward specialty grades yet maintains volume growth through 2031 at a 10.44% CAGR. Government incentives for semiconductor and medical-device supply chains further broaden downstream consumption.
North America PMMA Microspheres Market
North America benefits from stringent FDA standards, which favor domestic output of ISO-13485-compliant beads for injectable fillers and diagnostics. The Bellafill franchise anchors steady medical demand, while Wisconsin-based Nouryon has scaled specialty microsphere output for packaging and construction additives. R&D tax credits and venture capital funding in drug-delivery start-ups sustain innovation-driven consumption even as commodity volumes migrate offshore.
EMEA and South America PMMA Microspheres Market
Europe faces the most restrictive polymer-micro-particle regulation, yet advanced-manufacturing bases in Germany and the Netherlands channel PMMA microspheres into high-margin coatings, automotive optics, and implantable medical devices. Producers are investing in bio-based or chemically recycled feedstocks that align with EU circular-economy goals, sustaining modest but profitable growth. South America and the Middle East & Africa remain emerging opportunity zones where growing healthcare infrastructure and infrastructure coatings uptake create incremental demand, though import dependence and regulatory variability temper rapid expansion.

Regulatory Landscape
In the European Union, PMMA microspheres used as synthetic polymer microparticles (SPM) fall under the REACH restriction framework for microplastics (Annex XVII, Entry 78). The placing-on-the-market prohibition for SPM intentionally added to mixtures at concentrations of 0.01% by weight or higher has applied since 17 October 2023 under Regulation (EU) 2023/2055, which has pushed personal care formulations toward reformulated products and shifted demand toward derogated, higher-value uses.
Commission Regulation (EU) 2026/1168 (adopted 1 June 2026) amends Entry 78, adding a PPORD derogation for SPM at 1 tonne per year or less and revising the derogation for particles permanently incorporated into a solid matrix (applying from 22 June 2028). Medicinal products containing SPM are derogated from the EU ban but carry REACH reporting obligations, with initial reporting tied to the 2026 calendar year and due by 31 May 2027, increasing traceability and documentation requirements across medical-grade PMMA microsphere supply chains.
Value Chain Analysis
The PMMA microspheres value chain begins with methyl methacrylate (MMA) monomer sourcing, which is often concentrated in large petrochemical and specialty polymer hubs in countries such as Germany, Japan, and South Korea. This is followed by polymerization into PMMA and conversion into microspheres. Bead manufacturing commonly uses emulsion, suspension, or dispersion polymerization, with emulsion routes used for smaller biomedical grades and suspension routes used more often for larger industrial particle sizes; downstream steps include washing, drying, classification into tight size cuts (for example, 0-30 micrometers and 30-100 micrometers), and surface functionalization (such as carboxylated or other modified surfaces) for medical, diagnostics, and electronics applications.
Quality systems and application validation are central for injectable and diagnostic uses, where monodispersity, low residual monomer, and lot-to-lot consistency drive qualification and pricing. Distribution typically runs through a mix of direct supply to key accounts (personal care brands, electronics film makers, diagnostics companies) and specialty chemical distributors for R&D and small-volume needs, while key constraints include MMA feedstock volatility and limited global capacity for monodisperse, high-precision grades, tightening supply for premium segments.
Competitive Landscape
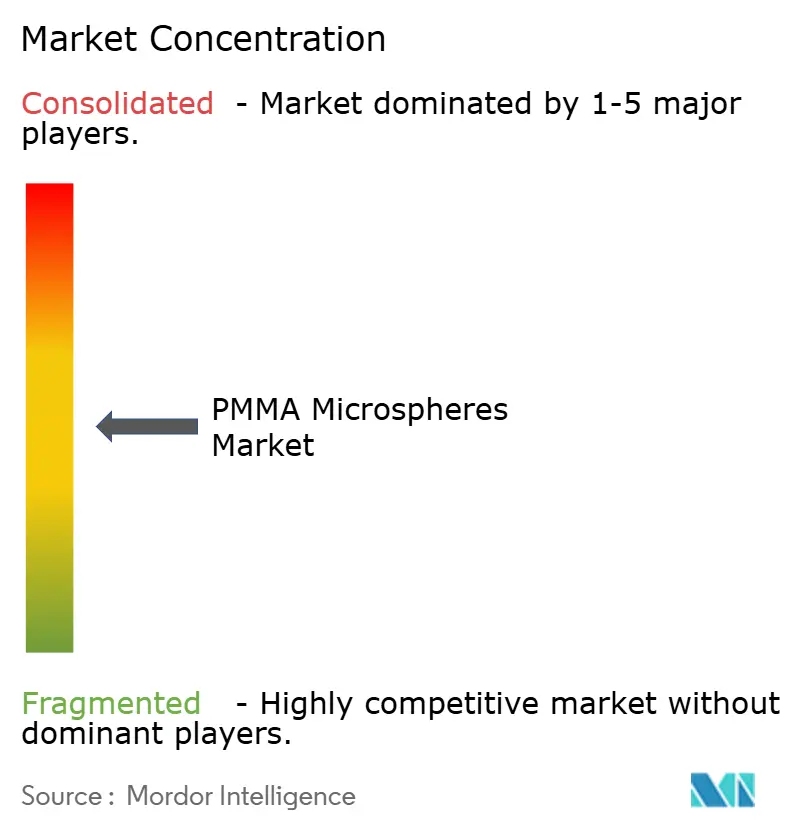
The PMMA microspheres market is moderately fragmented. Polysciences and Sekisui Kasei leverage vertically integrated production and ISO-certified quality management to service critical medical and electronic accounts. Bangs Laboratories focuses on diagnostic-grade calibration beads, commanding premiums for lot-to-lot uniformity. Sumitomo Chemical exerts upstream influence through MMA monomer and bulk PMMA supply, increasingly channeling output toward value-added bead formulations.
Strategic moves emphasize specialty capacity. Sumitomo Chemical started pilot production of chemically recycled PMMA in Japan, positioning recycled feedstock for electronic-grade beads. Companies are also entering joint development projects with display and cosmetics leaders to engineer application-specific surface chemistries that enhance compatibility and performance, reinforcing supply-chain partnerships and raising switching costs for buyers.
Competitive intensity is rising in sustainability. Several mid-sized firms are trialing bio-based PMMA precursors derived from plant-derived isobutylene. Early results indicate comparable refractive index and hardness, presenting a potential long-term competitive differentiator once cost parity is achieved. Intellectual-property portfolios focusing on continuous-flow polymerization and low-residual-monomer purification create barriers to entry for new participants.
PMMA Microspheres Industry Leaders
Cospheric LLC
Matsumoto Yushi-Seiyaku Co.,Ltd
Phosphorex
Polysciences
Sekisui Kasei Co., Ltd.
- *Disclaimer: Major Players sorted in no particular order
PMMA Microspheres Market Companies Covered in this Report
- Bangs Laboratories, Inc.
- CD Bioparticles
- Cospheric LLC
- EPRUI Biotech Co.,Ltd.
- Goodfellow Cambridge Ltd.
- Heyo Enterprises Co., Ltd.
- Kayaku AM.
- Matsumoto Yushi-Seiyaku Co.,Ltd
- microParticles GmbH
- Phosphorex
- Polysciences
- Sekisui Kasei Co., Ltd.
- Sumitomo Chemical Co., Ltd.
- Sunjin Beauty Science

Market Opportunities and Future Outlook
A whitespace is developing in EU-compliant, high-performance use cases where PMMA microspheres are either derogated (for example, medicinal products under REACH Entry 78) or effectively embedded in durable matrices. This is shifting competition away from commodity exfoliant-style particles toward documented, fit-for-purpose performance additives. The 2026 amendments under Commission Regulation (EU) 2026/1168, including updated derogations and 2026-calendar-year reporting due by 31 May 2027, raise the bar for traceable grades and supplier documentation, particularly in medical and diagnostics, where product stewardship is already aligned to performance qualification.
Electronics and advanced materials remain a major opportunity area centered on engineered particle attributes, including tight size distributions, low dielectric behavior, and controlled optical diffusion. Sekisui Kasei has been actively marketing specialized spherical polymer particles under its TECHPOLYMER series, including low-dielectric particle positioning for resin engineering (materials refreshed in January 2026) and a coatings-facing showcase at the American Coatings Show in April 2026. Upstream sustainability programs also support procurement for lower-carbon feedstock claims, with Sumitomo Chemical moving chemically recycled PMMA into mass production in March 2025, while maintaining the particle-performance specifications required by high-value end users in coatings and electronics supply chains.
Recent Industry Developments in PMMA Microspheres Market
- June 2026: Phosphorex announced a virtual panel on targeted lipid nanoparticle development scheduled for July 29, 2026, highlighting its activity in particulate drug delivery development. The visibility around its delivery-platform work reinforces downstream demand for controlled, biocompatible particle systems and supports tighter collaboration between material suppliers and formulation-focused CDMOs.
- March 2025: Sumitomo Chemical commenced mass production of chemically recycled PMMA aimed at high-quality applications in electronics and automotive. Expanding recycled feedstock availability supports customers pursuing circularity goals while keeping performance-linked applications, such as optical and specialty additive uses, within specification.
- April 2024: Sumitomo Chemical partnered with Star Jewelry to develop applications for its sustainable acrylic material, Meguri, and advanced its pilot chemical recycling setup in Japan tied to SUMIPEX Meguri commercialization plans. The initiative broadened end-market validation for recycled PMMA, helping translate sustainability programs into qualified, brand-facing applications.


PMMA Microspheres Market Report Scope and Research Methodology
Market Definition and Coverage
For this methodology, the PMMA microspheres market is defined as the value of polymethyl methacrylate microsphere materials sold into downstream uses, across standard particle size bands, and counted at the point of sale to industrial and specialty customers.
Scope exclusions: We exclude finished consumer products that only contain PMMA microspheres as an ingredient, as well as non-PMMA polymer microspheres and unrelated filler particles.
Segments Covered in This Report
- By Application
- Light Diffusing Agent
- Matting Agent
- Cosmetic Additive
- Ceramic Porogen
- Modified Plastic Additive
- Paints and Inks Additive
- Other Applications
- By End-user Industry
- Lifesciences and Medical
- Personal Care and Cosmetics
- Electronics
- Paints and Coatings
- Plastics
- Ceramics and Composites
- Other End-user Industries
- By Particle Size
- 0 – 30 µm
- 30 – 100 µm
- Greater than 100 µm
- By Geography
- Asia-Pacific
- China
- Japan
- India
- South Korea
- Rest of Asia-Pacific
- North America
- United States
- Canada
- Mexico
- Europe
- Germany
- United Kingdom
- France
- Italy
- Rest of Europe
- South America
- Brazil
- Argentina
- Rest of South America
- Middle East and Africa
- Saudi Arabia
- South Africa
- Rest of Middle East and Africa
- Asia-Pacific
Data Sources, Market Sizing, and Validation
Desk Research
Desk research was used to build the first skeleton of the market model, mainly around supply availability, end-use linkages, and the pace of adoption in personal care, medical, and electronics uses. We reviewed public sources such as USGS materials data, USITC trade statistics, UN Comtrade, OECD indicators, and patent databases to understand PMMA-related activity, application development, and import-export flows where they act as supporting signals.
To keep assumptions grounded, we also relied on company annual reports, investor presentations, product brochures, technical notes, and reputable trade-press coverage that discusses particle size ranges, typical performance claims, and downstream demand cycles. A paid subscription focused on company financials and intelligence was used selectively to cross-check corporate structure and approximate exposure to specialty materials. The sources listed above are illustrative only, and many other public and paid references were used for data collection, validation, and clarification.
Primary Interviews and Surveys
Primary work was used to pressure-test the desk assumptions, especially where PMMA microspheres are sold through distributors or bundled into formulation packages that can blur pricing. We spoke with a mix of material suppliers, compounders, formulators, and downstream users across APAC, EMEA, and the Americas so the model reflects differences in application mix and purchasing behavior.
Inputs from these discussions were used to align typical selling price ranges by size band, confirm which applications are actively scaling, and validate how much demand is met locally versus through imports.
Distribution of primary research fieldwork respondents
| Company type | Respondent position | Region |
|---|---|---|
| Top tier: 36% | CXOs: 12% | APAC: 42% |
| Mid tier: 44% | Functional/Unit leaders: 41% | EMEA: 35% |
| Smaller Players: 20% | Managers: 47% | Americas: 23% |
Market-Sizing & Forecasting
Sizing was built using a top-down and bottom-up approach, where the starting point was an application-led demand pool that is reconstructed using end-use output signals and PMMA microsphere penetration in those formulations. For example, we linked personal care and cosmetics activity, coatings output, electronics manufacturing trends, and medical procedure volumes to likely consumption, and then applied size-band splits (0-30 um, 30-100 um, and above 100 um) with price bands that were validated in interviews.
The totals were then corroborated with selective bottom-up approximations, such as rolling up a sample of supplier and distributor revenues, and checking implied volumes against typical use rates in key applications like light diffusion, matting, and cosmetic additives. Where disclosure gaps exist, we used conservative scaling factors tied to capacity commentary, trade movement signals, and observed adoption timing, and those were rechecked with expert feedback.
For forecasting, scenario analysis was used so we could reflect a base case and also show sensitivity to a few practical drivers, including the pace of premiumization in personal care, adoption in aesthetics and medical devices, shifts in electronics display and optical components demand, and expected price movement as higher-performance grades gain share. Assumptions were kept traceable to observable indicators and were adjusted only when multiple sources pointed in the same direction.
Data Validation & Update Cycle
Outputs were validated through cross-checks against independent signals, such as regional demand patterns, trade direction, and whether implied pricing stays realistic by size band and application. When a region or application produced an outlier result, the inputs were re-opened and then checked again with a second pass of desk sources and follow-up questions to primary contacts.
Before sign-off, the work goes through multi-step internal review so calculation logic, unit consistency, and year-to-year movement are all clean. The report is refreshed annually, and interim updates are made when a material event changes supply, pricing, or downstream demand. Right before delivery, we run a final update sweep so clients receive the latest view available at that time.
Mordor Intelligence's Pmma Microspheres Market Size Compared With Other Published Estimates
Published PMMA microspheres market numbers often differ because each publisher draws the market boundary in its own way, and then applies different pricing logic and timing for currency conversion. Differences also show up when one estimate is closer to raw material supply signals, while another is built mainly from end-use demand narratives.
In this market, the biggest drivers of spread are whether adjacent polymer microspheres are blended into the total, whether internal transfer pricing is treated like external sales, and how application splits are handled for cosmetics versus industrial uses. Another common reason is price progression, since some studies assume flat pricing across size bands, while others model a gradual mix shift toward higher value grades, which changes the total even if volume grows at a similar pace.
Benchmark comparison
| Source | Market Size | Gaps in Research Methodology |
|---|---|---|
| Mordor Intelligence | USD 0.50 B (2026) | |
| Global Research Publisher A | USD 0.43 B (2024) | Uses an earlier base year and a broader interpretation that can mix PMMA microspheres with nearby polymer microsphere categories, which compresses comparability when the scope is not separated by chemistry and use condition. |
| Industry Research Publisher B | USD 0.21 B (2024) | Appears to rely on a narrower supplier set and more limited channel coverage, which can miss distributor-led volumes and understate price differences across particle sizes, especially for cosmetic and medical grade material. |
The table shows that timing and scope choices explain most of the variance, not just a different growth rate assumption. When PMMA-only revenues are counted at external selling prices and checked against size-band pricing and end-use demand signals, the market total lands closer to USD 0.50 B for 2026, which is the approach used by Mordor Intelligence.


Key Questions Answered in the Report
What is the current PMMA microspheres market size?
The PMMA microspheres market size is valued at USD 504.55 million in 2026 and is forecast to reach USD 808.04 million by 2031.
Which application segment leads the PMMA microspheres market?
Cosmetic Additive applications lead with 34.78% market share in 2025.
Which end-user industry is growing the fastest?
Lifesciences & Medical is advancing at a 12.35% CAGR to 2031, the fastest among all end-user groups.
Why are PMMA microspheres important in LED/LCD displays?
They provide high haze and transmittance, improving brightness uniformity while reducing warpage in backlighting units.
How is regulation affecting PMMA microspheres in cosmetics?
EU Regulation 2023/2055 restricts synthetic microplastics in rinse-off products by 2027 and leave-on products by 2029, redirecting PMMA microspheres toward premium leave-on formulations and prompting development of sustainable alternatives.
What sustainability initiatives exist for PMMA microspheres?
Sumitomo Chemical and Mitsubishi Chemical Group are commercializing chemically recycled PMMA feedstocks, aiming to lower carbon footprints while securing supply stability.
Page last updated on:


 Your data is secure and never sold or shared.


