
Plastic Furniture Market Size and Share
Market Overview
| Study Period | 2020 - 2031 |
|---|---|
| Market Size (2026) | USD 17.56 Billion |
| Market Size (2031) | USD 21.88 Billion |
| Growth Rate (2026 - 2031) | 4.50 % |
| Fastest Growing Market | Asia Pacific |
| Largest Market | North America |
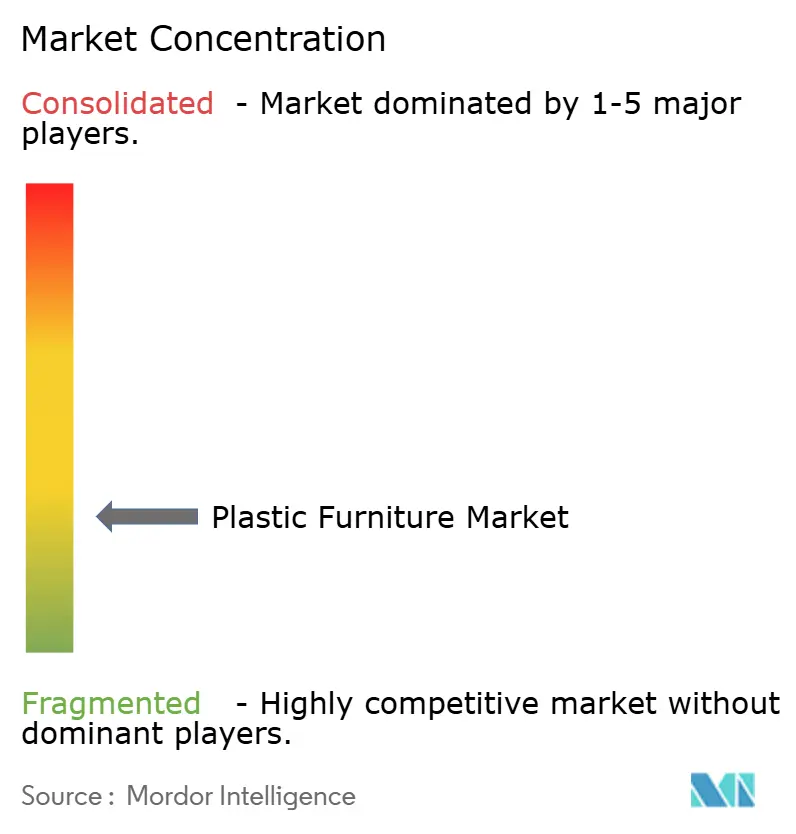
| Market Concentration | Low |
Major Players *Disclaimer: Major Players sorted in no particular order Image © Mordor Intelligence. Reuse requires attribution under CC BY 4.0. | |
Plastic Furniture Market Analysis by Mordor Intelligence
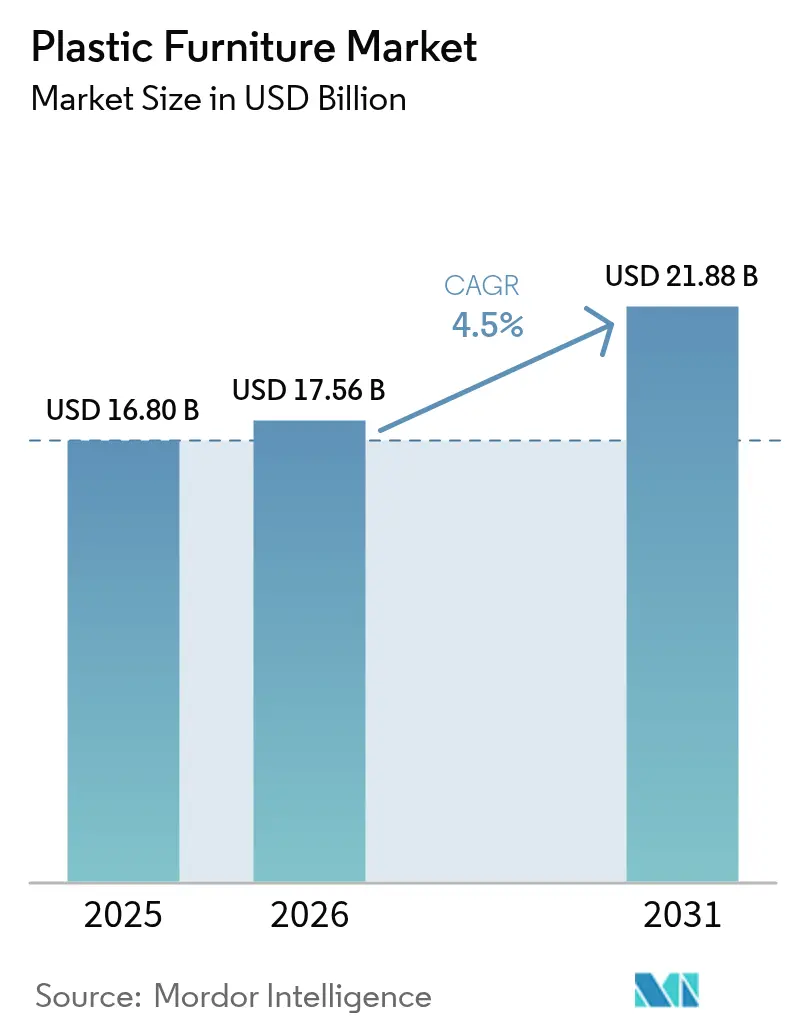
The Plastic Furniture market size is expected to grow from USD 16.80 billion in 2025 to USD 17.56 billion in 2026 and is forecast to reach USD 21.88 billion by 2031 at 4.5% CAGR over 2026-2031.
Solid demand stems from rapid urbanization, rising outdoor living investments, and the cost advantages of flat-pack designs that travel well through e-commerce channels. Manufacturers are widening their range with recycled and specialty polymers to stay ahead of tightening sustainability regulations. Product innovation now centers on modular, space-saving furniture that appeals to apartment dwellers, while UV-stabilized and glass-reinforced composites extend use into harsher climates and premium indoor settings. Competitive intensity is growing as direct-to-consumer (DTC) entrants absorb retail margins and incumbents fund circular-economy initiatives to secure post-consumer plastic feedstock.
Key Report Takeaways
- By product, chairs led with 39.45% revenue share in 2025; cabinets are projected to expand at a 5.12% CAGR through 2031.
- By end user, the residential segment held 59.30% of the plastic furniture market share in 2025, while the commercial segment records the highest projected CAGR at 5.39% through 2031.
- By price range, economy products commanded 48.35% of the plastic furniture market size in 2025; the premium tier is set to grow at a 5.67% CAGR during 2026-2031.
- By distribution channel, B2C/retail dominated at 61.10% in 2025; online retail within this channel is forecast to grow at a 6.08% CAGR from 2026-2031.
- By region, North America accounted for 34.70% revenue share in 2025; Asia-Pacific is the fastest-growing geography with a 5.88% CAGR projected for 2026-2031.
Note: Market size and forecast figures in this report are generated using Mordor Intelligence’s proprietary estimation framework, updated with the latest available data and insights as of 2026.
Market Trends and Insights
Drivers Impact Analysis of Plastic Furniture Market*
| Driver | (~) % Impact on CAGR Forecast | Geographic Relevance | Impact Timeline |
|---|---|---|---|
| Rapid urbanization is driving modular space-saving designs | +1.0% | Asia-Pacific, Latin America, Middle East & Africa | Medium term (2–4 years) |
| Outdoor & garden furniture demand | +0.8% | North America, Europe, Asia-Pacific | Short term (≤ 2 years) |
| Eco-friendly and recycled materials | +0.6% | Global (early uptake in Europe, North America) | Long term (≥ 4 years) |
| Low manufacturing costs are widening access | +0.9% | Global (highest in emerging markets) | Medium term (2–4 years) |
| E-commerce-led DTC models | +0.7% | Global (peak in North America, Europe) | Medium term (2–4 years) |
| Source: Mordor Intelligence | |||
Rapid Urbanization Drives Space-Saving Solutions
Rapid urbanization is shrinking living space in many cities, especially across the Asia-Pacific region. Currently, India's urban population stands at approximately 410 million, accounting for 32% of the nation's total. Projections indicate this figure will surge to 814 million, constituting 50% of the population, by 2050 [1]. As apartments become smaller, residents gravitate toward furniture that serves more than one purpose—pieces that fold, stack, or hide storage inside. Designers are responding with modular plastic units that help households reclaim every inch of floor area. By 2030, when 60% of the world’s population is expected to live in urban settings, adaptable furniture will likely be a standard feature in compact homes.
Outdoor Living Spaces Expand Applications
More households and businesses now treat patios, rooftops, and hotel decks as everyday living areas. Plastic furniture suits these settings because it shrugs off rain, sun, and salt while asking little of owners beyond an occasional wipe-down. Designers highlight recycled plastics in their 2025 collections, pairing modular layouts that can move or grow with changing needs. Many new pieces even hide smart touches such as built-in speakers or USB ports, turning an ordinary lounge chair into a mini-entertainment hub. Warm climates keep outdoor areas in use all year, so factories can plan steadier production instead of racing to meet a single summer spike.
Eco-Friendly Materials Transform Product Development
Environmental awareness is rewriting the recipe for plastic furniture. Vitra’s choice to make the Eames Plastic Chair from post-consumer polypropylene shows that style icons can cut carbon emissions in half without losing their look. Polywood goes further by grinding up roughly 400,000 used milk jugs every day and molding them into deck chairs that carry a premium price because buyers trust the closed-loop story. Brands that lock in steady streams of recycled resin shield themselves from volatile virgin-plastic costs and earn loyalty from shoppers who are happy to pay more for clear proof of responsibility.
Direct-to-Consumer Models Reshape Distribution Economics
Online stores now connect factories straight to living rooms, bypassing wholesalers and showroom rents. Plastic furniture travels well in flat-pack cartons, so shipping fees stay low and damage rates fall. Virtual showrooms let shoppers spin a sofa in 3D or drop a chair into a phone camera view of their balcony, cutting return headaches. Because every molded piece looks the same as its photo, buyers feel safer ordering sight-unseen. Direct-to-consumer sales, therefore, grow faster than any store channel and reward brands that invest in digital service rather than shelf space.
Restraints Impact Analysis of Plastic Furniture Market*
| Restraints | (~) % Impact on CAGR Forecast | Geographic Relevance | Impact Timeline |
|---|---|---|---|
| Microplastic emission regulations | -0.7% | Europe, North America, global rollout pending | Medium term (2–4 years) |
| Low heat-resistance of conventional plastics | -0.5% | Global (most acute in luxury markets) | Short term (≤ 2 years) |
| Source: Mordor Intelligence | |||
Microplastic Regulations Create Compliance Challenges
Scientists now trace tiny plastic particles in rivers back to the slow breakdown of outdoor chairs and tables. A 2024 report from the International Joint Commission singled out furniture as an overlooked contributor International Joint Commission. Policymakers in Brussels and Washington respond with proposals that would force manufacturers to test, label, and sometimes redesign products. Meeting these rules means extra lab work and new coatings, costs that weigh heaviest on small producers [2].
Material Performance Limitations Constrain Expansion
Plastic still struggles where heat is part of daily use. Standard polypropylene starts to soften around 100 °C, so high-end dining tables often stay wood or metal despite higher emissions profiles. Reinforced composites raise heat tolerance but add triple-digit cost premiums that only niche buyers accept today. Until prices fall, this barrier tempers the plastic furniture market’s share gains in upscale indoor segments.
*Our forecasts treat driver/restraint impacts as directional, not additive. The impact forecasts reflect baseline growth, mix effects, and variable interactions.
Plastic Furniture Market Segment Analysis
By Product:
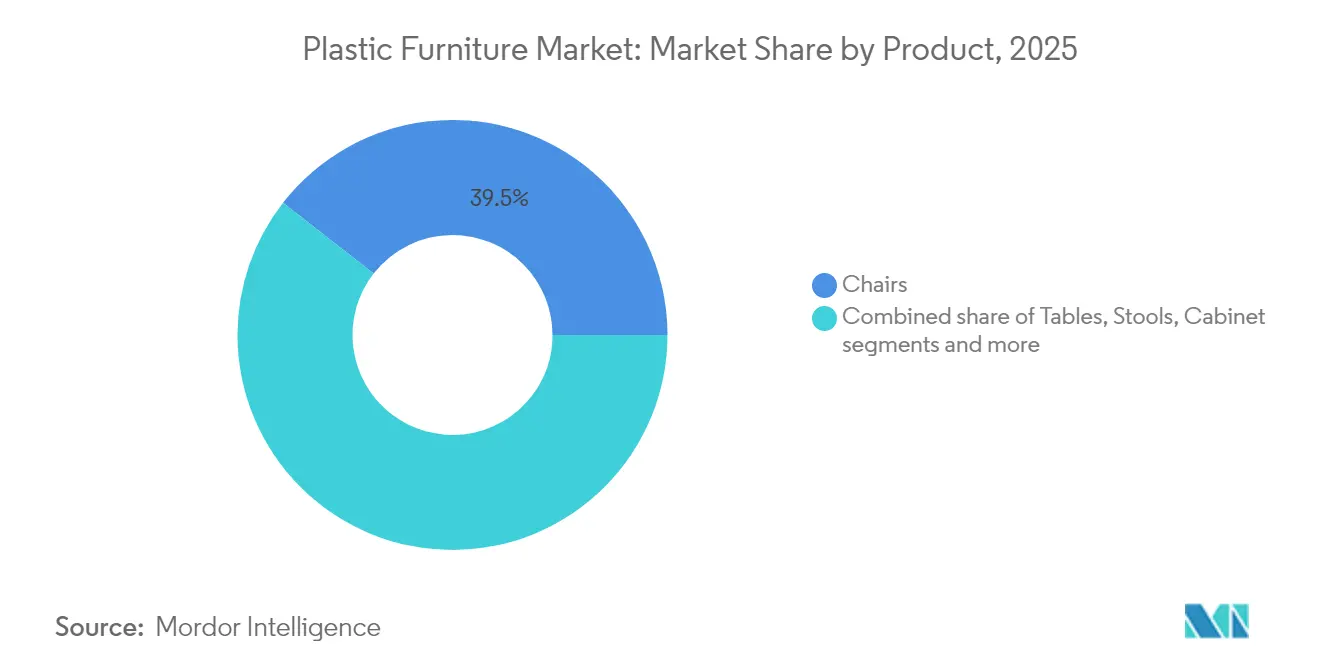
Chairs Lead While Cabinets Gain MomentumChairs retained 39.45% of the plastic furniture market share in 2025 by serving residential, hospitality, and institutional needs with ergonomic updates that satisfy office-health guidelines. The segment’s stable costs and broad style palette support steady volume growth. Meanwhile, cabinets headline the fastest expansion at a 5.12% CAGR to 2031, as city dwellers seek modular storage to counter shrinking closets.
Tables, stools, and sofas continue to round out portfolios, but momentum clearly tilts toward space-saving storage lines. Vitra’s switch to recycled polypropylene in its iconic shell chair cut product carbon intensity by more than 50%, inspiring rival brands to re-engineer legacy SKUs around reclaimed feedstock. Recent material breakthroughs help broaden product scope. Glass-fiber infusions lift load capacity, enabling three-seat plastic couches that meet residential durability norms. Gas-assisted molding yields sculptural coffee tables with seamless cores, blurring functional and aesthetic boundaries. These shifts re-position plastic from strictly utilitarian to design-forward, moving the plastic furniture market toward higher price-point opportunities.

By End User:
Residential Dominance Amid Commercial GrowthResidential buyers controlled 59.30% of 2025 sales thanks to cost, color variety, and low upkeep. Outdoor decks, balconies, and small dining corners remain prime destinations for synthetic materials that shrug off rain and sun. The commercial segment is forecast to post a 5.39% CAGR through 2031, driven by hotels and quick-service restaurants that value stackability and antibacterial coatings.
Offices, hotels, and schools are rethinking how they use space, so they now want furniture that moves and adapts as quickly as their floor plans. Lightweight plastic panels and clip-together seating let a conference room flip into a training hall before lunch. Buyers also look for greener inputs, ergonomic shapes, and built-in tech such as cable ports. Hotels have turned to plastic sets for pool decks and budget guest rooms because they wash clean with a hose and resist salt or sun fade. Schools follow the same logic: stackable chairs survive daily knocks and wipe down in minutes, keeping maintenance costs low.
By Price Range:
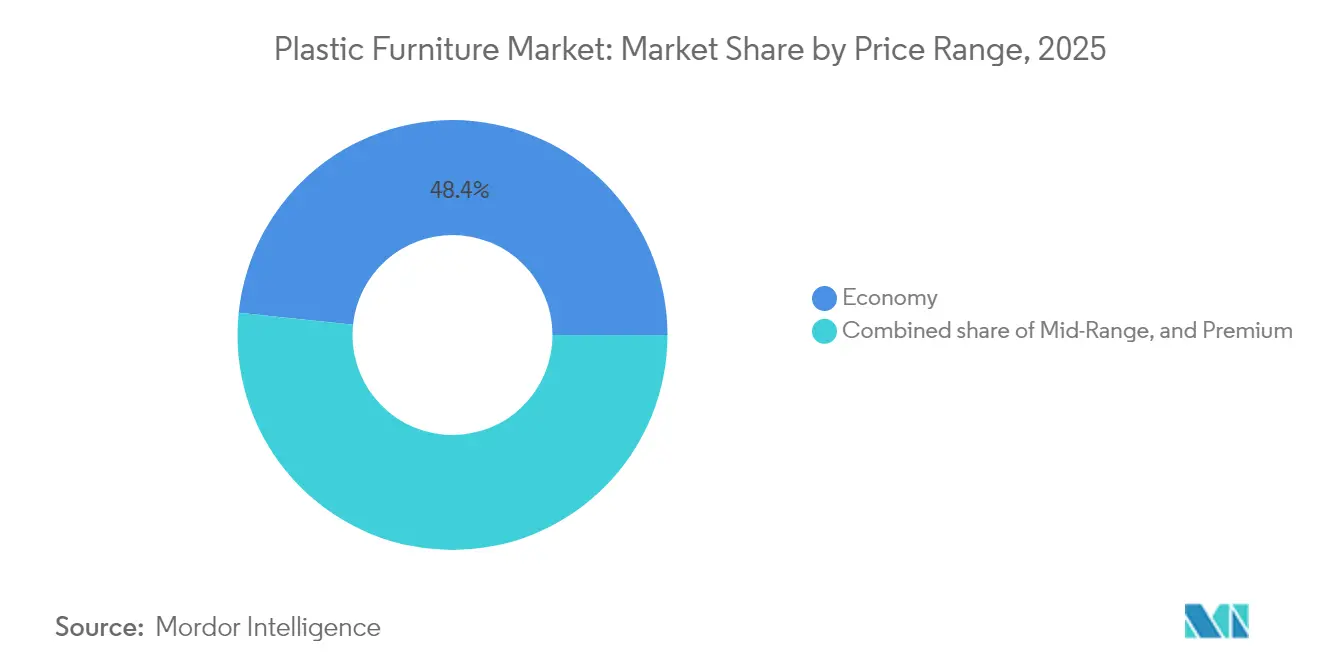
Economy Segment Leads While Premium Grows FastestEconomy lines captured 48.35% of 2025 sales, whereas the premium band, including reinforced composites and designer collaborations, is rising at a 5.67% CAGR through 2031. Consumers increasingly pay 15-25% above mid-market tags for recycled or biodegradable content, lifting gross margins and funding R&D.
Mid-range offerings blur the cost-value gap by adopting gas-assist finishes and advanced pigments that mimic natural textures while staying price-competitive. Brand portfolios now span economy to premium within common mold platforms, simplifying tooling yet diversifying retail positioning. The resulting laddered assortment aligns with widening household income tiers across emerging Asia-Pacific and Latin America, sustaining momentum for the plastic furniture market.
By Distribution Channel:
Online Retail Disrupts Traditional ModelsB2C/retail channels still account for 61.10% of global turnover, but within that slice, online retail grows at a 6.08% CAGR as virtual showrooms border on mainstream. Home centers benefit from immediate take-home convenience, although market share erodes as mobile-first shoppers secure free shipping and easy returns. Specialty stores remain relevant in the premium tier, where tactile assessment underpins buying confidence.
The B2B/project lane caters to large-volume rollouts in education and hospitality. Yet here too, digitalization gains ground, with configurators enabling architects to download BIM objects and order factory-pre-assembled sets in one click. Rural Handmade reports AR visualization tools cutting return rates by nearly one-third, tipping both consumers and specifiers toward e-commerce checkouts. Lightweight plastics, consistent color bans, and minimal part counts enhance the online fit, reinforcing the channel shift within the plastic furniture market.
Geography Analysis
North America Plastic Furniture Market
North America anchored 34.70% of global revenue in 2025, sustained by robust consumer spending, a mature DIY culture, and growing interest in recycled resin products. United States homeowners drive spring-season spikes as landscaping projects fold patio upgrades into mortgage refinancing budgets. Canada follows a seasonal rhythm, while Mexico emerges as a growth pocket on the back of rising homeownership and mall expansions that stock affordable plastic SKUs. Environmental regulation is tightening, with several U.S. states debating minimum recycled content mandates, pushing producers toward closed-loop resin contracts.
APAC Plastic Furniture Market
Asia-Pacific represents the fastest trajectory, advancing at a 5.88% CAGR from 2026-2031. China champions supply depth and rising domestic demand for cost-efficient décor. India trails closely, buoyed by a growing middle class that favors versatile furniture for compact flats. Southeast Asia’s dual-speed picture shows Singapore and Malaysia leaning premium, whereas Indonesia and Vietnam pack volume in the economy tier. Tropical climates enable year-round patio usage, smoothing seasonal swings and offering continuous shelf velocity for outdoor sets, thereby enlarging the plastic furniture market.
Europe Plastic Furniture Market
Europe balances premium design with stringent eco rules. The United Kingdom and Germany spearhead recycled-plastic certification, while Spain and Italy emphasize alfresco dining sets to suit Mediterranean lifestyles. Eastern Europe supplies incremental upside as incomes swell and e-commerce infrastructure matures. Rethink Plastic Alliance notes that 64% of European furniture buyers now request transparent lifecycle disclosures, making environmental footprints a central brand metric. Digital channels grow twice as fast as brick-and-mortar for plastic furniture, capitalizing on efficient parcel networks and consumer confidence in return policies.

Regulatory Landscape
Plastic furniture producers operate under a tightening mix of product-safety, chemicals, and trade rules, with traceable, recycled-content polymers increasingly preferred and added compliance costs hitting low-margin SKUs. In the United States, the STURDY Act requirements for clothing storage units, tied to ASTM F2057-23, moved into mandatory implementation in 2026, increasing testing and documentation expectations for polymer-based storage products sold through retail and e-commerce channels.
In Europe, amendments to the EU plastics framework for materials and articles (notably updates linked to Regulation (EU) No 10/2011) reinforce purity, traceability, and compliance recordkeeping, with transition timelines extending into 2026 for legacy-compliant materials. Cross-border cost structures also changed with U.S.-EU trade actions around the August 2025 framework and subsequent HTS modifications implemented in September 2025, increasing the need for manufacturers and importers to manage tariff exposure and sourcing routes for home-and-garden assortments that sit near plastic furniture retail baskets.
Value Chain Analysis
The value chain begins with resin and additives from a concentrated set of petrochemical producers, followed by compounders and converters that tailor blends (including recycled content) for durability, UV resistance, and color consistency. Downstream manufacturing is fragmented, with thousands of firms running injection molding, extrusion, and finishing (texturing, coating, assembly, packaging). Export-oriented outdoor categories depend on industrial supply corridors, with China remaining a dominant hub and Zhejiang cited as a major exporter supported by centralized raw-material procurement and proximity to ports such as Ningbo and Shanghai.
Distribution covers B2C retail (home centers, specialty, and online) and B2B/project channels serving hospitality, education, and municipal buyers. Circular feedstock strategies and regional capability build-outs are shaping the chain: recyclers and captive recycling lines supply PCR pellets, while European production networks are being strengthened through acquisitions that add injection-molding and polyurethane capabilities. Because outdoor sets drive seasonal demand, logistics lead times and inventory planning become decisive, pushing manufacturers to secure resin earlier in the procurement cycle and to use flat-pack, low-damage packaging suited to parcel networks.
Competitive Landscape
The plastic furniture market remains moderately fragmented: global names such as IKEA, Keter Group, and Rubbermaid coexist with regional specialists that tailor catalogs to local tastes and climate. Sustainability is the new battleground. IKEA targets a 70% cut in transport emissions and an 80% absolute logistics reduction by 2040, influencing upstream freight choices and prompting suppliers to adopt rail or biofuel shipping options. Several players integrate backward by contracting plastic recyclers, ensuring long-term feedstock and price stability.
Design innovation offers differentiation for mid-sized firms. ScanCom International’s DuraPlast pairs virgin and reclaimed polymers in weather-resistant lounge sets, extending warranty periods and opening new hospitality accounts. Technology further reshapes rivalry: brands embed NFC chips in chair frames to authenticate recycled content claims, while logistics platforms optimize last-mile routes to curb costs and emissions.
Market entrants leverage DTC channels; low tool-up costs and cloud-based storefronts let them challenge incumbents without vast capital. However, meeting upcoming microplastic limits will steepen compliance hurdles, likely prompting consolidation as smaller outfits license patented resins from larger peers. Overall, pricing power rests with firms that mix design pedigree, recycling capacity, and agile distribution within the plastic furniture market.
Plastic Furniture Industry Leaders
-
Keter Group
-
Nilkamal Limited
-
Supreme Industries Limited
-
Tramontina
-
Cosmoplast Industrial Company
- *Disclaimer: Major Players sorted in no particular order
Plastic Furniture Market Companies Covered in this Report
- Keter Group
- Nilkamal Ltd
- Cello World
- Avro India Ltd
- Supreme Industries
- Ashley Furniture Industries
- Walmart Inc. (Mainstays)
- ScanCom International A/S
- Cosmoplast Industrial Co. LLC
- Grosfillex SAS
- Poly-Wood LLC
- C.R. Plastic Products Inc.
- Herman Miller Inc. (MillerKnoll)
- Palram Industries Ltd
- Tramontina S.A.
- Rubbermaid Commercial Products LLC
- Step2 Company LLC
- Qingdao Huanghai Furniture Co., Ltd
- Resol Group
- IKEA
- UMA Plastics Limited
- Vitra International AG
Market Opportunities and Future Outlook
Material innovation and circular feedstock integration are expanding opportunities beyond commodity patio chairs, especially in durable outdoor and contract categories where buyers prioritize low maintenance, UV stability, and verifiable recycled content. In India, recycling-led backward integration is particularly visible: Avro India commenced commercial production at a rigid plastic recycling facility in Ghaziabad in January 2026, complementing flexible-waste operations and supporting a reported combined recycling throughput of about 2,000 MTPM as of March 2026. This kind of captive or partnered recycling improves access to post-consumer resin and supports labeled sustainability claims that fit tightening procurement and disclosure expectations.
R&D programs and new composite routes also widen applications where conventional plastics struggle on performance. In April 2026, research highlighted artificial rattan furniture material using PolyAl (from post-consumer beverage cartons) blended with recycled plastic composites, pointing to an upcycling pathway for hard-to-recycle streams that can support premium outdoor aesthetics. In Europe, Plastics Europe published a circular-economy analysis in May 2026 that formalizes how progress is measured, while the Circular Bio-based Europe Joint Undertaking launched the SUPREME-PILOTS project (June 2026 to May 2030) to develop high-performance bio-based copolymers via reactive extrusion, relevant for urban furniture and other durable-use segments that need stronger mechanical and weathering properties.
Recent Industry Developments in Plastic Furniture Market
- June 2026: Keter Group introduced next-generation outdoor living innovations at spoga+gafa 2026, adding categories such as outdoor flooring, wall cladding, solar lighting, outdoor kitchens, and a modular garden-room concept (My Studio). The broadened assortment shifts Keter further into integrated outdoor-living systems, lifting cross-sell potential for plastic-based components and raising the bar for design-led differentiation in retail channels.
- April 2026: Supreme Industries Limited announced a capital expenditure commitment exceeding INR 1,000 crore for FY27 to add around 110,000 metric tonnes of annual capacity, alongside major greenfield projects including facilities in Patna, Jammu, and Gadegaon. Larger domestic capacity and a broader manufacturing footprint improve supply reliability for polymer-based home and building product lines that share resin sourcing, processing capability, and distribution infrastructure with plastic furniture.
- January 2024: Vitra completed its transition to producing the Eames Plastic Chair using post-consumer recycled polypropylene. Moving an iconic design line to PCR content validated recycled polymers in premium positioning and reinforced the market shift toward documented circular-material claims in higher price tiers.
Plastic Furniture Market Report Scope and Research Methodology
Market Definition and Coverage
This market is measured as the value of new, finished plastic furniture that is mainly made from polymer resins and sold for indoor or outdoor use through retail and contract channels.
Scope exclusions: Items where the main structure is metal, wood, or rattan and plastic is only used as trims or small parts are not counted.
Segments Covered in This Report
- By Product
- Chairs
- Tables
- Stools
- Cabinets
- Sofas
- Shelves
- Other Products
- By End User
- Residential
- Commercial
- By Price Range
- Economy
- Mid-Range
- Premium
- By Distribution Channel
- B2C/Retail
- Home Centers
- Specialty Furniture Stores
- Online
- Other Distribution Channels
- B2B /Project
- B2C/Retail
- By Geography
- North America
- Canada
- United States
- Mexico
- South America
- Brazil
- Peru
- Chile
- Argentina
- Rest of South America
- Europe
- United Kingdom
- Germany
- France
- Spain
- Italy
- BENELUX (Belgium, Netherlands, and Luxembourg)
- NORDICS (Denmark, Finland, Iceland, Norway, and Sweden)
- Rest of Europe
- Asia-Pacific
- India
- China
- Japan
- Australia
- South Korea
- South East Asia (Singapore, Malaysia, Thailand, Indonesia, Vietnam, and Philippines)
- Rest of Asia-Pacific
- Middle East And Africa
- United Arab of Emirates
- Saudi Arabia
- South Africa
- Nigeria
- Rest of Middle East And Africa
- North America
Data Sources, Market Sizing, and Validation
Desk Research
Desk research sets the boundaries for what should be counted as plastic furniture and provides the core demand and supply signals. We rely on public sources such as UN Comtrade trade statistics, national statistical offices for manufacturing and household spending, and the World Bank for macro indicators linked to housing and income changes.
To track materials and pricing direction, we also review public references on resin and polymer markets, plus regulatory and standards updates that affect plastic use and recycling (for example, government environment agencies and standards bodies). Company filings, investor decks, and reputable press coverage are used to cross-check capacity moves, channel shifts, and product positioning for indoor versus outdoor use. In selected cases, paid subscriptions for company financials and patent databases are used to validate company exposure and product activity. These examples are not exhaustive, and many other sources were also reviewed for data collection, validation, and clarification.
Primary Interviews and Surveys
Primary work is used to pressure-test desk-based assumptions and fill gaps that public data does not show clearly, including channel mix, typical pricing ranges, and how recycled content is being adopted. We speak with executives, functional leaders, and managers across manufacturers, distributors, and large buyers, and coverage is balanced across major regions so regional pricing differences and seasonal demand do not get averaged out.
Distribution of primary research fieldwork respondents
| Company type | Respondent position | Region |
|---|---|---|
| Top tier: 38% | CXOs: 12% | APAC: 49% |
| Mid tier: 41% | Functional/Unit leaders: 30% | EMEA: 32% |
| Smaller Players: 21% | Managers: 58% | Americas: 19% |
Market-Sizing & Forecasting
The sizing starts with a top-down reconstruction that links furniture output and cross-border trade flows to the addressable plastic furniture value pool, then it is adjusted by region to reflect local consumption strength. We corroborate the totals using selective bottom-up checks, such as sampled average selling prices by product group times estimated units, plus channel checks on retail versus contract share.
In this market, several inputs influence the value build directly, especially polymer resin price direction (which shifts finished furniture pricing), housing completions and household formation (which drive replacement and first-time purchases), outdoor leisure and hospitality activity (which supports patio and commercial demand), e-commerce penetration in furniture (which changes price points and mix), and recycled content and waste rules (which can affect costs and product availability). When data is thin for smaller countries, we bridge gaps using proxy indicators like import dependence, urban population growth, and distributor feedback, before rolling totals into the final regional figures.
For forecasting, we use scenario analysis where demand and pricing paths are linked to expected housing and consumption trends, and the assumptions are reviewed with primary respondents to keep them realistic. This reduces the risk of using one straight-line growth curve when resin costs or channel mix shift.
Data Validation & Update Cycle
Validation is done through multiple checks so results do not depend on a single dataset. We compare the model output against independent signals such as trade values, production trend lines, and observed price movements, and any large variance is flagged for a re-check of definitions and conversion factors.
Before sign-off, a second analyst reviews the calculations, and unusual country or regional jumps are traced back to a clear driver like a price spike, a policy change, or a one-off trade swing. The report is refreshed annually, and if a material event occurs, the key assumptions are revisited and updated so the numbers stay aligned with the latest market conditions. Before delivery, a final pass is done so clients receive the most current view available.
Mordor Intelligence's Plastic Furniture Market Size Versus Other Published Estimates
Published market sizes for plastic furniture can differ even when the topic name looks the same, because each publisher draws the line on what products to include and which year to anchor as the current value. Differences also show up when pricing logic is handled differently, especially in a market sensitive to resin costs and channel mix.
By tracking resin-linked price movements and re-checking retail versus contract channel shares, Mordor Intelligence keeps the estimate focused on finished plastic furniture only, instead of mixing in adjacent furniture materials or broader plastic components that can inflate totals. Some sources use an earlier base year and then apply uniform growth, which can miss recent shifts in e-commerce pricing and recycled-content adoption that vary by region.
Benchmark comparison
| Source | Market Size | Gaps in Research Methodology |
|---|---|---|
| Mordor Intelligence | USD 17.56 B (2026) | |
| Industry Publisher A | USD 16.60 B (2025) | Uses a different base year and a longer forecast window, and the public summary does not clarify the exact inclusion boundary between finished plastic furniture and mixed-material furniture lines. |
| Catalog Aggregator B | USD 13.29 B (2025) | Limited definition detail is provided in the public extract, and the lower value can come from narrower channel coverage or different treatment of contract and commercial demand. |
The spread across sources mainly comes from base-year selection and how tightly the product boundary is controlled, followed by how pricing is carried forward when resin costs change. Our approach stays repeatable because the key drivers and checks are explicit, which makes it easier for buyers to trace what is counted and why the total moves year to year.
Key Questions Answered in the Report
What is the current value of the plastic furniture market?
The market is worth USD 17.56 billion in 2026 and is projected to reach USD 21.88 billion by 2031.
Which region grows fastest in plastic furniture sales?
Asia-Pacific leads with a 5.88% CAGR forecast for 2026-2031, propelled by rapid urbanization and a rising middle class.
Why are cabinets the quickest-growing product category?
Urban space constraints drive demand for modular storage, giving cabinets a 5.12% CAGR outlook through 2031.
How does e-commerce influence the plastic furniture market?
Online retail in B2C channels is advancing at a 6.08% CAGR as AR tools cut return rates and flat-pack plastics reduce shipping costs.
What sustainability trends shape product development?
Manufacturers increasingly use recycled polymers and closed-loop systems, enabling price premiums of 15-25% and better regulatory compliance.
Which price segment expands fastest?
The premium tier grows at 5.67% CAGR through 2031, thanks to design upgrades and consumer preference for eco-friendly materials.