
Market Overview
| Study Period | 2021 - 2031 |
|---|---|
| Market Size (2026) | USD 95.07 Billion |
| Market Size (2031) | USD 166.43 Billion |
| Growth Rate (2026 - 2031) | 11.85 % |
| Fastest Growing Market | Middle East and Africa |
| Largest Market | Asia Pacific |
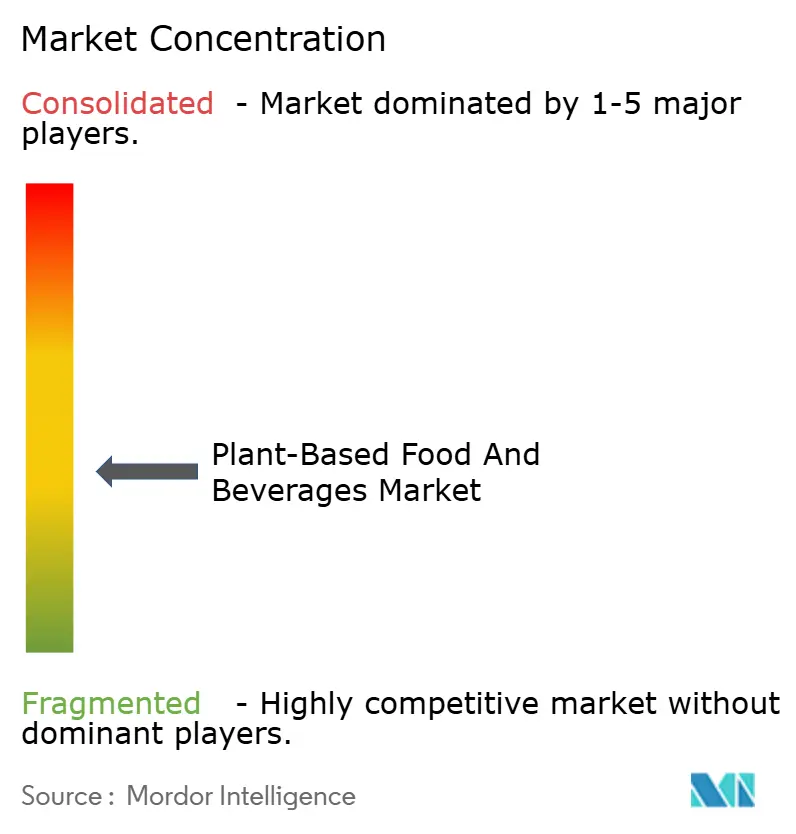
| Market Concentration | Medium |
Major Players *Disclaimer: Major Players sorted in no particular order Image © Mordor Intelligence. Reuse requires attribution under CC BY 4.0. | |
Plant-Based Food And Beverages Market Analysis by Mordor Intelligence
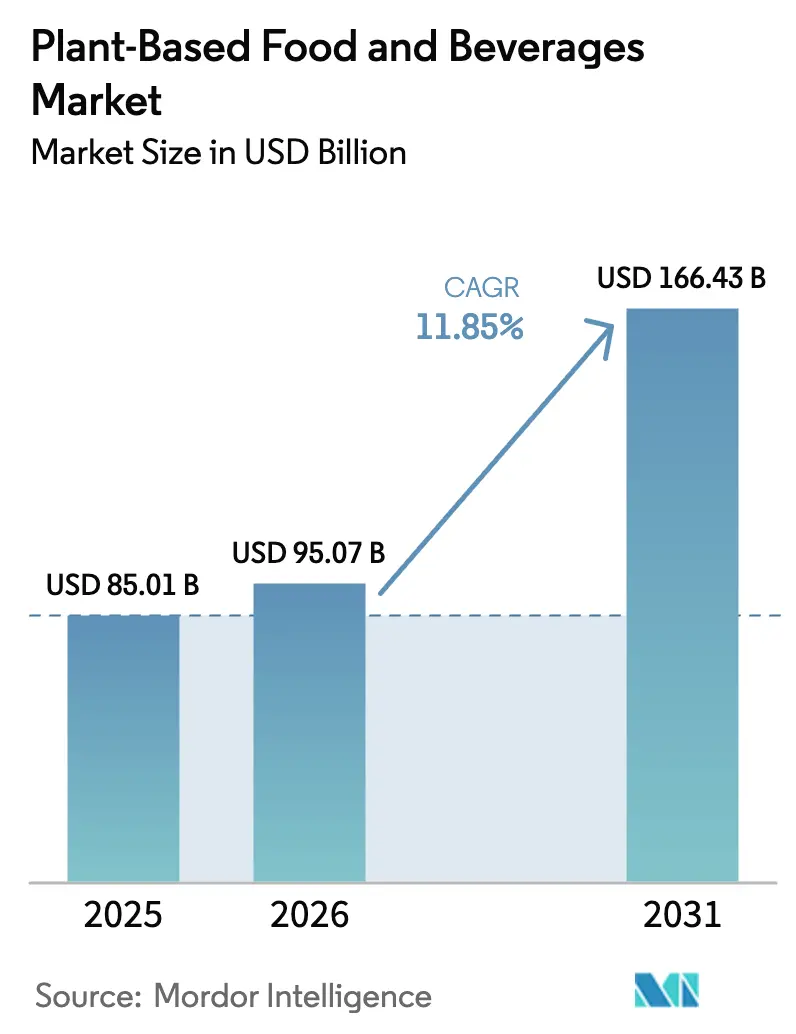
The plant-based food and beverages market size is projected to expand from USD 85.01 billion in 2025 and USD 95.07 billion in 2026 to USD 166.43 billion by 2031, registering a CAGR of 11.85% between 2026 to 2031. The growing adoption of flexitarian diets in North America and Europe is significantly driving market growth. In the Asia-Pacific region, the increasing prevalence of lactose intolerance is boosting demand for plant-based alternatives. The Gulf states are witnessing a surge in halal-certified product launches, further contributing to market expansion. Innovations in ingredients, such as precision-fermented heme and barista-grade oat emulsions, are improving taste profiles, encouraging repeat purchases. Supermarkets are reorganizing shelves to place plant-based products alongside conventional dairy and meat, making them more accessible to consumers. Furthermore, quick-service restaurant chains are reintroducing plant-based options, creating more opportunities for consumers to try these products. The market remains fragmented.
Key Report Takeaways
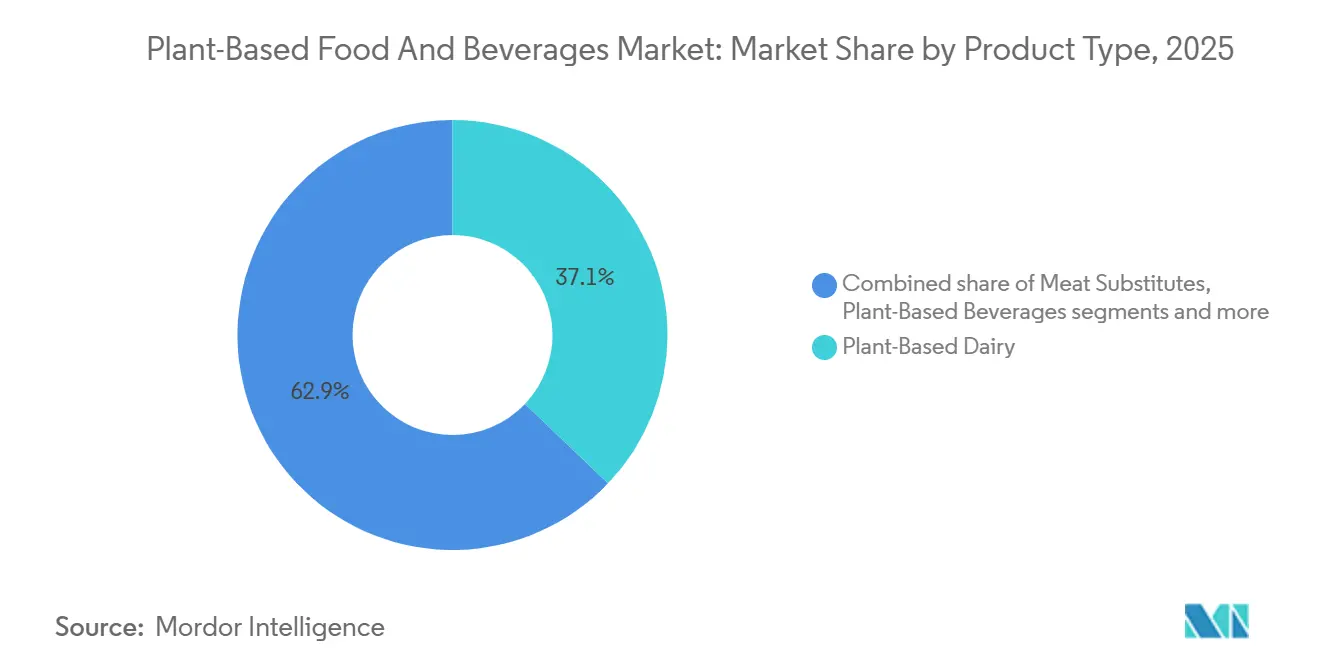
- By product type, plant-based dairy led with 37.12% revenue share in 2025; meat substitutes are projected to expand at a 12.61% CAGR through 2031.
- By ingredient source, soy accounted for 39.55% of 2025 revenue, whereas oat is set to grow at a 13.03% CAGR through 2031.
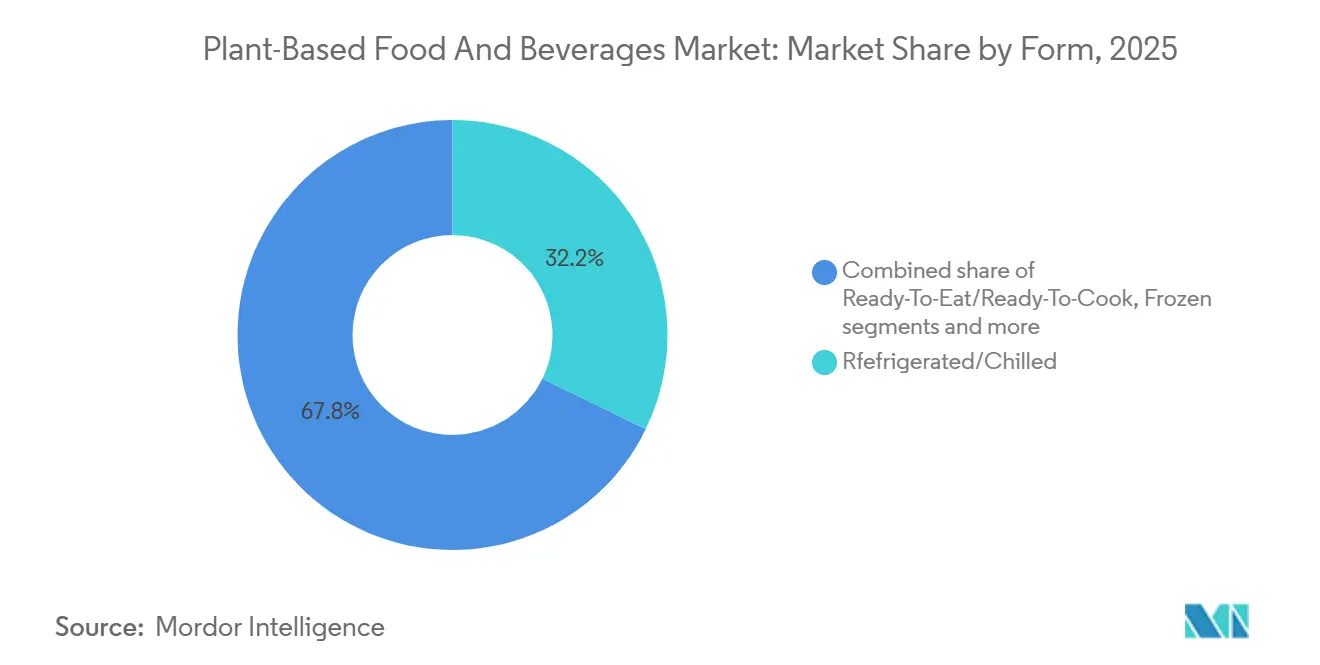
- By form, refrigerated and chilled items accounted for 32.21% of 2025 sales, yet ready-to-eat and ready-to-cook formats are forecast to grow at a 13.46% CAGR through 2031.
- By distribution channel, off-trade accounted for 71.82% of 2025 revenue, while on-trade is expected to rise at a 13.13% CAGR to 2031.
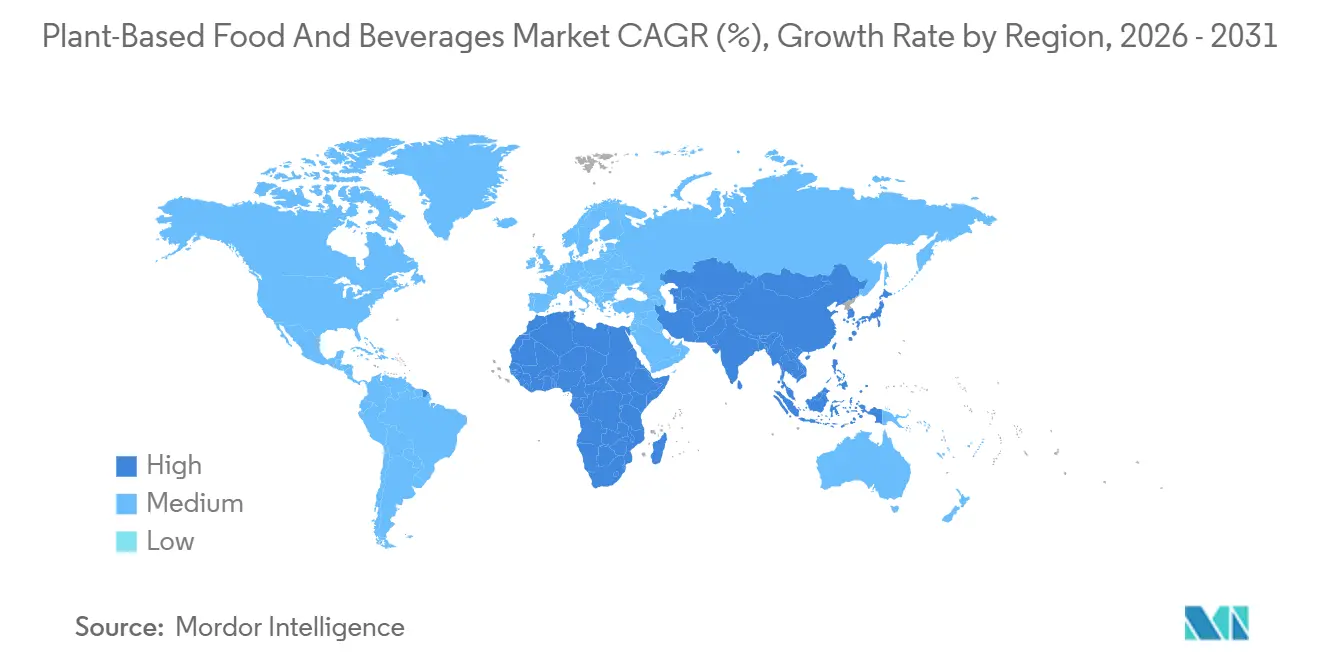
- By geography, Asia-Pacific held 35.84% of the 2025 turnover; the Middle East and Africa are poised for the fastest 12.05% CAGR to 2031.
Note: Market size and forecast figures in this report are generated using Mordor Intelligence’s proprietary estimation framework, updated with the latest available data and insights as of 2026.
Market Trends and Insights
Drivers Impact Analysis of Plant-Based Food And Beverages Market*
| Driver | (~) % Impact on CAGR Forecast | Geographic Relevance | Impact Timeline |
|---|---|---|---|
| Expansion of flexitarian and vegetarian lifestyles | +2.8% | Global, with highest penetration in North America and Europe | Medium term (2-4 years) |
| Increasing prevalence of lactose intolerance and food allergies | +2.1% | Asia-Pacific core (68% population lactose intolerant), spill-over to global markets | Long term (≥ 4 years) |
| Rising ethical concerns related to animal welfare supporting long-term adoption | +1.6% | North America, Europe, Australia | Long term (≥ 4 years) |
| Continuous innovation in plant-based formulations improving taste, texture, and nutritional profiles | +2.4% | Global, led by Research and Development hubs in North America and Europe | Short term (≤ 2 years) |
| Growing awareness of environmental impact of animal agriculture | +1.9% | Europe, North America, with emerging awareness in Asia-Pacific | Medium term (2-4 years) |
| Consumer focus on health and wellness increasing demand for foods perceived as lower in cholesterol, saturated fat, and artificial ingredients | +2.2% | Global, strongest in high-income markets | Medium term (2-4 years) |
| Source: Mordor Intelligence | |||
Expansion of flexitarian and vegetarian lifestyles
The rise in flexitarian and vegetarian lifestyles has become a key driver of the plant-based food and beverage market. More consumers are now choosing to include plant-based options in their daily diets without completely giving up meat. In 2024, ProVeg International reported that approximately 40% of Europe’s population identified as flexitarian, highlighting a growing trend of reduced meat consumption[1]. This shift has pushed retailers and foodservice providers to broaden their plant-based product offerings, integrating them into mainstream categories rather than restricting them to niche sections. For example, well-known quick-service restaurant chains and retail brands have begun adding permanent plant-based menu items and expanding their product ranges to meet this changing demand. Increasing consumer awareness about health benefits, environmental sustainability, and the need for dietary variety continues to fuel the growth of plant-based food and beverage consumption worldwide.
Increasing prevalence of lactose intolerance and food allergies
The increasing prevalence of lactose intolerance and food allergies is a major driver of the global plant-based food and beverage market. In 2025, data from the World Population Review showed that some countries, including the Democratic Republic of Congo, Vietnam, South Korea, Yemen, and Mozambique, reported lactose intolerance rates of up to 100%[2]. This highlights a significant demand for dairy-free alternatives. Plant-based beverages like oat milk, almond milk, and soy milk have become popular choices as they provide similar functionality to dairy products without causing digestive issues. To meet this growing demand, manufacturers are developing fortified, allergen-friendly products to cater to consumers with dietary sensitivities. Increasing health awareness and the rising preference for dairy alternatives are further boosting the adoption of plant-based food and beverages worldwide.
Rising ethical concerns related to animal welfare are supporting long-term adoption
Concerns about animal welfare are becoming a major driver of the plant-based food and beverage market. Many consumers are now actively seeking cruelty-free food options that align with their ethical beliefs. The American Humane Farm Survey 2024 found that 72% of respondents are worried about the treatment of animals on farms, showing a clear demand for more humane and ethical practices in food production[3]. This growing awareness has led to a noticeable shift toward plant-based alternatives, as these products do not involve animal exploitation and are considered more ethical. In response to this trend, retailers and food manufacturers are increasing their focus on plant-based product offerings. They are introducing a wider range of options to cater to consumers who prioritize animal welfare and ethical considerations in their purchasing decisions.
Continuous innovation in plant-based formulations is improving taste, texture, and nutritional profiles
Advancements in product formulation are playing a key role in improving the taste and texture of plant-based food and beverages, making them more appealing to consumers. A 2025 blind tasting conducted by the NECTAR consortium found that only about one-third of plant-based alternatives matched the taste and texture of traditional animal-based products. This finding underscores the need for continuous research and development in the sector. Companies like Impossible Foods are using innovative techniques, such as precision fermentation, to create heme and casein analogs. These ingredients help mimic the savory umami flavor and melting properties found in animal-based foods. Additionally, improvements in texturized vegetable protein technology now enable the creation of fibrous, whole-muscle alternatives for a variety of applications beyond plant-based burgers.
Restraints Impact Analysis of Plant-Based Food And Beverages Market*
| Restraint | (~) % Impact on CAGR Forecast | Geographic Relevance | Impact Timeline |
|---|---|---|---|
| Limited consumer awareness and understanding of plant-based nutrition | -1.4% | Emerging markets in Asia-Pacific, Middle East and Africa, and Latin America | Medium term (2-4 years) |
| Rising incidence of soy, nut, and gluten allergies limiting consumer adoption | -1.2% | Global, with highest impact in North America and Europe | Long term (≥ 4 years) |
| Higher prices of plant-based products compared to conventional animal-based alternatives | -2.1% | Global, most acute in price-sensitive emerging markets | Short term (≤ 2 years) |
| Regulatory ambiguity around labeling terms such as milk, cheese, and meat | -0.9% | North America, Europe, with emerging debates in Asia-Pacific | Medium term (2-4 years) |
| Source: Mordor Intelligence | |||
Limited consumer awareness and understanding of plant-based nutrition
Low consumer awareness of plant-based nutrition remains a major challenge, especially in emerging markets, where these products are often seen as foreign or Western imports rather than natural extensions of traditional protein sources like lentils, chickpeas, or tofu. Many consumers still hold misconceptions about the protein quality and completeness of plant-based diets, even though the Academy of Nutrition and Dietetics confirmed in 2024 that well-planned plant-based diets can provide all essential nutrients for people at every stage of life. Furthermore, plant-based products are often placed in premium or specialty health sections in stores, which reinforces the idea that they are niche or luxury items rather than everyday food options. This perception limits their appeal to the broader market. Efforts such as placing plant-based products alongside conventional items on shelves and using QR codes to educate consumers about their nutritional benefits are helping to address these issues.
Rising incidence of soy, nut, and gluten allergies limits consumer adoption
The increasing number of allergies to common plant-based ingredients, such as soy and tree nuts, is creating challenges for the plant-based food and beverages market. These allergies make it difficult for sensitive consumers to access certain products and reduce their trust in using plant-based options as regular substitutes for traditional foods. Although alternatives like oat- and rice-based products are gaining popularity as safer options, they often have lower protein content, which limits their appeal in segments such as sports nutrition and pediatric diets, where higher protein intake is essential. Furthermore, producing allergen-free products requires specialized manufacturing processes and strict labeling, which increases costs and operational challenges, especially for smaller companies. Retailers also tend to focus on stocking high-demand products, which can result in fewer allergen-free options being available on shelves.
*Our forecasts treat driver/restraint impacts as directional, not additive. The impact forecasts reflect baseline growth, mix effects, and variable interactions.
Plant-Based Food And Beverages Market Segment Analysis
By Product Type:
Dairy Still Dominates RevenueIn 2025, plant-based dairy products contributed 37.12% of the plant-based food and beverages market revenue, making it the largest segment. The growing demand for alternatives to traditional dairy products is driven by factors such as lactose intolerance, the rise in vegan lifestyles, and increasing environmental awareness. Products such as plant-based milk, yogurt, cheese, and creamers have become popular among consumers, both in retail stores and in foodservice outlets. Companies are focusing on improving the taste and quality of these products while ensuring they are widely available in supermarkets. This segment continues to thrive due to its loyal consumer base and the frequent use of plant-based dairy in daily diets.
The meat substitutes segment is expected to grow at a CAGR of 12.61% from 2026 to 2031, reflecting the increasing shift toward plant-based protein options. Consumers are becoming more aware of health benefits, sustainability issues, and animal welfare, which is driving the demand for plant-based meat products. Manufacturers are using advanced technologies to enhance the texture, flavor, and nutritional content of these products, making them more appealing to a broader audience. Additionally, the availability of plant-based meat in quick-service restaurants and packaged food categories is expanding its reach. As global acceptance grows, this segment is poised to become one of the fastest-growing areas in the plant-based food and beverages market.

By Ingredient Source:
Soy Leads but Oat AcceleratesSoy is expected to account for 39.55% of the plant-based food and beverages market revenue by ingredient source in 2025, maintaining its dominance as a key raw material. This is largely due to its high protein content, affordability, and versatility, which make it suitable for a range of products such as plant-based milk, meat substitutes, and tofu. The well-established supply chains and large-scale soy cultivation ensure consistent availability and cost efficiency. Its long-standing use in plant-based diets and strong consumer familiarity further contribute to its widespread adoption, solidifying its leading position in the market.
Oat-based ingredients are projected to grow at a CAGR of 13.03% through 2031, driven by increasing consumer demand for allergen-friendly and clean-label options. Oats are naturally free from common allergens like soy and nuts, making them appealing to a wider range of consumers. Their mild flavor and creamy texture make them ideal for dairy alternatives, such as plant-based milk and yogurt. The growing preference for sustainable, minimally processed ingredients has also boosted oats' popularity. Continued product innovation and improved retail availability are expected to support the steady growth of this segment.
By Form:
Refrigerated Lines Still LargestRefrigerated and chilled products accounted for 32.21% of plant-based food and beverage sales in 2025, driven by growing preference for fresh, less-processed options. These include plant-based milk, yogurt, meat substitutes, and ready-to-eat meals that require refrigeration to maintain quality and shelf life. Consumers often perceive chilled products as fresher and tastier, boosting their popularity. The expansion of cold storage facilities and their increasing availability in supermarkets and specialty stores have further supported this segment. The introduction of premium and functional plant-based products has contributed to the growth of refrigerated options.
Ready-to-eat and ready-to-cook plant-based products are expected to grow at a CAGR of 13.46% through 2031, reflecting rising demand for quick, convenient meal solutions. As urbanization increases and lifestyles become busier, more consumers are turning to easy-to-prepare plant-based options. Companies are responding by offering a wider range of products, such as frozen meals, ready-made snacks, and precooked meat substitutes, to meet these needs. Innovations in product development, improved taste profiles, and better retail availability are driving this segment forward. The focus on convenience is expected to remain a key factor in the continued growth of this category.
By Distribution Channel:
Supermarkets CommandOff-trade channels, such as supermarkets, hypermarkets, specialty stores, and e-commerce platforms, accounted for 71.82% of the plant-based food and beverage market revenue in 2025. These channels are popular because they offer a wide variety of products, easy accessibility, and strong visibility for plant-based options. Supermarkets dominate due to their established cold-storage infrastructure and ability to stock diverse product ranges. E-commerce is also growing rapidly, providing consumers with direct access to products and a broader selection of niche and premium brands. The continuous growth of organized retail and online grocery platforms is expected to keep off-trade channels as the leading distribution method for plant-based products.
On-trade channels, including restaurants, cafes, and foodservice outlets, are expected to grow at a CAGR of 13.13% through 2031. This growth is driven by the growing availability of plant-based menu options as foodservice providers adapt to consumer demand for healthier, more sustainable meals. Quick-service restaurants and casual dining chains are introducing plant-based alternatives to attract a wider range of customers. The rising trend of dining out and growing consumer awareness about plant-based diets are boosting demand in this segment. As a result, plant-based products are becoming more prominent in foodservice channels, further expanding their market presence.
Geography Analysis
APAC Plant-Based Food and Beverages Market
Asia Pacific accounted for 35.84% of the plant-based food and beverage market revenue in 2025, making it the leading region. This growth is fueled by increasing consumer interest in plant-based diets, driven by health consciousness and the rising popularity of flexitarian lifestyles. Countries like China, Japan, and India are experiencing significant demand driven by large populations and growing urbanization. Local manufacturers are creating products that cater to regional tastes, thereby improving acceptance and accessibility. Investments in production facilities and supply chain networks are further solidifying the region’s dominance in the market.
MEA Plant-Based Food and Beverages Market
The Middle East and Africa region is expected to grow at a CAGR of 12.05% through 2031, emerging as one of the fastest-growing markets. This growth is supported by increasing awareness of health benefits, a rising need for alternative protein sources, and government initiatives promoting food diversification. Improved retail infrastructure and the availability of plant-based products are making these options more accessible to consumers. Younger generations and urban populations are increasingly interested in plant-based diets, further driving demand. The entry of both global and regional players into the market is expected to accelerate growth in this region.
Europe, North America and LATAM Plant-Based Food and Beverages Market
Europe and North America are mature markets with steady demand, driven by strong consumer awareness of sustainability and established plant-based eating habits. Consumers in these regions are increasingly motivated by environmental concerns, ethical sourcing, and preferences for clean-label products. Retailers are expanding their offerings, including affordable private-label plant-based products, to cater to a wider audience. In Latin America, countries like Brazil and Mexico are experiencing gradual growth due to urbanization and rising consumer awareness of plant-based options. Continued innovation in product development and the expansion of retail distribution channels are expected to support long-term growth in these regions.
Regulatory Landscape
Regulation is tightening around how plant-based foods can be named and marketed, particularly where products resemble conventional meat and dairy. In the United States, the FDA issued draft guidance in January 2025 recommending source-specific names for plant-based alternatives (for example, identifying the plant source in the product name) to reduce consumer confusion. While non-binding, it has influenced on-pack naming conventions and claim substantiation practices.
In Europe, the EU Council and Parliament reached a provisional agreement in March 2026 to reserve traditional denominations such as "steak" and "bacon" for products of animal origin, while keeping terms such as "burger" and "sausage" permissible, with a transition period for compliance. Standardization is also progressing: ISO 8700:2025 (published July 2025) defines terminology and technical criteria for labeling and claims for plant-based foods, and Singapore adopted it as SS ISO 8700:2026, supporting more consistent labeling requirements across markets that trade in packaged plant-based foods and beverages.
Value Chain Analysis
The value chain covers crop and ingredient supply (soy, oat, pea, almond, wheat, rice, coconut), primary processing into isolates, concentrates, oils, and functional ingredients, and downstream manufacturing into plant-based dairy, meat substitutes, bakery, snacks, and beverages across refrigerated, frozen, and shelf-stable formats. Quality and traceability requirements are increasingly formalized upstream, including programs such as Donau Soja's Europe Soya guidelines (2026), which use contract-based compliance and risk-based inspections for GM-free status, shaping sourcing decisions and supplier qualification for soy-based formulations.
Midstream and downstream capabilities are influenced by cold-chain readiness and formulation know-how, especially for refrigerated and chilled items that represent a large share of sales. Government-backed initiatives also shape procurement and production planning: Denmark's Action Plan for Plant-based Foods supports coordinated development from farmers through processors to retailers and canteens, reinforcing local supply networks for plant-based end products. In the EU, the European Commission's CAP post-2027 proposals (COM(2026) 355 final) include mechanisms designed to strengthen farmer negotiating power and encourage more organized value-chain investment around protein crops, which feeds into ingredient availability and cost structure.
Competitive Landscape
The plant-based food and beverages market is moderately fragmented, with both large multinational corporations and smaller innovative brands competing for market share. Major companies like Danone SA, Nestlé SA, Beyond Meat Inc., Oatly Group AB, and Conagra Brands Inc. dominate the market due to their strong product portfolios and extensive global distribution networks. These companies cater to a wide range of consumer preferences by offering a diverse product line, including plant-based dairy, meat substitutes, and beverages. Their ability to produce on a large scale and continuously invest in new product development helps them maintain a competitive edge. However, the presence of numerous regional and emerging brands further fragments the market, creating a dynamic competitive environment.
Leading manufacturers are actively expanding their product offerings and improving supply chain efficiency to meet growing consumer demand. They are heavily investing in research and development to enhance the taste, texture, and nutritional value of their products, which helps in attracting repeat customers. These companies are forming strategic partnerships and entering new geographic markets to strengthen their global presence. Retail expansion and collaborations with foodservice providers are also key strategies to make plant-based products more accessible to consumers. These efforts allow major players to maintain their market position while addressing the evolving needs of the plant-based food and beverages market.
Smaller and regional players are gaining momentum by focusing on niche markets and offering premium or locally tailored plant-based products. Many of these companies emphasize clean label ingredients, sustainability, and unique formulations to stand out in the competitive landscape. Private label brands are also increasing their presence by providing cost-effective alternatives, which adds to the competitive pressure. Success in this market depends on efficient supply chains, reliable ingredient sourcing, and effective brand positioning. As competition continues to grow, companies must prioritize innovation and differentiation to achieve long term success in the plant-based food and beverages market.
Plant-Based Food And Beverages Industry Leaders
-
Danone SA
-
Beyond Meat Inc.
-
Nestlé SA
-
Oatly Group AB
-
Conagra Brands Inc.
- *Disclaimer: Major Players sorted in no particular order
Plant-Based Food And Beverages Market Companies Covered in this Report
- Danone SA
- Nestlé SA
- Beyond Meat Inc.
- Oatly Group AB
- Blue Diamond Growers
- Conagra Brands Inc.
- Campbell Soup Company
- Impossible Foods Inc.
- The Hain Celestial Group Inc.
- SunOpta Inc.
- Tofutti Brands Inc.
- Chobani LLC
- Eden Foods Inc.
- Califia Farms LLC
- Kellanova (MorningStar Farms)
- Upfield BV
- Tattooed Chef Inc.
- Valio Ltd.
- Yili Group
- Tyson Foods Inc.
Market Opportunities and Future Outlook
Opportunities are appearing where manufacturers can address nutrition performance, taste parity, and labeling clarity together. High-protein and fortified propositions are one area of ongoing competition in plant-based dairy and beverages, reflected in Danone's expansion of its Silk portfolio with high-protein plant-based yogurt and shakes, which keeps pressure on protein density, texture, and everyday consumption formats. Clean-label reformulation is another active lane, supported by Beyond Meat's efforts to shorten ingredient lists in the United Kingdom and aimed at flexitarian consumers who compare plant-based products directly with conventional options.
Policy and standards developments also create openings for suppliers and brand owners that can align with new definitions and naming rules. The publication of ISO 8700:2025 and its adoption in Singapore as SS ISO 8700:2026 offer a clearer basis for standardized labeling and claims governance, which can reduce friction for cross-border commercialization in packaged foods and beverages. In Europe, post-2027 CAP proposals that recognize producer and interbranch organizations and prioritize local and seasonal protein crops point to investment headroom in storage, processing, and ingredient infrastructure, supporting more resilient sourcing options for soy alternatives (such as oat and pea) and enabling broader product portfolios across retail and foodservice.
Recent Industry Developments in Plant-Based Food And Beverages Market
- July 2026: Beyond Meat Inc. expands its Beyond Steak Filet into Meijer stores, marking a direct market rollout in an additional U.S. retail chain. This expands the brand's footprint in mass merchandisers and invites greater consumer trial of plant based steak options.
- July 2026: Danone USA launches Silk Protein Yogurt and Silk Protein Shakes as part of Silk plant powered nutrition portfolio in the United States. The broader plant based dairy lineup enhances exposure and potential category leadership in high protein plant based dairy.
- June 2026: Beyond Meat Inc. rolls out Beyond Immerse, a functional beverage line, in the New York metro area through distributor Big Geyser. The introduction diversifies Beyond Meats beverage portfolio and leverages urban distribution for faster shelf turnover.
Plant-Based Food And Beverages Market Report Scope and Research Methodology
Market Definition and Coverage
This market is defined as the value of packaged foods and beverages that are made primarily from plant sources and sold as direct alternatives to animal-based products, across retail and foodservice channels, and measured in end-user sales value.
Scope exclusions: It excludes fresh, unprocessed produce and grains sold as regular staples. It also excludes supplements and pharmaceuticals even if they contain plant proteins.
Segments Covered in This Report
- By Product Type
- Plant-Based Dairy
- Yogurt
- Cheese
- Frozen Desserts and Ice Creams
- Others
- Meat Substitutes
- Tofu
- Tempeh
- Textured Vegetable Protein
- Others
- Plant-Based Nutrition/Snack Bars
- Plant-Based Bakery Products
- Plant-Based Beverages
- Packaged Milk
- Packaged Smoothies
- Coffee
- Tea
- Others
- Other Product Types
- Plant-Based Dairy
- By Ingredient Source
- Soy
- Almond
- Pea
- Oat
- Wheat
- Rice
- Coconut
- Others
- By Form
- Refrigerated/Chilled
- Frozen
- Shelf-Stable/Ambient
- Ready-To-Eat/Ready-To-Cook
- By Distribution Channel
- On-Trade
- Off-Trade
- Supermarkets/Hypermarkets
- Convenience Stores
- Online Stores
- Other Channels
- By Geography
- North America
- United States
- Canada
- Mexico
- Rest of North America
- South America
- Brazil
- Argentina
- Colombia
- Chile
- Peru
- Rest of South America
- Europe
- Germany
- United Kingdom
- Italy
- France
- Spain
- Netherlands
- Poland
- Belgium
- Sweden
- Rest of Europe
- Asia-Pacific
- China
- Japan
- India
- Australia
- Indonesia
- South Korea
- Thailand
- Singapore
- Rest of Asia-Pacific
- Middle East and Africa
- South Africa
- Saudi Arabia
- United Arab Emirates
- Nigeria
- Egypt
- Morocco
- Turkey
- Rest of Middle East and Africa
- North America
Data Sources, Market Sizing, and Validation
Desk Research
Desk research helps map the size and direction of demand before building the model. We take baseline signals from public sources such as USDA and ERS food consumption series, the US International Trade Commission trade statistics, FAOSTAT supply and production datasets, and Eurostat food and beverage manufacturing data. These are used to sense category expansion, import and export dynamics, and price pressure.
We also review company filings and investor presentations for branded revenue commentary, product mix shifts, and geographic exposure, then use credible press and association websites to track launch activity and retail shelf expansion. Patent databases are used selectively to track plant protein and fermentation-adjacent claims, which helps validate innovation cycles. A paid subscription for company financials and intelligence, along with a paid news and financials feed, is used to cross-check corporate moves and reported category contributions. These sources are illustrative, and other public references were also used for data collection, validation, and clarification.
Primary Interviews and Surveys
Primary interviews and surveys are used to pressure-test what we see in desk research, especially around category boundaries, channel splits, and realistic price ladders by product format. We spoke with a mix of brand owners, ingredient suppliers, retailers and distributors, and foodservice-linked experts across major consuming regions. Their inputs were used to confirm assumptions that could not be read cleanly from public datasets.
Distribution of primary research fieldwork respondents
| Company type | Respondent position | Region |
|---|---|---|
| Top tier: 32% | CXOs: 14% | APAC: 47% |
| Mid tier: 53% | Functional/Unit leaders: 26% | EMEA: 29% |
| Smaller Players: 15% | Managers: 60% | Americas: 24% |
Market-Sizing & Forecasting
The core sizing uses a top-down build where food category sales pools are reconstructed by geography and then filtered using plant-based penetration rates, followed by channel splits across retail and foodservice. To keep totals realistic, we corroborate the results with selective bottom-up approximations such as sampled brand revenue roll-ups, distributor channel checks, and a volume times average selling price approach for a few high-visibility categories, which are then used to adjust outliers.
Key model inputs include plant protein ingredient availability and pricing signals, household adoption of flexitarian diets, lactose intolerance prevalence as a demand cue for dairy alternatives, retail shelf space and private label activity, and price gaps versus animal-based equivalents (which affects repeat purchase). For forecasting, scenario analysis is used to reflect different paths for price normalization and trial to repeat conversion, and then primary inputs are used to select the most likely case. Where bottom-up data is thin in smaller countries, we bridge gaps using analog markets with similar income levels and retail structure, then re-check the implied per capita spend.
Data Validation & Update Cycle
Validation is done through triangulation across independent signals, followed by a variance review at each major step of the model. We compare the implied spend per capita, category growth rates, and trade and production direction with what is visible in public datasets and what was heard in interviews, and we flag anomalies for a second pass.
Before sign-off, the work goes through multi-step analyst reviews that look for math errors, scope leakage across categories, and unrealistic price or penetration jumps. If a mismatch remains material, respondents are re-contacted to clarify the assumption, and a change log is maintained. Reports are refreshed annually, with interim updates for material events. A final pre-delivery check is also performed so clients receive the latest updated view.
Mordor Intelligence's Plant Based Food and Beverages Market Estimate Compared With Other Published Estimates
Published market numbers for plant-based foods and beverages can vary because each publisher draws the product boundary differently, and they also choose different starting years and channel coverage. Currency timing and whether foodservice is treated as full value add versus a smaller add-on can also create visible gaps.
By tracking category-level penetration and refreshing price-gap assumptions with interview feedback, Mordor Intelligence keeps the total tied to plant-based alternatives sold to end users, instead of mixing in broad plant-derived staples or adjacent wellness items. Differences also come from how quickly prices are assumed to normalize, whether conservative or aggressive adoption scenarios are used, and how often the model is updated when large retail resets or reformulations change the run-rate.
Benchmark comparison
| Source | Market Size | Gaps in Research Methodology |
|---|---|---|
| Mordor Intelligence | USD 85.01 B (2025) | |
| Industry Association A | USD 28.60 B (2024) | This estimate tracks a narrower retail basket that focuses mainly on plant-based meat and dairy alternatives, so it excludes many plant-based food formats and several beverage categories that are counted in a full market view. |
| Trade Journal B | USD 8.10 B (2024) | This figure is a country-level retail sales snapshot, and it is often built from scanner panels that do not represent global coverage, do not include most foodservice value, and may treat private label and club channels differently. |
The spread in the table is mainly explained by scope and geography, not just growth math. When the counted categories are clearly defined, and channel coverage and pricing logic are made explicit, the resulting market size becomes easier to reproduce and easier to monitor over time.
Key Questions Answered in the Report
What is the projected value of the plant-based food and beverages market by 2031?
The plant-based food and beverages market size is forecast to reach USD 166.43 billion by 2031.
Which region accounts for the largest revenue share today?
Asia-Pacific holds 35.84% of 2025 global revenue, making it the largest regional market.
Which segment is expected to grow fastest within the category?
Meat substitutes are projected to post a 12.61% CAGR through 2031 as whole-muscle textures improve.
Why is oat gaining ground against soy in plant-based drinks?
Oat offers neutral flavor, lower allergen risk, and a smaller water footprint, driving a 13.03% CAGR through 2031.