
Planar Solid Oxide Fuel Cell Market Size and Share
Market Overview
| Study Period | 2021 - 2031 |
|---|---|
| Market Size (2026) | USD 1.12 Billion |
| Market Size (2031) | USD 1.74 Billion |
| Growth Rate (2026 - 2031) | 9.09 % |
| Fastest Growing Market | Asia Pacific |
| Largest Market | North America |
| Market Concentration | Medium |
Major Players *Disclaimer: Major Players sorted in no particular order Image © Mordor Intelligence. Reuse requires attribution under CC BY 4.0. | |
Planar Solid Oxide Fuel Cell Market Analysis by Mordor Intelligence
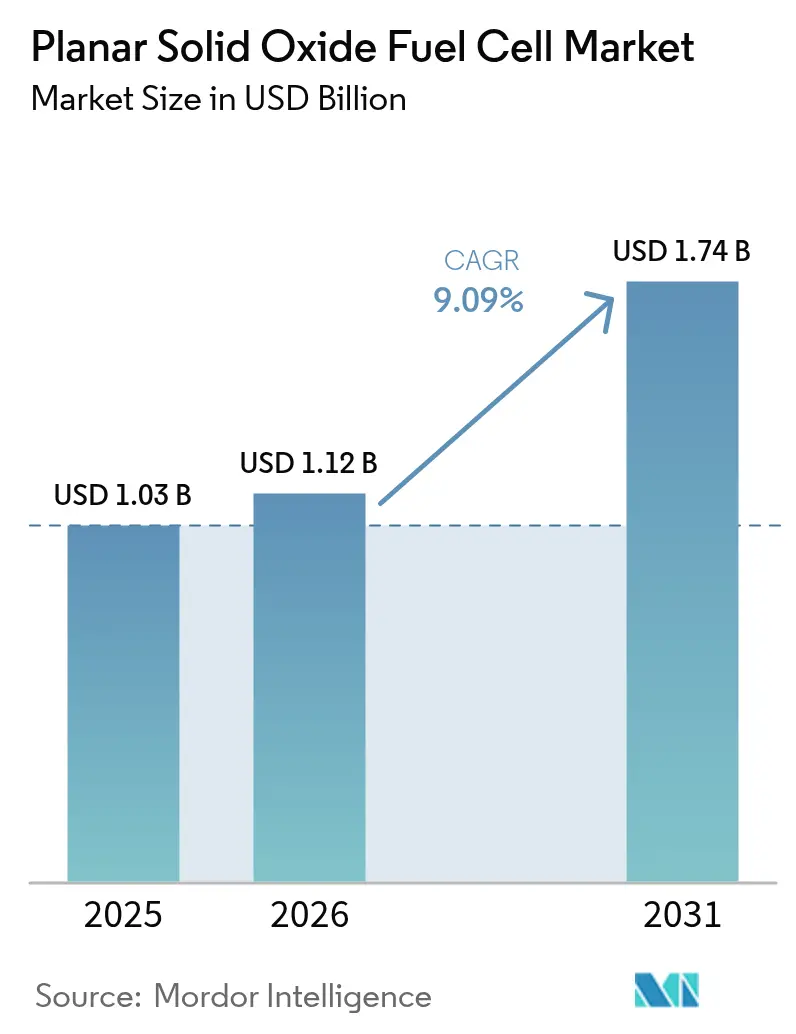
The Planar Solid Oxide Fuel Cell market size is expected to grow from USD 1.03 billion in 2025 to USD 1.12 billion in 2026 and is forecast to reach USD 1.74 billion by 2031 at 9.09% CAGR over 2026-2031.
This upward trajectory is largely driven by government-backed hydrogen incentives, increasing data-center power requirements, and steady cost declines in planar solid oxide fuel cell stacks. Widespread policy support is catalyzing first-of-a-kind industrial deployments, while the technology’s 60% electrical efficiency and near-90% total system efficiency when paired with heat recovery position it as a prime replacement for diesel generation in mission-critical sites. Natural-gas fueled units dominate today’s installed base, yet hydrogen-ready designs are gaining ground as clean-fuel regulations tighten. Manufacturers are lowering stack costs through reduced-temperature sintering and increased cell throughput, and investors are responding by accelerating gigawatt-scale factory buildouts in Europe and Asia. Together, these factors underpin investor confidence that the planar solid oxide fuel cell market will remain a pivotal pillar of the global energy-transition toolkit.
Key Report Takeaways
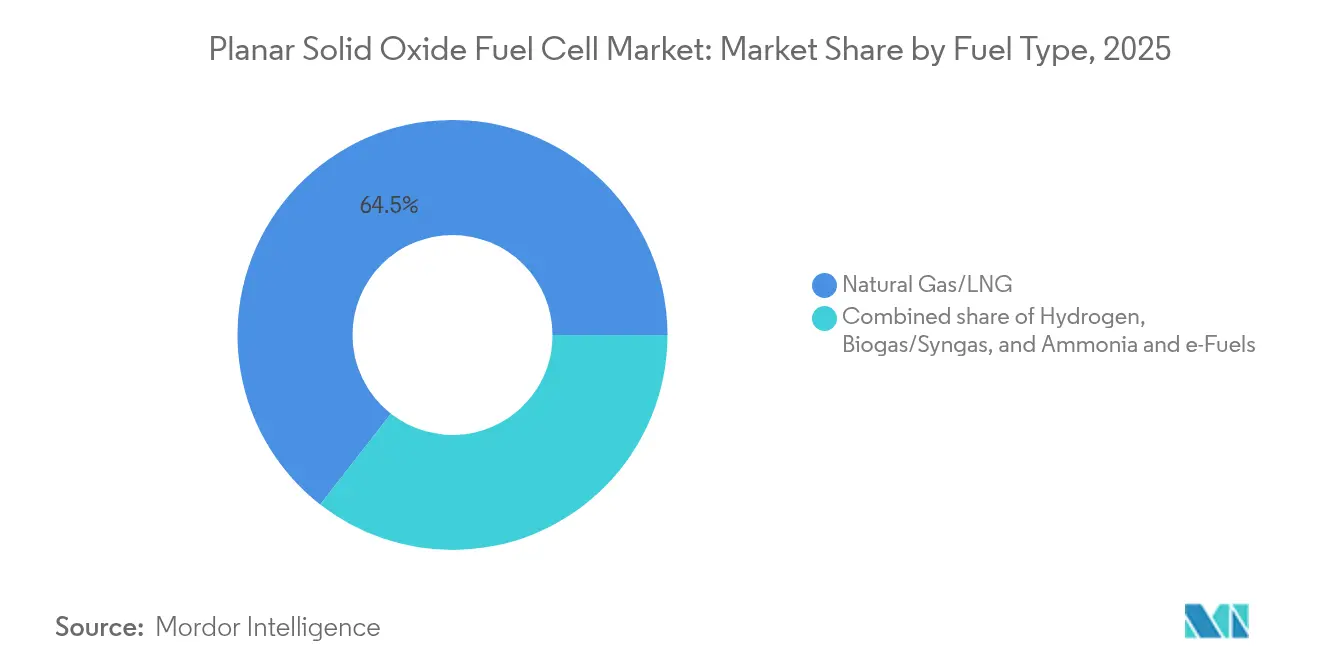
- By fuel type, natural gas/LNG accounted for 64.45% of the planar solid oxide fuel cell market share in 2025, while hydrogen applications are forecast to advance at a 12.35% CAGR through 2031.
- By electrolyte material, yttria-stabilised zirconia (YSZ) accounted for 66.80% of the planar solid oxide fuel cell market size in 2025, whereas lanthanum gallate-based (LSGM) is expanding at a 10.21% CAGR.
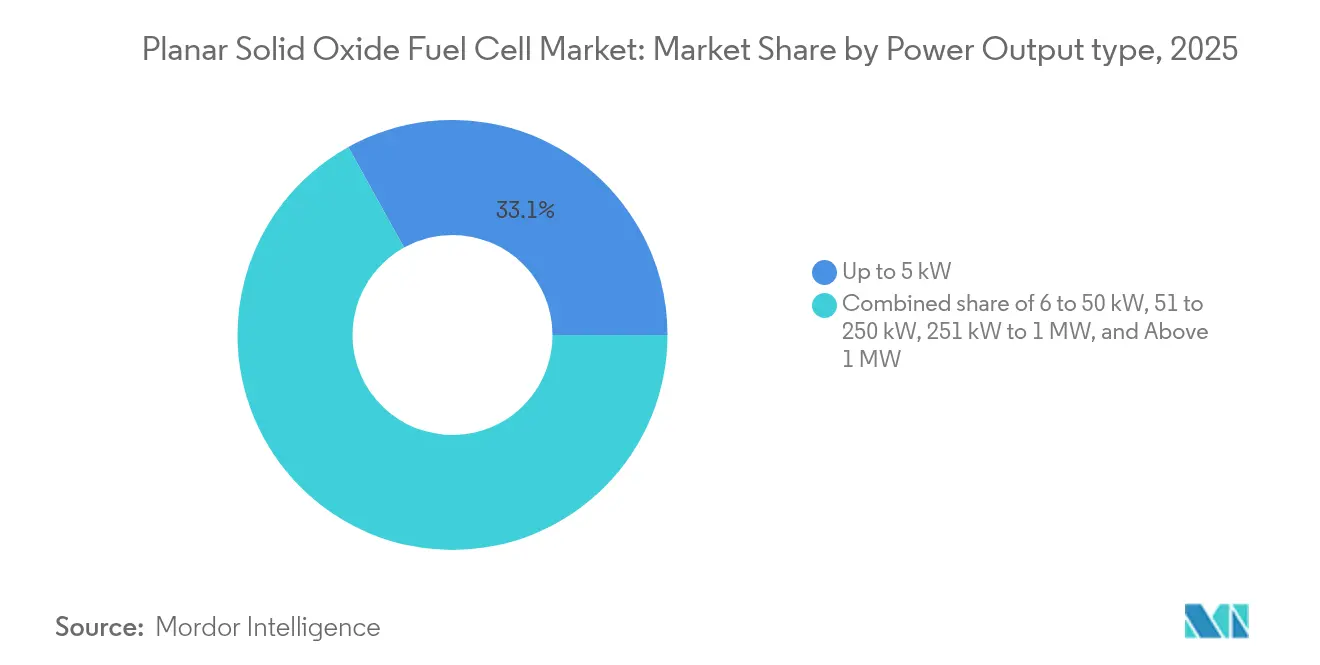
- By power output, the up to 5 kW segment held a 33.05% share of the planar solid oxide fuel cell market size in 2025, and above-1 MW systems are projected to grow at a 11.62% CAGR between 2026 and 2031.
- By application, stationary baseload generation captured a 39.20% share of the planar solid oxide fuel cell market size in 2025, whereas backup and prime-power units are poised to grow at a 9.86% CAGR through 2031.
- By geography, the Asia-Pacific region led with a 47.10% revenue share in 2025; North America is expected to expand at a 10.53% CAGR through 2031.
- Bloom Energy, Ceres Power, FuelCell Energy, and Mitsubishi Power collectively represented more than 55% of global shipments in 2024.
Note: Market size and forecast figures in this report are generated using Mordor Intelligence’s proprietary estimation framework, updated with the latest available data and insights as of 2026.
Market Trends and Insights
Drivers Impact Analysis of Planar Solid Oxide Fuel Cell Market*
| Driver | (~) % Impact on CAGR Forecast | Geographic Relevance | Impact Timeline |
|---|---|---|---|
| Government decarbonization targets & hydrogen incentives | +1.60% | Global (early momentum in North America, Europe, Asia-Pacific) | Medium term (2-4 years) |
| Demand for resilient power in data centres & C&I sites | +2.10% | North America, Europe, Asia-Pacific | Short term (≤ 2 years) |
| Advances in planar SOFC manufacturing lower system CAPEX | +1.80% | Global | Medium term (2-4 years) |
| High electrical efficiency & multi-fuel flexibility | +1.40% | Global | Long term (≥ 4 years) |
| Reversible planar SOFCs for on-site green-H₂ production | +1.20% | Europe, North America (spill-over to Asia-Pacific) | Long term (≥ 4 years) |
| CCUS-ready planar SOFC hybrid pilots boost utility uptake | +0.90% | North America, Europe | Long term (≥ 4 years) |
| Source: Mordor Intelligence | |||
Government decarbonization targets & hydrogen incentives
Governments worldwide are pairing climate-neutrality goals with generous fiscal measures that directly benefit the planar solid oxide fuel cell market. The U.S. Inflation Reduction Act offers up to USD 3 per kg in clean-hydrogen production tax credits, Canada applies a 15-40% Clean Hydrogen Investment Tax Credit, and Germany is channeling EUR 4.6 billion into 23 IPCEI Hydrogen Programme projects. Australia’s planned AUD 8 billion hydrogen-production incentive begins in 2027, and the UK’s Gas Shipper Obligation is designed to narrow the cost gap between low-carbon hydrogen and fossil fuels.(1)K&L Gates, “Australia’s Hydrogen Production Incentive,” klgates.comThese incentives cut payback periods for new installations, stimulate local supply chains, and accelerate large-scale manufacturing commitments in Europe and Asia. The alignment of fiscal tools, carbon pricing, and permitting reforms is now translating into bankable project pipelines that will propel the planar solid oxide fuel cell market over the next decade.(2)Federal Government of Germany, “National Hydrogen Strategy Update,” bundesregierung.de
Demand for resilient power in data centres & C&I sites
Explosive growth in generative AI and high-performance computing is doubling the electricity consumption of global data-center clusters, forcing operators to rethink their reliance on standby diesel. Planar solid oxide fuel cell systems achieve 60% net electrical efficiency and can exceed 90% total system efficiency when integrated with chilled-water loops, making them a compelling fit for hyperscale campuses.(3)Microgrid Knowledge, “SOFCs as Prime Power for AI Data Centres,” microgridknowledge.com Recent 9.75 MW installations across Belgian commercial estates and pending 20 MW deployments in California show buyers favoring modular SOFC arrays that can be sited without extensive grid-interconnection upgrades. In commercial and industrial estates, the same technology enables firms to hedge outage risk, monetize waste heat, and meet ESG metrics without sacrificing uptime. The trend is expected to drive multi-megawatt orders and keep data-center operators among the fastest-growing end-users of the planar solid oxide fuel cell market.
Advances in planar SOFC manufacturing lower system CAPEX
Manufacturers are steadily eroding stack costs by shortening sintering dwell times, switching to lower-temperature co-firing, and optimizing cell geometry. Laboratory evidence indicates that co-firing at 1,250 °C, utilizing Fe₂O₃ sintering aids, reduces energy consumption and preserves mechanical integrity compared to 1,550 °C. Tri-layer ceria-zirconia-ceria designs achieve 1.2 W cm-² at 650 °C while retaining large-format manufacturability. Cold-isostatic pressing has delivered dense bilayer electrolytes at 1,250 °C with power densities of 1.251 W cm-². The U.S. Department of Energy targets system-level costs of USD 900 kW⁻¹ by 2025, and analysts expect sub-USD 800 kW⁻¹ beyond 2030 as automated sealing, thinner interconnects, and larger cell footprints are adopted. As high-volume plants transition from pilot to commercial production, these innovations reduce capital cost premiums and expand the addressable market for planar solid oxide fuel cell solutions.
High electrical efficiency & multi-fuel flexibility
Planar SOFC technology achieves over 60% electrical efficiency in standalone mode and approximately 85% in combined heat and power service, surpassing competing combustion and PEM pathways. Internal reforming enables the direct use of natural gas, biogas, syngas, and even ammonia without the need for complex upstream processing. Demonstrations of 100 kW direct-ammonia stacks for maritime power show peak densities exceeding 1,000 mW cm-², while biogas-SOFC coupling achieves a total system efficiency of 70.88% and yields attractive revenue streams for waste management. The ability to operate on today’s pipeline gas and convert to green-hydrogen feedstock tomorrow provides asset owners with future-proofed flexibility, a key selling point in sectors facing decarbonization mandates.
Restraints Impact Analysis of Planar Solid Oxide Fuel Cell Market*
| Restraint | (~) % Impact on CAGR Forecast | Geographic Relevance | Impact Timeline |
|---|---|---|---|
| High upfront capital cost vs. conventional generators | –1.5% | Global | Short term (≤ 2 years) |
| Thermal durability & long-term degradation issues | –1.1% | Global | Medium term (2-4 years) |
| Rival PEMFC & battery solutions in low-power range | –0.8% | North America, Europe | Short term (≤ 2 years) |
| Nickel price volatility impacting anode supply chain | –0.6% | Global | Medium term (2-4 years) |
| Source: Mordor Intelligence | |||
High upfront capital cost vs. conventional generators
Planar SOFC systems still command USD 5,000–10,000 kW⁻¹ in the 100 kW to multi-MW range, well above diesel or gas turbines. Small 1–10 kW models can reach USD 30,000 kW⁻¹, a hurdle that suppresses residential adoption. Levelized-cost studies show hydrogen-fueled units at GBP 0.527 kWh⁻¹, triple the natural-gas equivalent, underscoring the premium for zero-carbon operation. Economics improve in regions with high retail electricity prices and supportive feed-in tariffs, but global parity hinges on mass production. Industry roadmaps indicate that stack costs could decrease from USD 500 kW⁻¹ to under USD 100 kW⁻¹ when volumes exceed several hundred megawatts annually, a tipping point that would significantly reduce the price gap.
Thermal durability & long-term degradation issues
Repeated thermal cycling can degrade cell interfaces at a rate of 0.5–1.5% per 1,000 hours, eroding efficiency and shortening maintenance intervals. Interface delamination between cathodes and metallic interconnects remains a primary failure mechanism, with early-life degradation rates peaking at 0.89% per cycle during the first 34 on-off sequences [SCiencedirect.com]. Post-operational examinations of stacks surpassing 100,000 hours reveal chromium poisoning and anode fragmentation, although electrolytes generally remain intact. Research into cobalt-embedded gadolinia-doped ceria nanocatalysts has yielded 30% performance gains in fuel-cell mode and 60% gains in electrolysis mode, paving the way for longer service life at lower temperatures. Continued materials innovation will be vital in achieving the sub-0.25% degradation rate benchmarks demanded by long-term financiers.
*Our forecasts treat driver/restraint impacts as directional, not additive. The impact forecasts reflect baseline growth, mix effects, and variable interactions.
Planar Solid Oxide Fuel Cell Market Segment Analysis
By Fuel Type:
Hydrogen Drives Decarbonization TransitionNatural gas/LNG retained 64.45% of the planar solid oxide fuel cell market share in 2025, buttressed by existing gas grids and the architecture’s built-in steam reforming capacity. Hydrogen projects, however, are advancing at a 12.35% CAGR and are expected to narrow the gap sharply after 2027 as green-hydrogen costs fall and carbon pricing widens. Biogas-syngas integrations bolster circular-economy economics by monetizing landfill or agricultural waste streams, while ammonia and e-fuel pilots serve heavy-transport niches seeking zero-carbon alternatives. Reversible SOFC modules that switch between fuel-cell and electrolysis modes enable industrial sites to generate hydrogen during low-demand periods and export power at peak tariff hours, unlocking additional revenue. Carbon-capture-compatible stack designs further expand the addressable market among refineries and steel mills pursuing net-zero pathways.
Hydrogen’s advance will continue to pull the planar solid oxide fuel cell market size toward zero-carbon applications through 2031. With governments earmarking tens of billions of dollars for electrolyzer tax credits, plant developers are opting for dual-mode SOFC/SOEC lines that hedge against future commodity price fluctuations. The combination of hydrogen readiness, future fuel flexibility, and falling stack prices positions SOFC arrays as a central solution for industrial decarbonization strategies worldwide.


By Electrolyte Material:
YSZ Dominance with LSGM InnovationYttria-stabilized zirconia (YSZ) commanded a 66.80% share of the planar solid oxide fuel cell market in 2025, due to its robust ionic conductivity within the 700–800 °C operating window and a mature supply base. Lanthanum gallate (LSGM) is expanding at a 10.21% CAGR as developers seek intermediate-temperature options that alleviate mechanical stress and reduce balance-of-plant costs. Gadolinium-doped ceria meets the niche demand for residential and light-commercial units that require quick ramp rates.
Tri-layer ceria-zirconia-ceria builds boost area-specific resistance to just 0.01 Ω cm², achieving over 1.2 W cm-² at 650 °C, while bilayer YSZ–GDC configurations produced via cold-isostatic pressing reach 1.251 W cm-² at the same temperature. Interface engineering, such as nano-web cathodes, helps curb chromium poisoning and enhances oxygen-reduction kinetics. These electrolyte innovations should preserve YSZ’s lead over the forecast horizon while allowing LSGM hybrids to capture a high-growth share in the portable and mCHP segments.
By Power Output:
Megawatt Systems Lead GrowthUnits up to 5 kW delivered 33.05% of 2025 shipments, serving residential micro-cogeneration and telecommunication sites. Above-1 MW systems will surge at a 11.62% CAGR as utilities, refineries, and data-center operators standardize multi-megawatt blocks. Bloom Energy’s recent 20 MW contract highlights the scalability of modular planar stacks for grid-interactive microgrids, while Hope Gas’s 7,250-unit residential rollout in West Virginia demonstrates the credibility of the consumer market. Manufacturing-cost models indicate large-format lines could reach USD 370/kW direct costs at high volumes, narrowing the gap with reciprocating engines and accelerating adoption in the >1 MW bracket.
Commercial traction in the 51–250 kW cohort remains strong among retail chains and hospitals seeking resilient on-site generation with combined heat capacities. Meanwhile, 251 kW–1 MW systems bridge corporate campuses and small industrial loads, often configured as fuel-neutral generators that can switch seamlessly between LNG and green hydrogen without requiring hardware replacement.
By Application:
Backup Power Emerges as Growth DriverStationary baseload plants held a 39.20% share in 2025 and will continue to be the cornerstone of industrial SOFC deployment, delivering critical electricity and high-grade heat. Backup and prime-power units are poised for a 9.86% CAGR as weather-related outages push hospitals, airports, and distribution hubs toward low-emission alternatives to diesel sets. Healthcare installations, such as Klickitat Valley Health's 100 kW hydrogen system, illustrate early momentum, while universities adopt planar SOFC cogeneration to meet net-zero commitments.
Off-grid and auxiliary power markets, including maritime and remote defense posts, are increasingly relying on ammonia- and LPG-fueled stacks to extend mission range without incurring carbon penalties. The cumulative demand from these niches continues to reinforce the planar solid oxide fuel cell market's position as a diversified, multi-application platform.
By End-User:
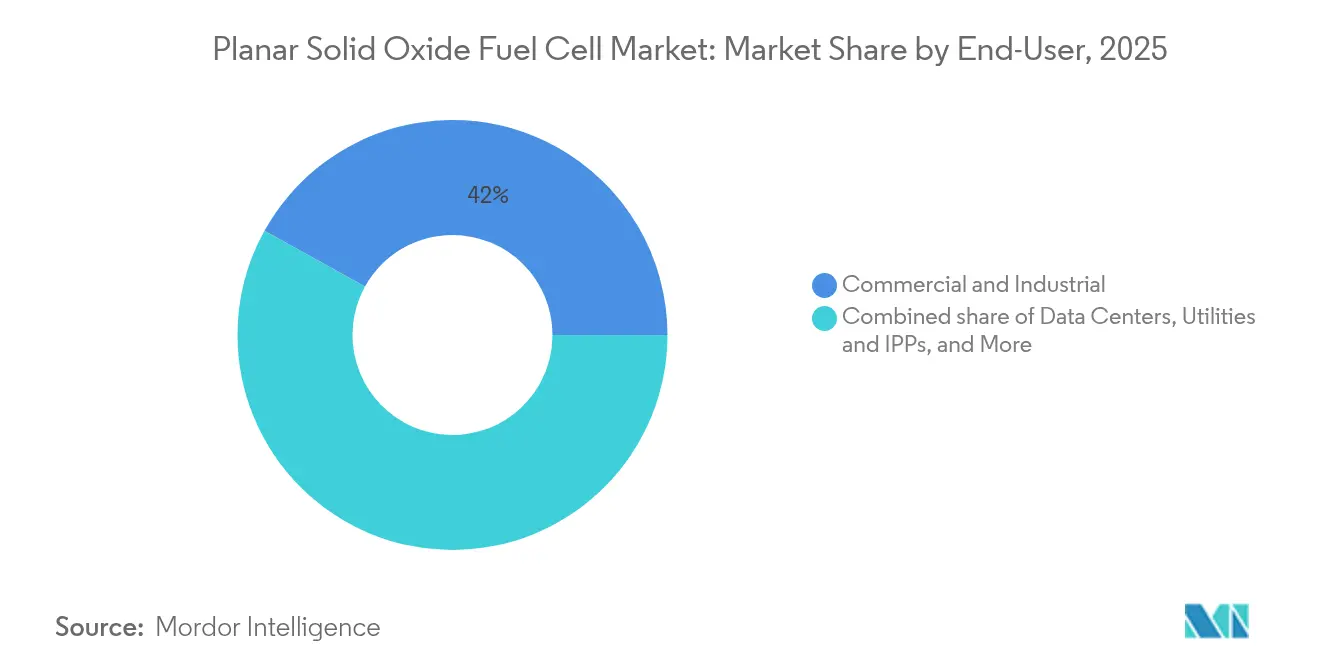
Data Centers Drive Market ExpansionCommercial-industrial buyers represented 41.95% of the 2025 planar solid oxide fuel cell market; however, data-center operators are expected to post a 12.12% CAGR through 2031 as AI workloads increase. Microsoft, Equinix, and CoreWeave are piloting SOFC arrays to displace diesel generators, citing lower Scope 1 emissions and higher fuel efficiency. Utilities are next-tier adopters, integrating multi-megawatt SK Eternix-Bloom Energy blocks into capacity-constrained feeders. Defense agencies are field-testing hydrogen nanogrids that pair planar stacks with renewable energy sources for silent surveillance and perimeter security, demonstrating the technology's versatility across various mission profiles.
Geography Analysis
APAC Planar Solid Oxide Fuel Cell Market
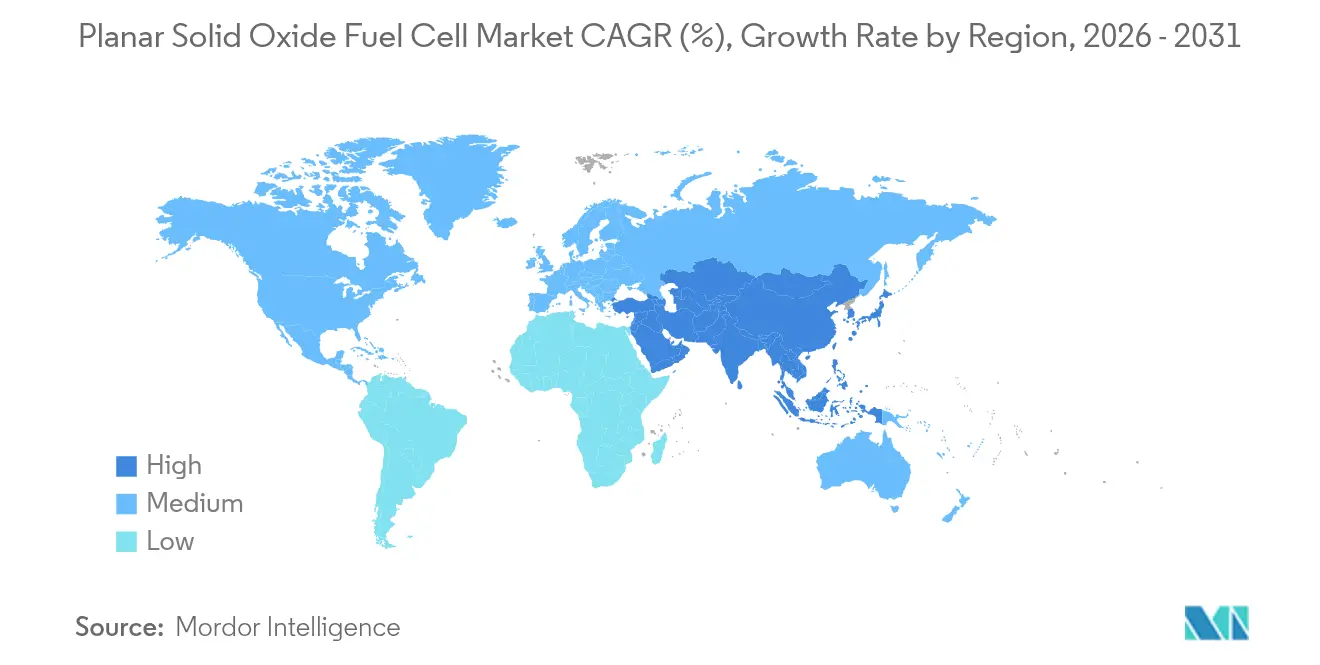
Asia-Pacific retained a 47.10% share of 2025 shipments on the back of China’s hydrogen-fuel-cell market jump from CNY 1.63 billion in 2019 to CNY 3.93 billion in 2023, with 2024 spend forecast at CNY 5.99 billion. Japan and South Korea continue to invest in both SOEC and SOFC platforms. Korea’s 8 kW electrolyzer stack, which produces 5.7 kg of H₂ per day, is the country’s largest to date. The region’s deep component supply chains and aggressive hydrogen road-maps ensure steady demand for planar solid oxide fuel cell market solutions.
North America Planar Solid Oxide Fuel Cell Market
North America is the fastest-growing territory at a 10.53% CAGR. The Inflation Reduction Act’s production credits, combined with DOE research grants and the expanding data center footprint, are propelling orders for multi-megawatt fuel cell parks. Canada’s 15–40% Clean Hydrogen Investment Tax Credit and a CAD 1.5 billion Clean Fuels Fund reinforce continental momentum. Residential adoption is also advancing, highlighted by the WATT HOME program in West Virginia.
Europe Planar Solid Oxide Fuel Cell Market
Europe’s strategy centers on pairing heavy industry with CCUS. Germany’s 10 GW electrolysis target and EUR 4.6 billion IPCEI outlays, the UK’s Gas Shipper Obligation, and Topsoe’s EUR 94 million EU-funded SOEC gigafactory cement the region’s supply-side capacity. Belgium’s 9.75 MW SOFC deployment signals commercial viability in northern Europe, while broader EU markets benefit from 41 operational CCUS sites and 392 projects in development, providing a ready tie-in for carbon-capture-compatible SOFC hybrid plants.

Regulatory Landscape
Policy support for hydrogen and high-efficiency distributed generation continues to influence commercialization pathways for planar SOFCs, particularly in stationary power and reversible SOFC/SOEC applications. In the United States, the Department of Energy programs and targets used by project developers and OEMs help anchor performance and cost roadmaps, including system cost targets such as USD 900/kW and durability/degradation benchmarks, while federal hydrogen incentives enabled under the Inflation Reduction Act framework strengthen the business case for hydrogen-ready systems at data centers and industrial sites.
In Europe, regulators are tightening focus on hydrogen lifecycle emissions accounting and infrastructure planning. EU-wide frameworks define low-carbon hydrogen eligibility through greenhouse gas methodology and set milestones for alternative fuels infrastructure implementation, with Commission reporting due by 31 December 2026 under AFIR (Regulation (EU) 2023/1804). The EU Net Zero Industry Act and the Clean Hydrogen Partnership (2021-2027) also provide mechanisms to support manufacturing and demonstrations, adding permitting and funding visibility for fuel cell-related supply chain investments and pilot deployments.
Value Chain Analysis
The planar SOFC value chain spans (i) upstream raw materials, (ii) cell and stack manufacturing, (iii) system integration and balance-of-plant (BoP), (iv) project development and installation, and (v) operations and service. Upstream inputs include high-purity ceramic powders for electrolytes, notably yttria-stabilized zirconia for YSZ-based cells, alongside rare earth-related materials, as well as metals for interconnects and coatings. Midstream manufacturing commonly uses scalable planar processes such as tape casting and screen printing for cell layers, followed by high-temperature co-firing/sintering and stack assembly, where furnaces, process electricity, and yield drive key cost outcomes. Downstream BoP, including fuel processing, thermal management, power electronics, and controls, remains a meaningful share of total system cost for stationary installations.
Supply-chain risk clusters around concentrated availability of some high-purity rare earth inputs, including yttria and scandia derivatives, and reliance on specialized production equipment and know-how from a limited set of industrial bases, which can create single-source or regional bottlenecks. To manage these constraints, OEMs and partners increasingly emphasize multi-sourcing, tighter quality control for powders and coatings, and selective vertical integration into critical components such as cells, interconnects, and sealing to support durability and cost targets. Sales and delivery routes differ by segment, with residential and light-commercial deployments typically flowing through packaged mCHP/OEM channels, while multi-megawatt stationary projects are sold directly to utilities, data center developers, and EPC partners under long-term service agreements designed to underwrite uptime requirements.
Competitive Landscape
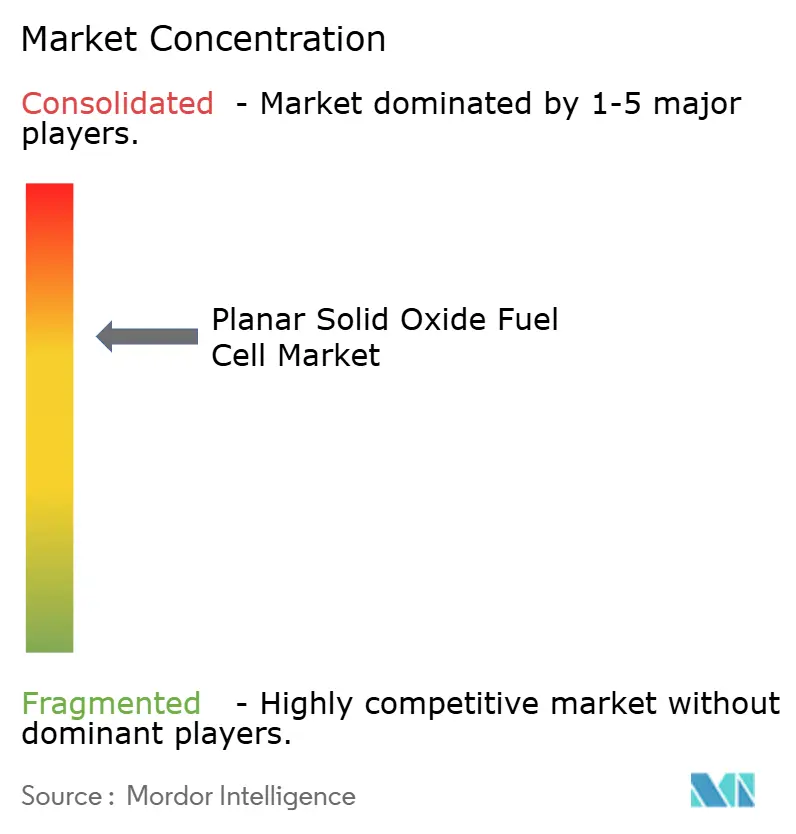
The planar solid oxide fuel cell market is moderately concentrated, with the top five suppliers accounting for approximately 55% of shipments in 2024. Bloom Energy leverages a vertically integrated stack and balance-of-plant design to win multi-megawatt data center and utility contracts, including the world’s largest fuel cell installation with SK Eternix. Ceres Power follows a capital-light licensing model, granting OEM partners manufacturing rights that accelerate regional scale-up in Asia and Europe. FuelCell Energy is narrowing its focus on distributed generation and large-scale electrolyzers after a 15% cost-reduction restructuring.
Mitsubishi Power is positioning reversible SOFC/SOEC units for industrial hydrogen hubs, while Doosan Fuel Cell plans to commercialize a transportation-focused planar stack in 2025. Maritime applications are a burgeoning white space, as evidenced by Alma Clean Power’s 100 kW ammonia-fueled prototype, which meets strict marine safety codes. Competitive strategy centers on cost leadership, fuel flexibility, and turnkey microgrid solutions, with cross-licensing deals and joint ventures serving as preferred entry points into newly liberalized hydrogen markets.
Planar Solid Oxide Fuel Cell Industry Leaders
Bloom Energy Corp.
Aisin Seiki Co Ltd
POSCO Energy Co. Ltd.
FuelCell Energy Inc
Doosan Fuel Cell Co., Ltd.
- *Disclaimer: Major Players sorted in no particular order
Planar Solid Oxide Fuel Cell Market Companies Covered in this Report
- Bloom Energy Corp.
- Mitsubishi Power (MHI)
- Aisin Corporation
- Ceres Power Holdings
- Doosan Fuel Cell Co., Ltd.
- FuelCell Energy Inc.
- Bosch (Robert Bosch GmbH)
- SOLIDpower S.p.A.
- Sunfire GmbH
- POSCO Energy
- Kyocera Corporation
- Fuji Electric Co., Ltd.
- Convion Ltd.
- Watt Fuel Cell Corp.
- Elcogen AS
- NGK Spark Plug (Niterra)
- AVL List GmbH
- Atrex Energy
- Adelan Ltd.
- Blue World Technologies
- Ceramic Fuel Cells Ltd.

Market Opportunities and Future Outlook
Data centers and other mission-critical commercial and industrial loads represent a key whitespace where planar SOFCs compete as modular, high-efficiency prime power and low-emission backup alternatives, particularly when grid constraints and diesel abatement are active procurement drivers. The market already shows signs of buyers contracting at multi-megawatt scale, including Bloom Energy deployments cited in the report context, such as a 20 MW utility order tied to Los Angeles resilience needs and deployments aligned to Singapore data center policy priorities. This points to standardized power blocks and repeatable project templates becoming central to go-to-market execution.
Manufacturing scale-up and product platformization are another tangible opportunity area, since reducing stack and system costs depends on throughput and yield at commercial facilities. In May 2026, Elcogen commissioned the 14,000 m2 ELCO I facility in Tallinn and launched the elcoStack E3000 G2 platform, with stated capacity expansion from 10 MW to 360 MW. That highlights how suppliers are moving from project-by-project builds toward mass-manufacturable stacks for both SOFC and SOEC lines. In parallel, reversible operation and coupling with hydrogen production programs supported by DOE and EU initiatives provide a pathway for industrial sites to value-plan dual use of assets across electricity generation and electrolysis, where carbon-intensity accounting and low-carbon hydrogen definitions are increasingly explicit in policy frameworks.
Recent Industry Developments in Planar Solid Oxide Fuel Cell Market
- May 2026: Bloom Energy disclosed a patent filing focused on a strontium-rich LSM air electrode for solid oxide electrochemical cells. The filing points to continued materials and electrode engineering aimed at improving performance and durability at the stack level. It also reinforces competitive differentiation through proprietary cell chemistry and manufacturing know-how.
- March 2026: Bloom Energy disclosed a patent filing related to fuel cell stack technologies. The filing highlights ongoing stack architecture refinement aimed at reliability and manufacturability in high-duty stationary applications. Such IP activity supports long-term cost reduction efforts by protecting process and design improvements as deployments scale.
- May 2024: Bloom Energy disclosed a patent filing describing binder jet printing approaches for metallic interconnects used in SOFC stacks. This reflects active work on advanced manufacturing methods for critical components that influence cost, throughput, and stack uniformity. If industrialized, additive approaches to interconnect production can shift supplier dynamics for metallic parts and coatings.


Planar Solid Oxide Fuel Cell Market Report Scope and Research Methodology
Market Definition and Coverage
This market covers revenue generated from planar solid oxide fuel cell systems and related stack level offerings used to produce electricity (often with heat recovery) across stationary and distributed power uses, tracked across major regions.
Scope exclusions: We exclude non-planar SOFC designs, upstream ceramic powder markets, and pure engineering services that are not sold as part of a planar SOFC product sale.
Segments Covered in This Report
- By Fuel Type
- Natural Gas/LNG
- Hydrogen
- Biogas/Syngas
- Ammonia and e-Fuels
- By Electrolyte Material
- Yttria-stabilised Zirconia (YSZ)
- Gadolinium-doped Ceria (GDC/CGO)
- Lanthanum Gallate-based (LSGM)
- Others (ScSZ, Composite)
- By Power Output
- Up to 5 kW
- 6 to 50 kW
- 51 to 250 kW
- 251 kW to 1 MW
- Above 1 MW
- By Application
- Stationary Power
- Combined Heat and Power (mCHP)
- Backup and Prime Power (Data Centres, Telecom)
- Auxiliary and Off-grid Units
- By End-User
- Commercial and Industrial
- Utilities and IPPs
- Data Centres
- Military and Defense
- Manufacturing
- Others (Residential, Education, Healthcare)
- By Geography
- North America
- United States
- Canada
- Mexico
- Europe
- Germany
- United Kingdom
- France
- Italy
- NORDIC Countries
- Russia
- Rest of Europe
- Asia-Pacific
- China
- India
- Japan
- South Korea
- ASEAN Countries
- Rest of Asia-Pacific
- South America
- Brazil
- Argentina
- Rest of South America
- Middle East and Africa
- Saudi Arabia
- United Arab Emirates
- South Africa
- Egypt
- Rest of Middle East and Africa
- North America
Data Sources, Market Sizing, and Validation
Desk Research
Desk work starts by building a clear picture of where planar SOFC demand is coming from and how it is reported publicly. We used non-paywalled sources such as the US Energy Information Administration for distributed generation signals, the US Department of Energy for fuel cell program context, the European Commission publications for hydrogen and clean power policy direction, and the International Energy Agency for power and fuel transition indicators.
Next, we reviewed manufacturer disclosures and public technical literature to keep the model anchored in typical system sizes and use cases. Sources included annual reports and investor decks, press releases on project announcements, conference papers, and peer reviewed journals that discuss SOFC efficiency and degradation behavior. Where helpful, we also used paid subscriptions for company financials and patent databases to support cross checks on scale-up activity. The desk sources mentioned here are illustrative, and many other public documents were used to compile, validate, and clarify the data points used in the model.
Primary Interviews and Surveys
Primary work was used to test the desk assumptions that most affect revenue, including average selling price ranges, typical fuel choices by application, and how shipment timing converts into recognized sales. We spoke with a mix of system suppliers, component providers, EPC and integration partners, and end users such as commercial sites, utilities, and data center operators across APAC, EMEA, and the Americas.
Distribution of primary research fieldwork respondents
| Company type | Respondent position | Region |
|---|---|---|
| Top tier: 37% | CXOs: 12% | APAC: 39% |
| Mid tier: 45% | Functional/Unit leaders: 40% | EMEA: 35% |
| Smaller Players: 18% | Managers: 48% | Americas: 26% |
Market-Sizing & Forecasting
We sized the market by reconstructing demand from the installed base and forward project pipeline for distributed and stationary power, then applying adoption and replacement logic that fits planar SOFC use cases. The totals are corroborated through selective bottom-up checks, such as sampled system ASP multiplied by estimated unit shipments by power band, followed by channel checks with integrators to adjust for timing gaps.
Several practical inputs guided the model, and we tracked them through the forecast window. These include typical kW and MW class deployment patterns, fuel mix (natural gas, hydrogen, biogas and emerging e-fuels), penetration of combined heat and power in commercial and industrial sites, and commissioning lead times that shift revenue recognition across years. Where project disclosures were incomplete, the gap was handled by using comparable project benchmarks from the same region and application, then stress testing the assumptions with interview feedback.
For forecasting, scenario analysis was used so the base case could be anchored to policy direction, fuel availability, and realistic manufacturing ramp-up, then checked against what customers say they can deploy. In years where the pipeline was thinner, the forecast relied more on replacement cycles and smaller distributed deployments, which are easier to validate with multiple sources.
Data Validation & Update Cycle
Validation is done by triangulating the model outputs against independent signals, then investigating variances before numbers are finalized. Our team checks for anomalies like revenue jumps that do not match project timing, implausible ASP drops, or regional totals that disagree with policy-led installation targets.
Before sign off, the model is reviewed in steps, first at the input level and then at the final totals level, so calculation errors and weak assumptions are caught early. If a key input changes materially or an outlier appears, we re-contact experts to confirm what is happening on pricing, deployment cadence, or fuel preference. Reports are refreshed annually, with interim updates when major policy or project announcements shift the demand outlook, and we perform a final review before delivery so clients receive the latest view.
Mordor Intelligence's Planar Solid Oxide Fuel Cell Market Size Compared Against Other Published Estimates
Published market numbers for planar SOFCs often do not line up, even when the time period looks similar, because each study draws the boundary in its own way. The biggest differences usually come from what is counted as revenue, which geographies are covered, and how project timing is translated into a given year value.
The table below highlights how scope choices, pricing logic, and refresh timing can shift the 2025 market size. Differences are also created when some estimates lean into aggressive adoption assumptions for hydrogen and data centers, while others hold closer to current commissioning schedules and disclosed capacity additions.
Benchmark comparison
| Source | Market Size | Gaps in Research Methodology |
|---|---|---|
| Mordor Intelligence | USD 1.03 B (2025) | |
| Global Consultancy A | USD 1.16 B (2025) | This estimate appears to include a wider revenue boundary around planar SOFC deployments, where adjacent balance-of-plant and integration value is blended into the market total more consistently. |
| Trade Journal B | USD 1.80 B (2024) | This figure is for a different base year and seems to apply a faster early adoption curve, which can inflate the near term total if project pipelines are not filtered for commissioning and revenue timing. |
The table shows a spread that is largely explained by what is counted around a planar SOFC sale and how quickly near term deployments are assumed to convert into revenue. In Mordor Intelligence's model, the 2025 value is tied to planar SOFC specific product revenues and timing checks on commissioning, which helps keep the number traceable to repeatable inputs instead of optimistic pipeline conversions.


Key Questions Answered in the Report
What is the current size of the planar solid oxide fuel cell market?
The market was valued at USD 1.12 billion in 2026 and is forecast to reach USD 1.74 billion by 2031.
How fast is the planar solid oxide fuel cell market expected to grow?
Industry revenues are projected to rise at a 9.09% compound annual growth rate through 2031.
Which fuel type holds the largest share of installed planar SOFC capacity today?
Natural-gas and LNG-fueled systems commanded 64.45% of global shipments in 2025.
Why are data-center operators adopting planar solid oxide fuel cells?
The technology delivers 60% electrical efficiency, approaches 90% total system efficiency with heat recovery and offers a cleaner alternative to standby diesel generators.
Which region is expanding the quickest?
North America leads in growth momentum with a forecast 10.53% CAGR, driven by policy incentives and hyperscale data-center construction.
What is the main cost barrier facing wider deployment?
Capital costs still range from USD 5 000 to 10 000 per kW for larger systems, although high-volume manufacturing could drive stack prices below USD 100 per kWe over the next decade.
Page last updated on:


 Your data is secure and never sold or shared.


