
Pipeline Pigging Services Market Size and Share
Market Overview
| Study Period | 2021 - 2031 |
|---|---|
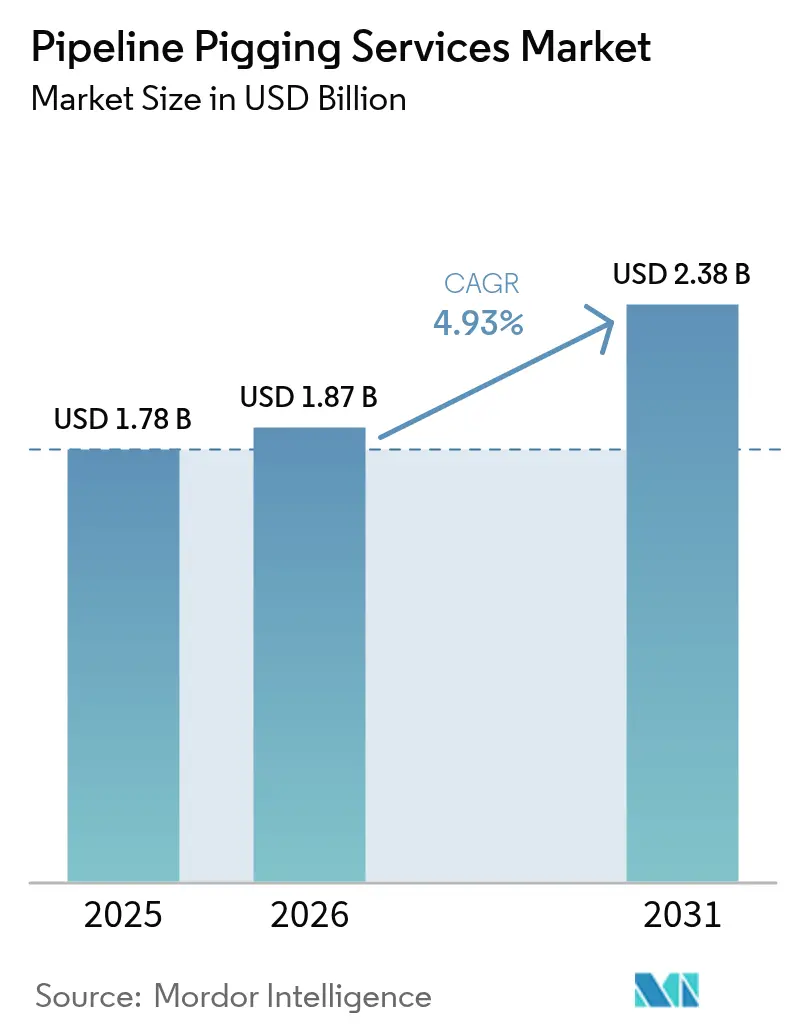
| Market Size (2026) | USD 1.87 Billion |
| Market Size (2031) | USD 2.38 Billion |
| Growth Rate (2026 - 2031) | 4.93 % |
| Fastest Growing Market | Asia Pacific |
| Largest Market | North America |
| Market Concentration | Medium |
Major Players *Disclaimer: Major Players sorted in no particular order Image © Mordor Intelligence. Reuse requires attribution under CC BY 4.0. | |
Pipeline Pigging Services Market Analysis by Mordor Intelligence
The Pipeline Pigging Services Market size is expected to grow from USD 1.78 billion in 2025 to USD 1.87 billion in 2026 and is forecast to reach USD 2.38 billion by 2031 at 4.93% CAGR over 2026-2031.
Regulatory tightening, accelerated integrity programs on aging pipelines, and rising adoption of intelligent inspection tools underpin this steady expansion. Mandates issued by the Pipeline and Hazardous Materials Safety Administration (PHMSA) in 2024, which incorporated more than 20 updated consensus standards, strengthened the obligation for in-line inspection of transmission lines, prompting operators to conduct more frequent, data-rich pigging campaigns[1]Pipeline and Hazardous Materials Safety Administration, “Notice of Proposed Rulemaking on Pipeline Repair Criteria,” phmsa.dot.gov. Capital spending on new cross-border lines in the Asia-Pacific and the Middle East, together with the rollout of AI-enhanced data analytics, is expanding service scope while raising technical thresholds for suppliers. At the same time, environmental requirements are driving innovation toward low-emission cleaning pigs, and competitive intensity is intensifying as regional specialists compete with global incumbents to secure high-value contracts.
Key Report Takeaways
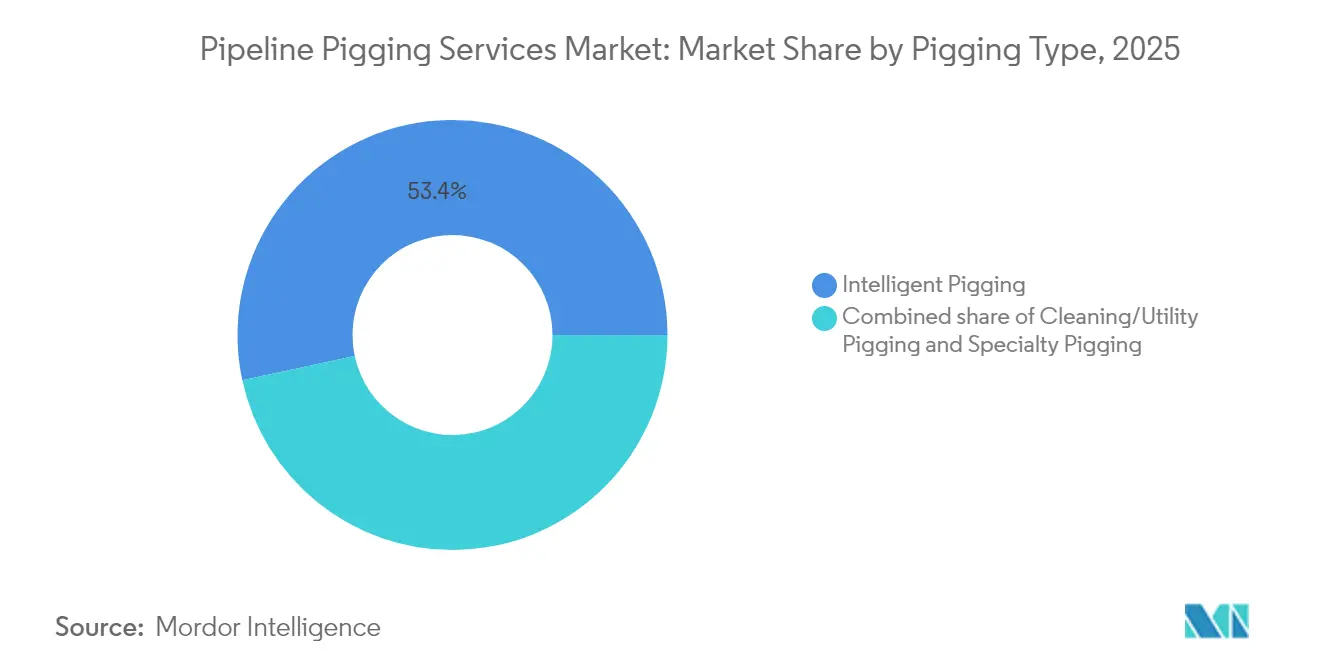
- By pigging type, intelligent pigging led with 53.38% of the pipeline pigging services market share in 2025; specialty pigging is projected to expand at a 7.58% CAGR to 2031.
- By pipeline fluid, crude oil pipelines accounted for a 39.08% share of the pipeline pigging services market size in 2025, while NGL & LPG lines are expected to register an 7.83% CAGR to 2031.
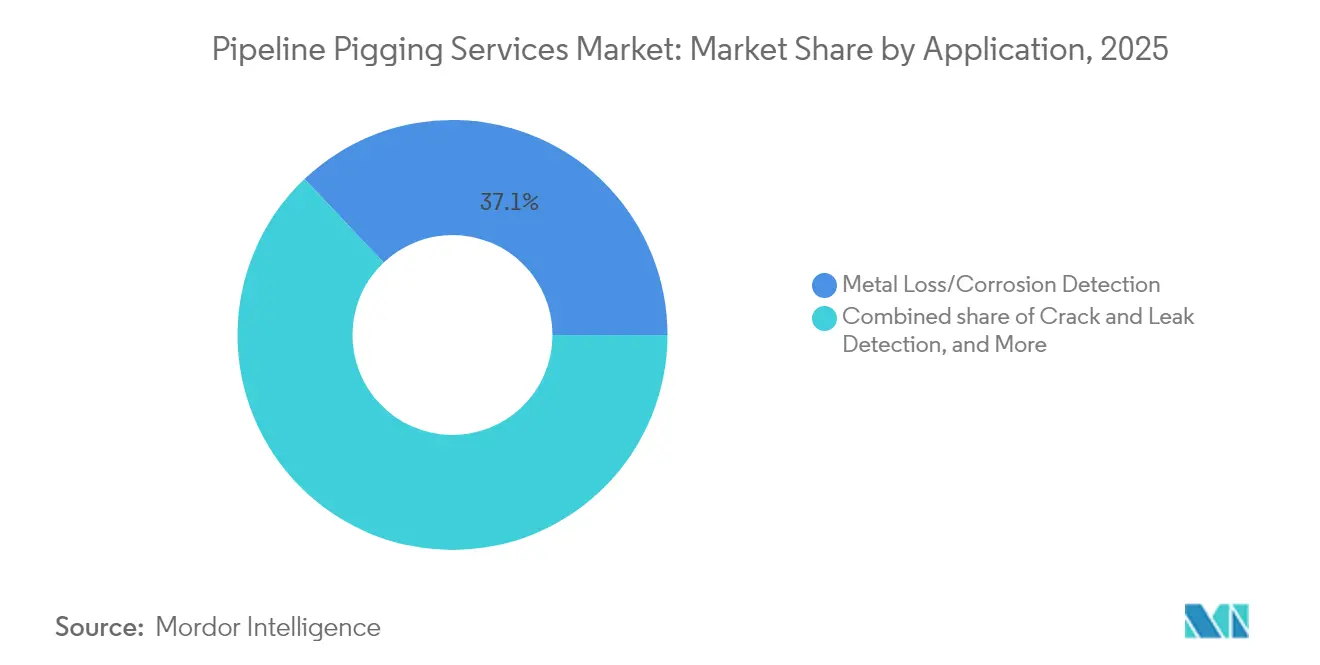
- By application, metal loss and corrosion detection held a 37.09% share of the pipeline pigging services market size in 2025; crack and leak detection is expected to advance at an 8.16% CAGR through 2031.
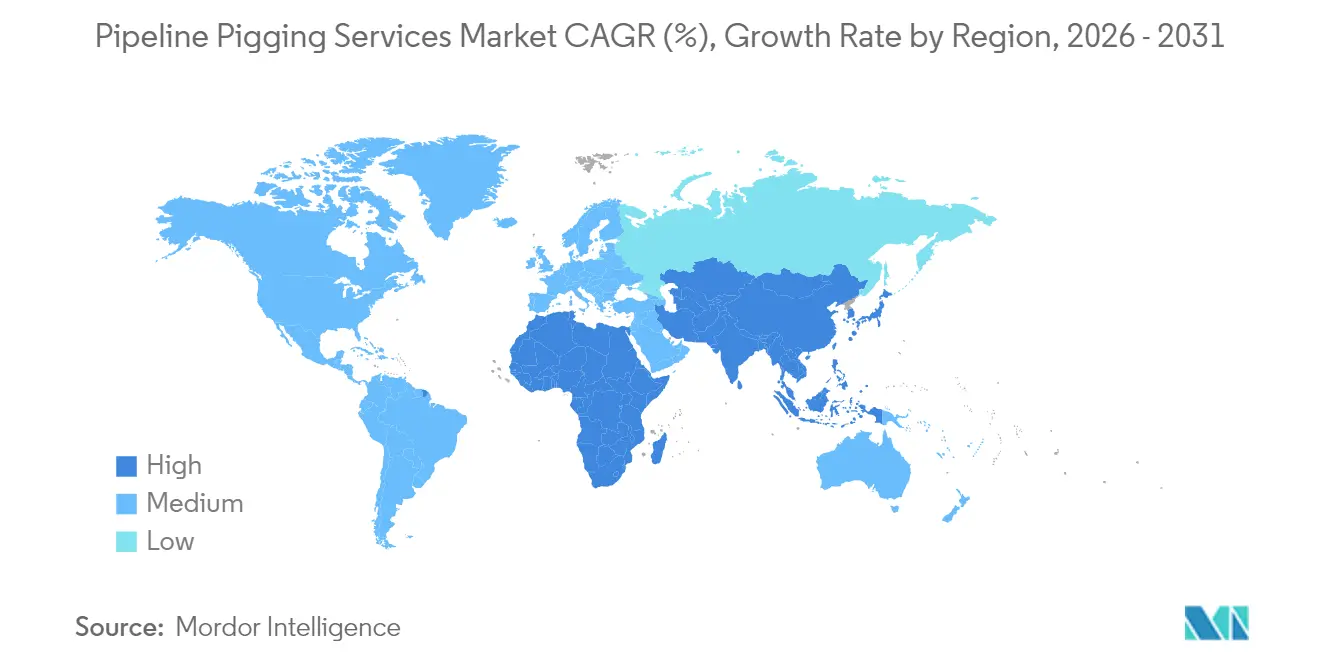
- By geography, North America dominated the market with a 40.71% revenue share in 2025; the Asia-Pacific region is forecast to post the fastest regional growth at a 6.61% CAGR from 2025 to 2031.
Note: Market size and forecast figures in this report are generated using Mordor Intelligence’s proprietary estimation framework, updated with the latest available data and insights as of 2026.
Market Trends and Insights
Drivers Impact Analysis of Pipeline Pigging Services Market*
| Driver | (~) % Impact on CAGR Forecast | Geographic Relevance | Impact Timeline |
|---|---|---|---|
| Regulatory mandates for periodic in-line inspection | +1.2% | North America & Europe core, global adoption spreading | Long term (≥ 4 years) |
| Aging global pipeline infrastructure nearing design life | +1.0% | North America & Europe, spreading to APAC | Long term (≥ 4 years) |
| Expansion of cross-border oil & gas networks | +0.8% | APAC core, spill-over to MEA and South America | Medium term (2-4 years) |
| Rising incident rate of corrosion failures | +0.7% | Mature pipeline regions worldwide | Medium term (2-4 years) |
| AI-driven analytics improving data interpretation | +0.6% | North America & Europe early adoption, APAC following | Short term (≤ 2 years) |
| Digital-twin adoption enabling predictive schedules | +0.5% | Global, led by North America | Short term (≤ 2 years) |
| Source: Mordor Intelligence | |||
Regulatory mandates for periodic in-line inspection drive market expansion
Continual refinement of safety statutes is enlarging the addressable base for intelligent pigging. In May 2025, PHMSA opened consultations to modernize repair timelines, a move that obliges operators of gas transmission lines in Class 3 and 4 areas to verify integrity at least once every decade, thereby increasing the frequency of in-line inspections. Requirements under 49 CFR 192.493 to control operating pressure during maintenance have boosted demand for specialized low-friction pigs that safeguard flow integrity. New minimum rupture-detection standards introduced in June 2024 added further impetus, as operators must now prove the efficacy of their leak detection programs with verifiable in-line data. Collectively, these mandates are shifting pigging from discretionary maintenance to a recurring compliance expenditure that only full-service vendors can reliably meet.
Aging infrastructure crisis accelerates pigging service demand
Large stretches of North American and European transmission lines were laid during the 1950s and 1960s and now approach or exceed their nominal design life. Material degradation, weld fatigue, and internal corrosion have correspondingly risen, prompting operators to initiate short-interval pigging cycles targeting metal-loss anomalies before they evolve into failures. The age profile also magnifies the need for specialty pigs capable of maneuvering tight bends and diameter changes common in legacy assets. Because every additional year in service heightens risk, asset owners are retaining pigging contractors on multi-year blanket agreements, locking in pipeline pigging services market revenues through the end of the decade.
Cross-border pipeline expansion fuels regional growth
The Asia-Pacific’s build-out features headline projects, such as China’s 5,111-kilometer East Route pipeline and India’s USD 1.3 billion, 2,800-kilometer LPG trunk line, which was commissioned in June 2025[2]U.S. Energy Information Administration, “International Natural Gas Pipelines Projects,” eia.gov. These mega-lines require pre-commissioning caliper runs, nitrogen purge cleaning, and integrity baseline surveys, creating immediate demand spikes followed by decades of recurring inspections. Cross-border ventures often include performance-based maintenance clauses, allowing service providers to command premium pricing for advanced pigs that can operate over long runs with mixed elevations and products. In turn, equipment portfolios are adapting to hydrogen, ammonia, and CO₂ streams as energy transition pipelines move from concept to construction.
AI-driven analytics transform pigging data interpretation
Machine-learning engines now parse terabytes of MFL and ultrasonic data in hours, rather than weeks, improving anomaly grading accuracy and reducing false positives. Penspen’s September 2024 tie-up with Senslytics exemplifies how vendors are fusing cloud analytics with traditional field services to deliver predictive maintenance dashboards that recommend optimal pigging intervals [3]Penspen Ltd., “Penspen Partners with Senslytics on AI Pipeline Integrity,” penspen.com. Operators running thousands of miles of lines gain fleet-wide visibility, allowing them to schedule pigs based on real-time corrosion growth rather than generic frequency rules. This shift improves uptime and sharpens budgeting precision, reinforcing a service-plus-software model that is reshaping competitive dynamics.
Restraints Impact Analysis of Pipeline Pigging Services Market*
| Restraint | (~) % Impact on CAGR Forecast | Geographic Relevance | Impact Timeline |
|---|---|---|---|
| High operational cost & downtime | -0.8% | Global, higher impact in cost-sensitive regions | Medium term (2-4 years) |
| Limitations in complex or “unpiggable” lines | -0.6% | Global, especially in legacy networks | Long term (≥ 4 years) |
| Safety risks causing delays and permits | -0.4% | Developed markets with strict oversight | Short term (≤ 2 years) |
| Environmental concerns over chemical pigs | -0.3% | North America & Europe core, expanding elsewhere | Medium term (2-4 years) |
| Source: Mordor Intelligence | |||
High operational costs challenge market adoption
Pigging requires partial or full flow stoppage, specialist crews, and sometimes large-diameter launching barrels. Offshore operators shoulder added vessel and ROV costs, pushing a single deepwater run above USD 1 million in extreme cases. During tight commodity cycles, smaller producers often defer non-statutory inspections, which depresses short-term volumes in the pipeline pigging services market. Incidents in the North Sea where pigs become stalled in low-flow conditions illustrate how costs escalate if retrieval campaigns are necessary. As a countermeasure, service companies are promoting multifunction pigs that combine cleaning and geometry tasks in one pass, cutting downtime and person-hours per inspection.
Limitations in complex or “unpiggable” pipeline geometries
Legacy gathering systems often contain miter bends, diameter reductions, or low-flow segments that conventional pigs cannot traverse. Gel and tethered pig technologies mitigate some constraints, yet they add engineering complexity and safety risks. For operators, redesigning sections to improve piggability competes with alternative strategies such as external corrosion direct assessment. Although specialty pigging is the fastest-growing niche, unresolved technical barriers in certain unpiggable lines continue to cap total serviceable mileage and restrain broader market penetration.
*Our forecasts treat driver/restraint impacts as directional, not additive. The impact forecasts reflect baseline growth, mix effects, and variable interactions.
Pipeline Pigging Services Market Segment Analysis
By Pigging Type:
Intelligence Drives Market LeadershipIntelligent pigging captured 53.38% of 2025 revenue, driven by MFL, ultrasonic, and EMAT technology, which provides verifiable, high-resolution wall-loss data demanded by regulators. That dominance is reinforced by large-diameter innovations, such as NDT Global’s 56-inch ultrasonic tool, released in collaboration with Saudi Aramco, which allows operators of major export pipelines to run a single inspection instead of multiple smaller tools. Cleaning and utility pigs continue to generate steady call-outs for wax and debris removal, yet the specialty category is rising at a 7.58% CAGR as custom-engineered gels, spheres, and bi-directional designs solve geometry challenges in aging assets. Service providers are expanding their consulting offerings to help clients interpret data and prioritize key insights, turning data services into a margin enhancer.
The pipeline pigging services market size for intelligent pigs is projected to exceed USD 1.31 billion by 2031 as risk-based inspection becomes mainstream. Intelligent pigs introduce digital twin inputs that shorten future planning cycles and boost safety conformance. Meanwhile, specialty pigs cater to hydrogen and CO₂ pilot lines where standard polymers may react with transported media, indicating further diversification potential.


By Pipeline Fluid Type:
Crude Oil Dominance, NGL Growth SurgeCrude oil pipelines accounted for 39.08% of global revenue in 2025, as extensive, often decades-old networks in North America, the Middle East, and Russia require routine inline verification to maintain flow assurance and meet spill-prevention regulations. The pipeline pigging services market size tied to crude lines is forecast to grow steadily as aging and capacity expansion offset moderation in volume growth. Conversely, NGL & LPG pipelines are expected to post an 7.83% CAGR as shale output scales in the United States and major greenfield projects go live in India and China. Liquefied gases demand pigs engineered for condensate management and low-temperature operation, opening technical niches for high-integrity seals and differential-pressure control systems.
Natural gas transmission remains a core service domain, especially where operators transition to hydrogen blends. Refined-product systems also provide incremental runs aimed at minimizing interface contamination between gasoline, diesel, and aviation fuels. Water and slurry lines constitute a small slice, but they are drawing attention in mining regions intent on boosting throughput through internal coating maintenance and regular cleaning.
By Application:
Corrosion Detection Leads, Crack Detection AcceleratesMetal-loss and corrosion detection retained a 37.09% share of 2025 revenue, as long-established steel assets are prone to thinning due to internal corrosion and external coating failure. Operators favor axial MFL and high-resolution UT tools to quantify defect depth, thereby directing excavation budgets efficiently. The pipeline pigging services market share for crack and leak detection remains smaller; yet, its 8.16% CAGR underscores the shift toward early-stage detection of fatigue and stress corrosion cracking, now mandated in high-consequence areas. Repeat in-line inspection, where consecutive runs overlay data, helps operators chart crack propagation and align repairs with outage schedules.
Crack and leak runs frequently integrate liquid-coupled phased-array UT sensors capable of sizing sub-millimeter defects at 10 mph tool speed, a specification valued in gas transmission lines that operate near allowable pressure limits. Geometry measurement, coupled with cleaning, remains essential for confirming bend radii and ovality deviations before smart pigs enter, thereby sustaining a dependable volume base for utility service fleets.
Geography Analysis
North America Pipeline Pigging Services Market
North America retained the largest regional share at 40.71% in 2025, supported by an estimated 2.7 million miles of active gathering, transmission, and distribution pipe. PHMSA rulemaking that strengthens rupture-mitigation measures and compresses repair windows is contributing to increased run volumes, while projects such as the 2 Bcf/d DeLa Express line, slated for service by 2028, will incorporate multi-station launcher and receiver infrastructure from the outset. Service providers benefit from deep client relationships, and advanced analytics hubs in Houston and Calgary anchor high-end data-interpretation contracts.
APAC Pipeline Pigging Services Market
Asia-Pacific is set to post the fastest growth at 6.61% CAGR through 2031, underpinned by China’s 38 bcm/y east-route gas line and India’s massive LPG corridor, both commissioned or fully operational by 2025. Regional policy goals aimed at expanding gas penetration in residential and industrial sectors translate into extensive new midstream grids requiring commissioning sweeps and periodic inspections. Rising hydrogen and ammonia pilot lines—such as Sinopec’s 400-kilometer hydrogen link financed at 20 billion yuan—add prospects for specialty pigging. Funding models in developing economies are increasing, stipulating life-cycle integrity contracts that lock in long-term service revenues.
EMEA and South America Pipeline Pigging Services Market
Europe keeps a stable outlook driven by life-extension needs on mature North Sea and continental grids. Strict environmental statutes and an aging asset base mean operators are adopting eco-friendly cleaning pigs that curtail chemical discharge. Digitalization programs accelerated by energy security concerns are driving more data analytics contracts toward vendors that can convert legacy run data into predictive maintenance dashboards. The Middle East & Africa, as well as South America, regions show mid-single-digit growth, as greenfield oil and gas export lines, along with regulatory modernization, gradually shift maintenance practices toward global benchmarks.

Regulatory Landscape
In the United States, PHMSA continues to tighten integrity and safety compliance through rulemaking and updates to 49 CFR Parts 192 and 195, shaping pigging campaigns and MAOP verification through repeatable, defensible integrity evidence. A final rule effective March 16, 2026 (Amdt. No. 192-155) updated class location change requirements for gas pipelines and allowed integrity-management-based alternatives for confirming or restoring MAOP.
PHMSA issued Direct Final Rules on April 24, 2026 updating referenced consensus standards used across gas and hazardous liquid programs, including updates tied to pipeline materials and corrosion methodologies (for example, incorporating an updated NACE SP0206 edition for Internal Corrosion Direct Assessment and updating ASTM and MSS standards referenced in Parts 192 and 195). ISO 13623:2017 remains a widely used international baseline for petroleum and natural gas pipeline transportation systems, including design provisions that influence pigging, isolation, and maintenance requirements in new builds and life-extension projects.
Competitive Landscape
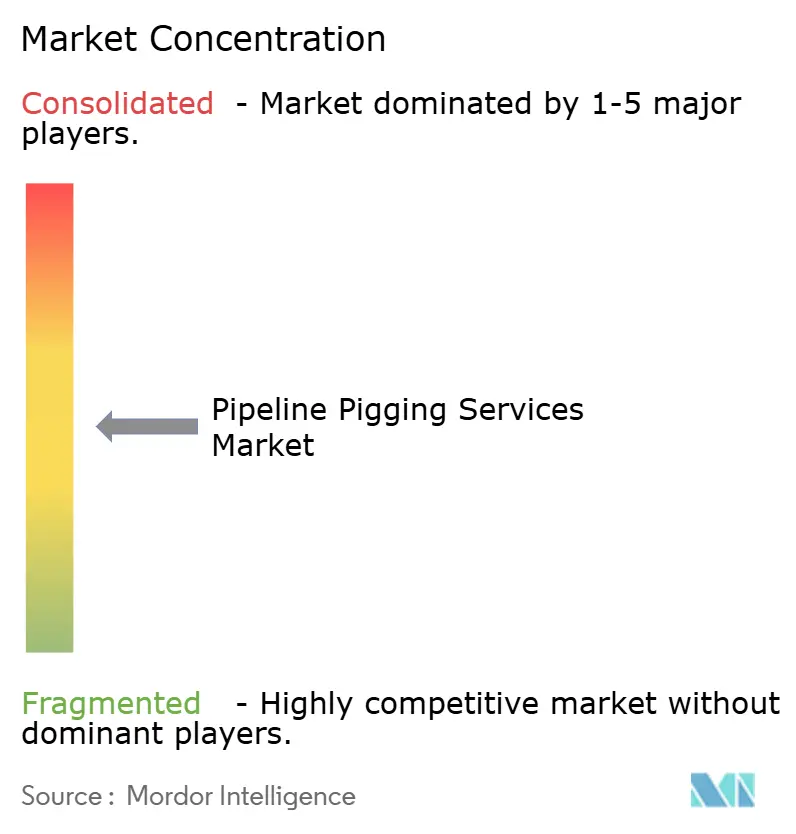
The global pipeline pigging services market is moderately fragmented. ROSEN Group, T.D. Williamson and Baker Hughes deploy multidisciplinary fleets that span high-resolution MFL, UT, cleaning, and specialty pigs, leveraging proprietary software to bundle inspection with analytics. Their dominance is challenged by niche specialists that focus on local permitting or unique tool formats. Overall differentiation centers on data quality, run-length capacity, and environmental performance. Strategic M&A continued in 2024 when T.D. Williamson acquired Petro-Line, gaining access to PETROSLEEVE repair technology, which enhances its dig-to-repair offering.
Technology competition now hinges on AI-driven workflows. Penspen’s partnership with Senslytics combines inspection databases with machine-learning engines, enabling the pair to position itself as an integrated integrity advisor rather than a transactional service vendor. White-space opportunities exist in emerging Asia-Pacific markets where pipeline growth outstrips local service capacity. Environmental leadership is another battleground: CNX Resources’ HydroPurge innovation, which claims 91% emission reduction during pigging, illustrates how green credentials can win bids with environmentally sensitive operators.
Price pressure persists in commoditized cleaning campaigns, but premium rates endure for intelligent runs on large-diameter or difficult-to-access assets. To safeguard margins, leading contractors are embedding long-term framework agreements that guarantee minimum run volumes and facilitate data subscription add-ons. Regional joint ventures remain a preferred route for foreign entrants seeking to comply with local content rules, especially in India and Saudi Arabia, where national energy companies retain significant procurement influence.
Pipeline Pigging Services Industry Leaders
ROSEN Group
T.D. Williamson, Inc.
Baker Hughes Company
NDT Global (Eddyfi/NDT)
STATS Group
- *Disclaimer: Major Players sorted in no particular order
Pipeline Pigging Services Market Companies Covered in this Report
- ROSEN Group
- T.D. Williamson, Inc.
- Baker Hughes Company
- NDT Global (Eddyfi/NDT)
- STATS Group
- Enduro Pipeline Services, Inc.
- Onstream Pipeline Inspection Ltd.
- IKM Group
- Romstar Sdn. Bhd.
- Dacon Inspection Services Co., Ltd.
- Penspen Limited
- Rouge Pipeline & Process Services
- Oil States Industries
- Applus+
- Inline Services, Inc.
- Quest Integrity (Team, Inc.)
- 3P Services GmbH
- A.Hak Industrial Services
- Pigtek Ltd.

Market Opportunities and Future Outlook
Opportunities are concentrated in compliance-driven upgrades to liquid pipeline engineering and maintenance programs, particularly where operators adjust procedures to newer referenced standards. In April 2026, PHMSA updated incorporation by reference for ASME B31.4 (Pipeline Transportation Systems for Liquids and Slurries) within 49 CFR Part 195 from the 2019 to the 2022 edition, pushing operators and service providers to reconcile inspection, testing, and maintenance practices with the updated code requirements, and creating room for vendors to convert code-driven changes into executable pigging scopes, documentation, and anomaly management.
Service differentiation is also moving toward integrated inspection plus analytics, building on the market shift already visible in AI-driven interpretation workflows. The Penspen and Senslytics collaboration announced in September 2024 to embed AI into pigging data interpretation highlights demand for faster anomaly grading and decision support, while work on high-viscosity and wax-prone lines and in complex geometries points to niches for specialty pigging and multi-function runs aimed at reducing downtime while improving data richness.
Recent Industry Developments in Pipeline Pigging Services Market
- April 2026: The SHiiELD double independent isolation and bleed system for pipeline isolation was launched, strengthening the isolation toolkit used during maintenance and integrity work. The release allows contractors to bundle isolation, inspection, and remediation under one work scope.
- June 2025: A strategic investment from funds managed by Apollo Global Management, with SCF Partners retaining majority ownership, supports scaling of technology development and service capacity in pipeline integrity and maintenance. This capital backing enhances competitiveness for multi-year framework agreements where operators seek assured tooling availability and rapid mobilization.
- December 2024: The acquisition of Petro-Line and the PETROSLEEVE technology closed, expanding TDW's repair and reinforcement capabilities alongside its inspection and maintenance portfolio. The broader dig-to-repair suite helps operators compress outage timelines by moving from ILI findings to rehabilitation with fewer vendors and interfaces.


Pipeline Pigging Services Market Report Scope and Research Methodology
Market Definition and Coverage
For this study, the pipeline pigging services market covers paid services delivered to run pigs inside pipelines to clean, inspect, and support integrity checks across liquid and gas pipeline networks, where revenue is counted at the service provider level.
Scope exclusions: We do not count sales of pigging tools or launcher and receiver hardware when they are sold as equipment without an accompanying service contract.
Segments Covered in This Report
- By Pigging Type
- Intelligent Pigging
- Cleaning/Utility Pigging
- Specialty Pigging (Gel, Bi-Directional, etc.)
- By Pipeline Fluid Type
- Crude Oil
- Refined Products
- Natural Gas
- NGL and LPG
- Water and Slurry
- By Application
- Crack and Leak Detection
- Metal Loss/Corrosion Detection
- Geometry Measurement & Bend Detection
- Cleaning and Debris Removal
- Commissioning and De-commissioning
- By Geography
- North America
- United States
- Canada
- Mexico
- Europe
- Germany
- United Kingdom
- France
- Italy
- NORDIC Countries
- Russia
- Rest of Europe
- Asia-Pacific
- China
- India
- Japan
- South Korea
- ASEAN Countries
- Rest of Asia-Pacific
- South America
- Brazil
- Argentina
- Rest of South America
- Middle East and Africa
- Saudi Arabia
- United Arab Emirates
- Qatar
- South Africa
- Egypt
- Rest of Middle East and Africa
- North America
Data Sources, Market Sizing, and Validation
Desk Research
Desk work was used to set the demand context and anchor the model inputs to observable pipeline activity. We referred to public energy statistics and outlooks such as those from the EIA, IEA, and OPEC, followed by safety and incident reporting guidance from agencies such as PHMSA, and then complemented this with operator disclosures and maintenance narratives in annual reports and investor presentations.
To keep assumptions realistic, we also reviewed customs and trade datasets where available for inspection and maintenance related equipment flows, patent databases for technology adoption signals in ILI tools, and standards and integrity guidance published by groups such as API and ASME. Reputed industry press and association websites were used to cross-check timing of major maintenance cycles, regulation-led inspection intervals, and regional project pipelines. These examples are illustrative only, and many other public and subscription sources were also consulted for data collection, validation, and research clarification.
Primary Interviews and Surveys
Primary discussions were used to translate pipeline activity into service demand and to pressure-test pricing and utilization assumptions. We spoke with service providers, pipeline operators, and technical advisors across key regions so that typical run frequency, the mix of cleaning versus inspection jobs, and practical downtime constraints could be validated, then applied consistently in the model.
Distribution of primary research fieldwork respondents
| Company type | Respondent position | Region |
|---|---|---|
| Top tier: 37% | CXOs: 19% | APAC: 42% |
| Mid tier: 41% | Functional/Unit leaders: 27% | EMEA: 37% |
| Smaller Players: 22% | Managers: 54% | Americas: 21% |
Market-Sizing & Forecasting
Sizing starts with a top-down build where pipeline length, age profile, and integrity compliance requirements are translated into an annual pool of pigging runs by region and by major fluid category. Those run volumes are then valued using typical service pricing logic (for example, job type mix, run complexity, tool type choice, and mobilization needs), with adjustments for offshore share and access constraints.
To keep totals from drifting, the outputs are checked against selective bottom-up approximations, such as sampled provider revenue ranges, channel checks on day rates, and inferred capacity utilization from crew and tool availability, before the final values are locked. Inputs that mattered most in this market included regulated inspection cadence, the share of smart inspection versus cleaning runs, average pipeline downtime tolerance, regional pipeline additions and rehabilitation activity, and inflation-linked cost pass-through.
For forecasting, we used scenario analysis supported by a light multivariate regression layer where macro indicators (oil and gas throughput outlook, midstream capex, and integrity-driven maintenance intensity) are used to explain demand swings. The slope is then moderated based on what experts expect for tool adoption and pricing resets. Where bottom-up checks had gaps, conservative fill rates were applied, then re-tested through follow-up calls so the model stayed reproducible with limited public data.
Data Validation & Update Cycle
Several checks are applied before final sign-off so the numbers stay consistent with real pipeline activity. Outliers are flagged when implied price per run, run frequency per kilometer, or regional growth rates move away from what interviews and public indicators suggest, and then the assumptions are revisited and documented.
A second analyst review is done to confirm calculations, units, and currency handling, followed by a final pass that tests whether key inputs still hold after the latest news and project updates. Reports are refreshed annually, and interim updates are made when material events occur, such as a major regulatory change, a visible shift in midstream spending, or a step-change in inspection backlog.
Mordor Intelligence's Pipeline Pigging Services Market Size Compared Against Other Published Estimates
Published market values for pipeline pigging services can look far apart because each publisher draws the boundary differently and uses its own assumptions on run frequency, pricing, and what counts as a pigging job versus adjacent integrity work. Differences in base year selection and currency timing also add noise, even when the topic name looks the same.
In practice, the biggest gaps come from whether the estimate is built around pipeline kilometers and inspection cadence, or if it leans more on broad oil and gas services spending, which can pull in unrelated field services. By tracking regulated inspection intervals, regional pipeline additions, and typical job mix splits, Mordor Intelligence keeps the 2026 value tied to a definable run-volume pool and avoids counting equipment-only sales as service revenue.
Benchmark comparison
| Source | Market Size | Gaps in Research Methodology |
|---|---|---|
| Mordor Intelligence | USD 1.87 B (2026) | |
| Industry Research Publisher A | USD 3.32 B (2024) | Uses a different base year and appears to apply a broader service boundary that can pull in wider pipeline maintenance activity beyond pigging-specific jobs, which shifts the starting value upward. |
| Market Data Aggregator B | USD 9.29 B (2024) | The scope looks expanded into inspection technology categories and wider integrity service revenue, and the sizing level is less tightly constrained to pigging run volumes and service-only revenue recognition, inflating the total. |
The spread in the table is mainly explained by scope edges, year alignment, and how service revenue is separated from equipment and wider integrity spending. When run volumes, job mix, and pricing assumptions are made explicit and then cross-checked with operator and provider feedback, the resulting market value stays easier to trace and repeat.


Key Questions Answered in the Report
What is the current size of the pipeline pigging services market?
The pipeline pigging services market size stood at USD 1.87 billion in 2026 and is projected to reach USD 2.38 billion by 2031.
Which pigging type generates the highest revenue?
Intelligent pigging leads, commanding 53.38% of 2025 revenue owing to stringent inspection regulations and superior data output.
Which region shows the fastest growth?
Asia-Pacific is expected to record the highest regional CAGR at 6.61% through 2031, propelled by large-scale pipeline construction in China and India.
What is the biggest growth restraint?
High operational cost, including downtime and specialized crew mobilization, represents the principal restraint, shaving an estimated 0.8% from forecast CAGR.
How are AI and digital twins influencing the market?
AI-driven analytics and digital-twin platforms enable predictive maintenance scheduling and faster data interpretation, reducing unnecessary pig runs and boosting market demand for high-value inspection services.
Which application segment is expanding the fastest?
Crack and leak detection is advancing at an 8.16% CAGR because of regulatory emphasis on early failure identification and advancements in ultrasonic inspection tools.
Page last updated on:


 Your data is secure and never sold or shared.


