
Photoinitiator Market Size and Share
Market Overview
| Study Period | 2020 - 2031 |
|---|---|
| Market Size (2026) | USD 2.07 Billion |
| Market Size (2031) | USD 3.23 Billion |
| Growth Rate (2026 - 2031) | 9.31 % |
| Fastest Growing Market | Asia-Pacific |
| Largest Market | Asia-Pacific |
| Market Concentration | Medium |
Major Players *Disclaimer: Major Players sorted in no particular order Image © Mordor Intelligence. Reuse requires attribution under CC BY 4.0. | |
Photoinitiator Market Analysis by Mordor Intelligence
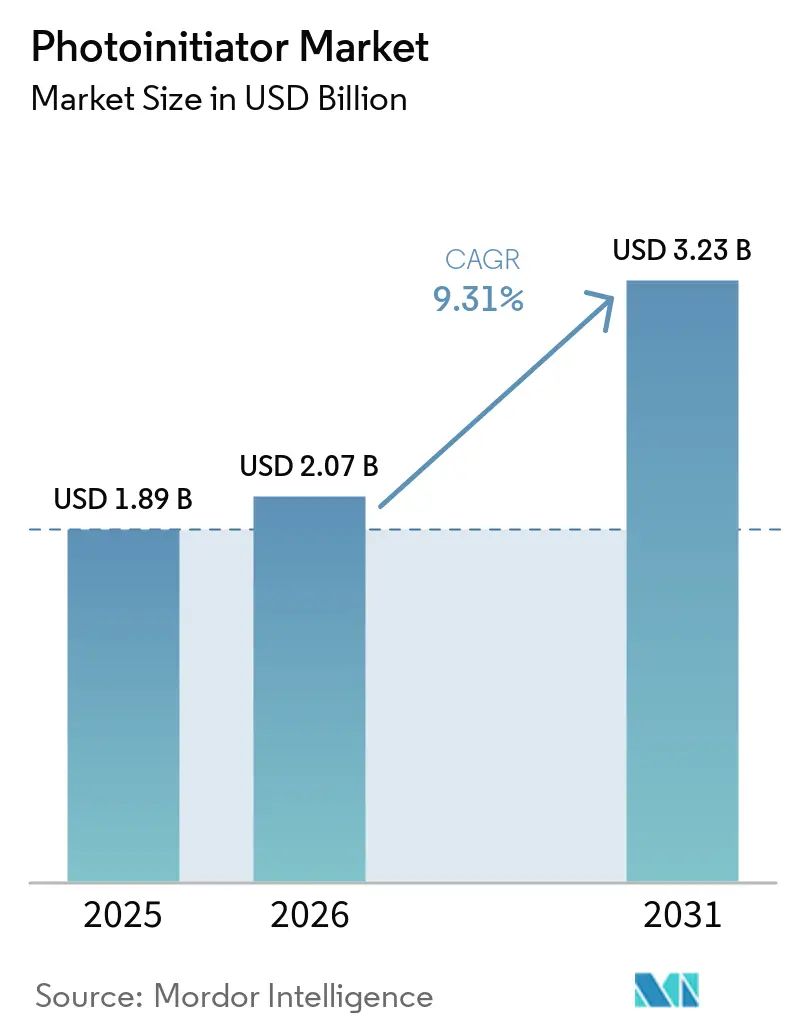
The Photoinitiator Market size was valued at USD 1.89 billion in 2025 and is estimated to grow from USD 2.07 billion in 2026 to reach USD 3.23 billion by 2031, at a CAGR of 9.31% during the forecast period (2026-2031). LED-centric curing processes are replacing broad-spectrum mercury lamps, so formulators are redesigning photoinitiator packages to absorb efficiently at 365 nm-405 nm wavelengths. Demand is also expanding as UV curing migrates from coatings and printing into electronics assembly, 3D printing, and biomedical devices. Manufacturers that master LED compatibility, low migration, and regulatory compliance now differentiate themselves, while raw-material volatility for acylphosphine oxides adds cost pressure. Asia Pacific remains the manufacturing nerve center, keeping the photoinitiator market tightly linked to regional electronics and packaging supply chains.
Key Report Takeaways
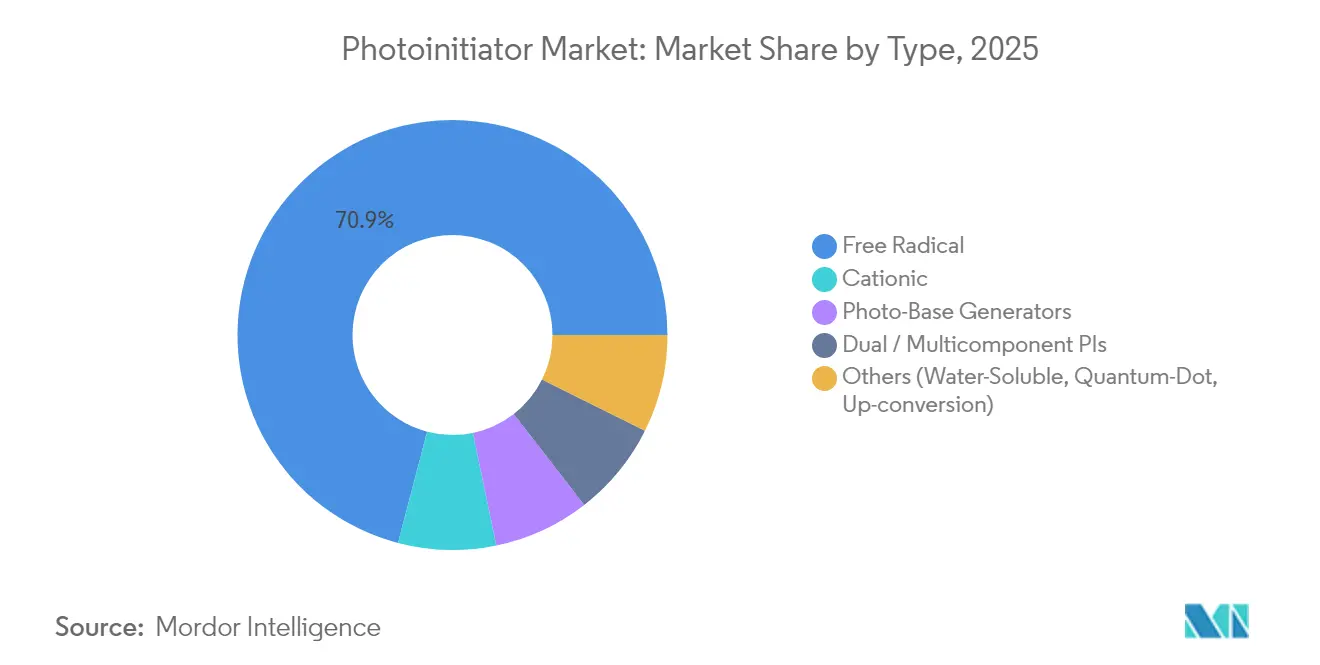
- By type, free-radical photoinitiators held 70.92% of photoinitiator market share in 2025, and the segment is tracking a 10.12% CAGR through 2031.
- By light source, UV mercury lamps accounted for 54.60% of the photoinitiator market size in 2025, but UV-LED systems post the fastest growth at a 9.98% CAGR.
- By application, coatings delivered 43.78% revenue share in 2025, while 3D printing and additive manufacturing is projected to expand at a 10.05% CAGR.
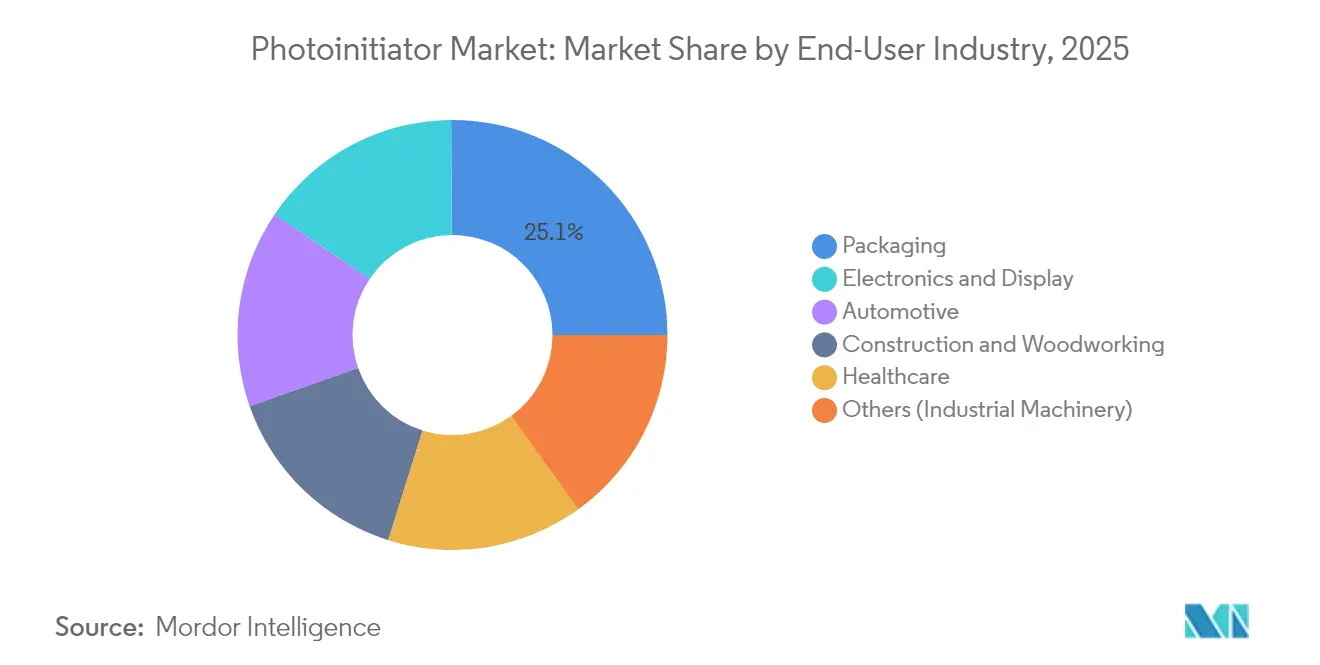
- By end-user industry, packaging captured 25.10% of the photoinitiator market size in 2025, whereas electronics and display applications lead in growth at 10.74% CAGR.
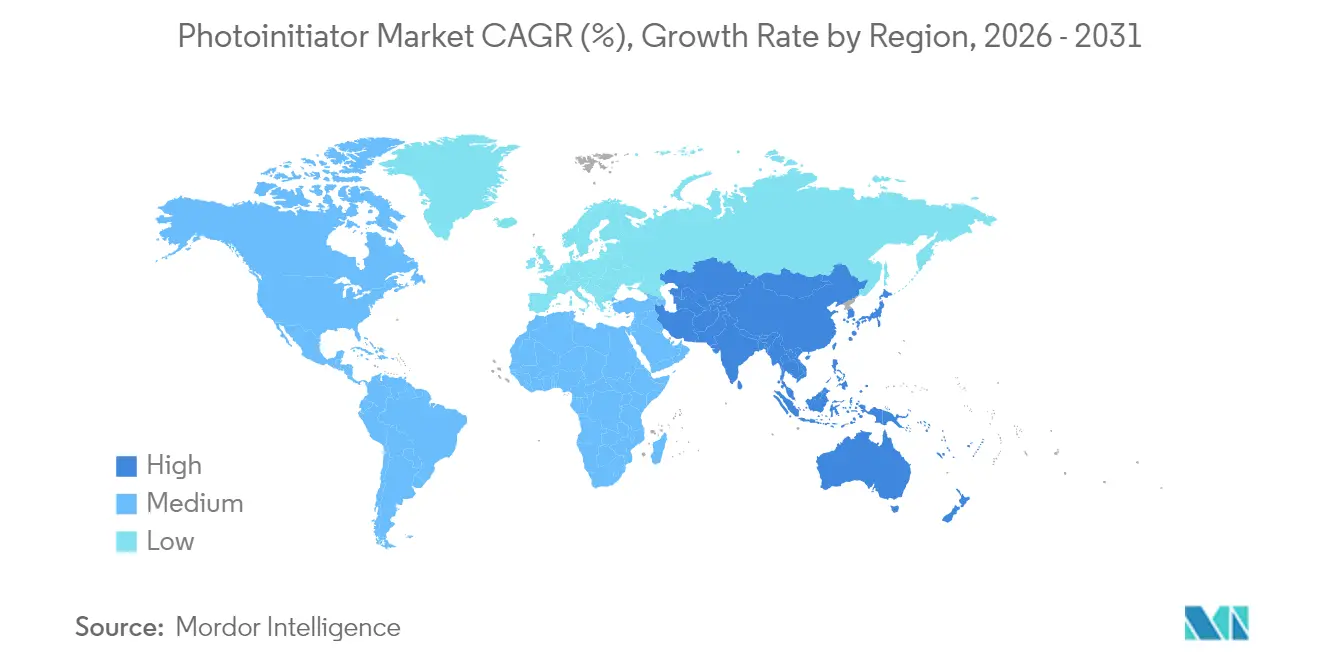
- By geography, Asia Pacific commanded 39.55% of the photoinitiator market share in 2025 and is set to climb at an 11.02% CAGR through 2031.
Note: Market size and forecast figures in this report are generated using Mordor Intelligence’s proprietary estimation framework, updated with the latest available data and insights as of 2026.
Market Trends and Insights
Drivers Impact Analysis of Photoinitiator Market*
| Driver | (~) % Impact on CAGR Forecast | Geographic Relevance | Impact Timeline |
|---|---|---|---|
| Surging demand from UV-LED printing & packaging | +2.8% | Global, with concentration in Asia Pacific and Europe | Medium term (2-4 years) |
| Expansion of 3D-printing photopolymers | +2.1% | North America & Europe, expanding to Asia Pacific | Long term (≥ 4 years) |
| Growth of dental & biomedical light-curing applications | +1.6% | Global, with premium segments in developed markets | Medium term (2-4 years) |
| Regulatory push for VOC-free industrial coatings | +1.4% | North America & EU, with spillover to Asia Pacific | Short term (≤ 2 years) |
| In-line UV curing in high-speed electronics assembly | +1.2% | Asia Pacific core, with expansion to Mexico and Eastern Europe | Medium term (2-4 years) |
| Source: Mordor Intelligence | |||
Surging Demand from UV-LED Printing & Packaging
UV-LED units deliver narrow-band light at 365-405 nm with higher photon density, so packaging converters must switch to initiators such as bis(2,4,6-trimethylbenzoyl)-phenylphosphine oxide (BAPO) that show strong absorption in that window and photobleach rapidly for deep cures. Food-contact compliance intensifies the need for low-migration grades, and the regulatory direction in the United States and European Union continues to tighten VOC limits, accelerating the LED shift[1]. Suppliers investing early in LED-ready chemistries gain favored status in pressroom retrofits across label and flexible-packaging lines.
Expansion of 3D-Printing Photopolymers
Digital light processing (DLP) and stereolithography (SLA) printers now move into manufacturing volumes, demanding initiators that perform in pigmented, high-viscosity, or ceramic-filled resins without sacrificing dimensional fidelity. Water-soluble charge-transfer packages enable cell-friendly hydrogel builds, while low-loading (0.1-0.5 wt%) BAPO formulations deliver stronger mechanical properties and faster layer times than legacy camphorquinone systems.
Growth of Dental & Biomedical Light-Curing Applications
Dental composites are trending away from yellow-tint camphorquinone toward acylphosphine oxides such as TPO and BAPO that cure under 405 nm LEDs and keep shades neutral. Yet cytotoxicity screening shows notable variance: BAPO rates highest in cellular stress, whereas MBF and TPOL record safer profiles, pushing formulators to balance cure kinetics and biocompatibility. Germanium-based initiators offer lower toxicity and red-shifted absorption but remain costly and niche.
Regulatory Push for VOC-Free Industrial Coatings
North American and European standards for architectural and maintenance coatings now cap VOCs so tightly that 100% solids UV systems have become the rule for metal and plastic components. BAPO-driven polyurethane acrylates meet corrosion and scratch thresholds without solvents, while thiol-ene-based waterborne UV coatings achieve full cure in sunlight with just 3 wt% initiator loading. Upconversion nanoparticle-assisted systems also open near-infrared curing for sections thicker than 2.5 cm.
Restraints Impact Analysis of Photoinitiator Market*
| Restraint | (~) % Impact on CAGR Forecast | Geographic Relevance | Impact Timeline |
|---|---|---|---|
| Toxicity concerns on benzophenone & TPO derivatives | -1.8% | Global, with stricter enforcement in North America & EU | Short term (≤ 2 years) |
| Rising raw-material prices for acylphosphine oxides | -1.2% | Global, with particular impact on cost-sensitive Asian markets | Medium term (2-4 years) |
| Supply bottlenecks for specialty photoinitiator precursors | -0.8% | Global, with concentration risk in specialized chemical suppliers | Short term (≤ 2 years) |
| Source: Mordor Intelligence | |||
Toxicity Concerns on Benzophenone & TPO Derivatives
Health Canada has listed benzophenone as toxic under Schedule 1, citing potential kidney and liver impacts, and regulators weigh similar moves on TPO derivatives, spurring converters to phase down suspect grades[2]. To stay ahead, formulators explore benzoxazin-2-one scaffolds that keep quantum yields high while avoiding classification triggers.
Rising Raw-Material Prices for Acylphosphine Oxides
A narrow global producer base for organophosphorus intermediates means outages or freight spikes flow straight into BAPO or TPO-L pricing. Trade actions on epoxy system inputs during 2024 added further volatility, so resin blenders began trialing liquid BAPO variants that ease handling and dosing but still command premiums.
*Our forecasts treat driver/restraint impacts as directional, not additive. The impact forecasts reflect baseline growth, mix effects, and variable interactions.
Photoinitiator Market Segment Analysis
By Type:
Free-Radical Dominance Drives InnovationFree-radical initiators generated 70.92% of the photoinitiator market in 2025 and are projected to grow at 10.12% CAGR to 2031. Their compatibility with acrylate and methacrylate systems underpins coatings, inks, and 3D-printing resins across every region. Cationic initiators retain niches in electronics encapsulation and fiber-optic coatings that require low shrinkage, while emerging photo-base generators crack oxygen inhibition issues in high-flex applications.
Structure-guided design now yields acyldiphenylphosphine oxide (ADPO) variants that absorb strongly at 395 nm but release lower yellowing by-products than legacy BAPO grades. Two-component systems pairing iodonium salts with meta-terphenyl photosensitizers further expand visible-light possibilities. As a result, the photoinitiator market size for free-radical grades could surpass USD 2.24 billion by 2031 if adoption stays on its present curve.

By Light-Source Compatibility:
LED Transition AcceleratesAlthough mercury lamps still occupy 54.60% of installed curing lines, LED modules now anchor new investments and will post a 9.98% CAGR. Their cool operation, instant on-off cycling, and lower energy draw resonate with converters under carbon-reduction mandates. The shift forces formulators to tailor absorption peaks: coumarin-iodonium hybrids respond at 365 nm, carbazolyl α-diketones perform under 405 nm-460 nm, and upconversion strategies unlock 780 nm-wavelength curing.
Within five years, the photoinitiator market size linked to LED platforms is expected to overtake mercury lamp demand, even though legacy lines will run until bulbs sunset. Suppliers balancing dual-platform portfolios will buffer revenue volatility during this crossover.
By Application:
Coatings Leadership Faces 3D-Printing DisruptionCoatings represented 43.78% of the photoinitiator market in 2025 and remain the cash generation backbone. Automotive clearcoats, metal cans, and wood flooring all exploit UV curing for throughput, durability, and VOC compliance. Metal substrates especially benefit as 100% acrylate films achieve full hardness in seconds and provide superior chip resistance.
However, 3D printing posts the highest momentum at a 10.05% CAGR. The photoinitiator market share for additive processes may still be single digits, yet production-scale SLA and DLP lines demand initiators capable of curing pigmented or ceramic-filled slurries without warpage. Safranin-triggered three-component packages deliver high resolution and low shrinkage, positioning them for aerospace and dental molds.
By End-User Industry:
Electronics Growth Outpaces Packaging BasePackaging held 25.10% of the photoinitiator market in 2025 thanks to labels, folding cartons, and flexible films that rely on rapid-cure inks. But electronics and displays will outstrip all other sectors at an 10.74% CAGR. Semiconductor fabs specify ultra-pure initiators with controlled ionic content to protect wafer yields, and display makers need formulations that avoid migration under high brightness operation.
Medical devices and dental products occupy a premium niche demanding ISO 10993 compliance and blue-light cures to minimize thermal load on tissues. Automotive growth stems from UV-bonded glass, battery potting, and scratch-resistant interiors, extending photoinitiator penetration beyond exterior clearcoats.
Geography Analysis
APAC Photoinitiator Market
Asia Pacific controlled 39.55% of the photoinitiator market in 2025 and should post 11.02% CAGR until 2031. China anchors PCB and display production, Japan refines high-purity grades for photoresist makers, and South Korea drives demand from advanced memory and OLED lines. The photoinitiator market size in Asia could exceed USD 1.28 billion by 2031 as regional converters invest in LED retrofits to curb energy usage.
North America Photoinitiator Market
North America focuses on high-value, regulated niches - aerospace composites, healthcare disposables, and specialty graphics - where performance counts more than cost. BASF’s shift toward bio-based ethyl acrylate underpins a broader trend to embed renewable monomers in UV systems, and the United States Food and Drug Administration’s migration limits guide photoinitiator selection.
Europe Photoinitiator Market
Europe prioritizes REACH compliance and circular-economy goals. Automakers headquartered in Germany and France adopt UV coatings to shorten bake cycles and lower CO₂ footprints. Legislators’ scrutiny of benzophenone, TPO, and potential endocrine disruptors keeps European formulators on a fast track to safer scaffolds. Consequently, the region invests heavily in quantum-dot and bio-based photoinitiator R&D.
Regulatory Landscape
European regulatory oversight remains anchored in ECHA REACH substance evaluation and restriction processes, which can affect the availability of traditional low-molecular-weight photoinitiators such as benzophenone and isopropyl thioxanthone due to migration concerns in food-contact packaging. In 2025, US tariff policies and trade countermeasures increased landed-cost uncertainty and led producers to re-examine regional production strategies.
Beyond REACH, global frameworks including TSCA and OSHA continue to require rigorous testing and reformulation, raising compliance costs for aromatic ketones and phosphine oxide photoinitiators.
Value Chain Analysis
The value chain starts with upstream petrochemical and organophosphorus intermediates that feed synthesis of key photoinitiator chemistries such as aromatic ketones, thioxanthones, and acylphosphine oxides. Photoinitiator manufacturers then supply standard grades and custom blends to formulators of UV-curable inks, coatings, adhesives, and 3D printing resins, which are converted by printers and coaters and incorporated into end uses spanning packaging, electronics and displays, automotive, construction and healthcare.
Lead times for standard grades run about 4 to 8 weeks, and they extend to 12 to 18 weeks for specialty or custom formulations.
Competitive Landscape
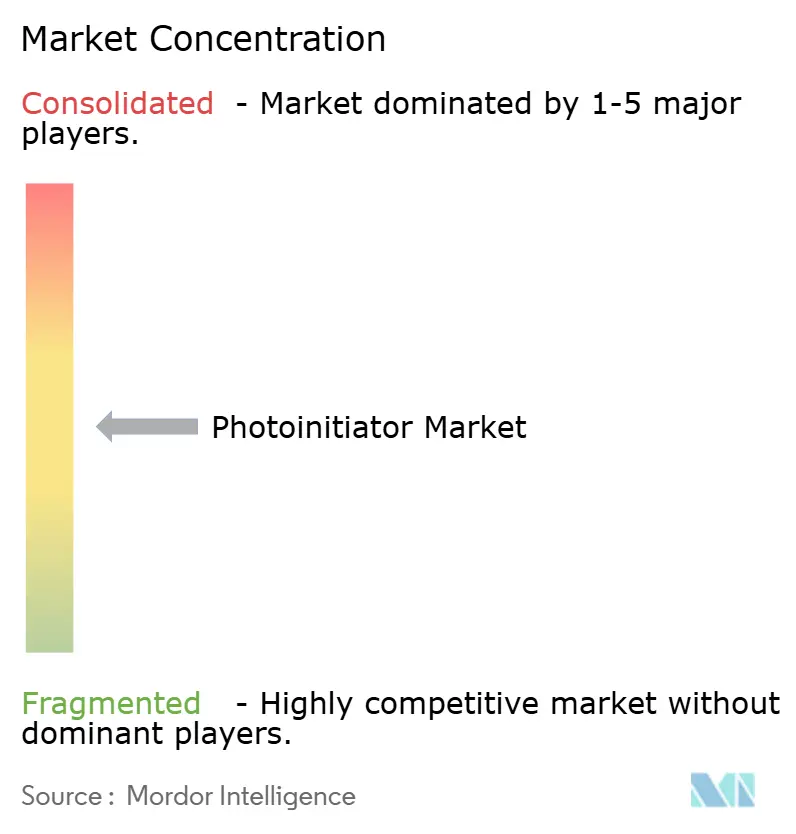
The photoinitiator market remains moderately concentrated. BASF, Arkema, and IGM Resins hold solid portfolios spanning free-radical, cationic, and specialty LED grades. Arkema’s EUR 45 million acquisition of Lambson in 2019 strengthened its composite and 3D-printing line-card. BASF leverages upstream monomer integration to cushion raw-material spikes, while IGM Resins differentiates through regional production and custom blends.
Asian suppliers such as Changzhou Tronly and Tianjin Jiuri compete fiercely on commodity free-radical initiators, benefiting converters sensitive to cost. Specialty entrants target migration-safe or water-dispersible chemistries; Everlight Chemical’s 2023 launch of a water-compatible initiator illustrates this niche strategy. Intellectual-property filings in acylgermane and carbide-based initiators indicate a pipeline of visible-light solutions poised to challenge incumbents.
Photoinitiator Industry Leaders
-
Arkema
-
IGM Resins
-
Tianjin Jiuri New Materials Co. Ltd
-
BASF
-
ADEKA Corporation
- *Disclaimer: Major Players sorted in no particular order
Photoinitiator Market Companies Covered in this Report
- ADEKA Corporation
- Allnex GmbH
- Arkema
- BASF
- Changzhou Tronly New Electronic Materials Co., Ltd.
- Clariant AG
- Covestro AG
- DOUBLE BOND CHEMICAL IND. CO., LTD
- Environ Speciality Chemicals Pvt. Ltd.
- Eutec Chemicals Co. Ltd.
- Evershine Chemical Industries
- IGM Resins
- New Sun Poly Tec Co. Ltd
- Polynaisse (Shanghai Baorun Chemical Co., Ltd.)
- Rahn AG
- TCI Chemical Co.
- Tianjin Jiuri New Materials Co. Ltd
- Zhejiang Yangfan New Materials Co. Ltd
Market Opportunities and Future Outlook
Formulators are moving toward self-curable and polymeric photoinitiators for sensitive food-contact and medical applications, as reflected in iGM Resins Photomer SC91 and Omnipol BL 582 that target low migration and improved process speeds. LED-optimized curing chemistries also continue to drive formulation evolution, with Asia-Pacific staying both a demand center and a production hub for electronics and packaging.
As distribution expands into India and other regional channels, suppliers can support faster qualification cycles and provide local technical service for UV-LED compatible systems.
Recent Industry Developments in Photoinitiator Market
- July 2026: A portion of the 18,340 t/y photo-curing materials and photoresist intermediate project at Shandong Jiuri Chemical Technology Co. Ltd. has entered the production stage. Tianjin Jiuri New Materials Co. Ltd. reported the update, signaling strengthened local supply chains for electronics-related UV-curable materials.
- February 2026: Arkema and Senior signed a memorandum of understanding to collaborate on next-generation battery materials, including separator coatings and adhesive-related technologies. The partnership aligns with broader UV-curable adhesive and coating development needs in electrification supply chains.
- December 2025: IGM Resins announced an exclusive distribution partnership with IDCC Global Chem Private Limited for India, effective January 1, 2026. The arrangement supports faster customer qualification and technical support for UV-curable formulations in a growing converting base.
Photoinitiator Market Report Scope and Research Methodology
Market Definition and Coverage
For this study, the market is defined as revenues generated from photoinitiators used to trigger polymerization in UV and UV-LED curing systems across inks, coatings, adhesives, and related formulations, and it is measured on a global value basis in USD.
Scope exclusions: The sizing excludes UV equipment, lamps, and resins/oligomers unless the value is specifically attributable to photoinitiator content.
Segments Covered in This Report
- By Type
- Free Radical
- Cationic
- Photo-Base Generators
- Dual / Multicomponent PIs
- Others (Water-Soluble, Quantum-Dot, Up-conversion)
- By Light-Source Compatibility
- UV Mercury Lamps
- UV-LED (UVA)
- Visible-LED / Blue Light
- Near-Infrared (Up-conversion Assisted)
- By Application
- Adhesives and Sealants
- Printing Inks
- Coatings
- 3D Printing / Additive Manufacturing
- Others
- By End-User Industry
- Packaging
- Automotive
- Construction and Woodworking
- Healthcare
- Electronics and Display
- Others (Industrial Machinery)
- By Geography
- Asia-Pacific
- China
- Japan
- India
- South Korea
- Rest of Asia-Pacific
- North America
- United States
- Canada
- Mexico
- Europe
- Germany
- United Kingdom
- France
- Italy
- Rest of Europe
- South America
- Brazil
- Argentina
- Rest of South America
- Middle East and Africa
- Saudi Arabia
- South Africa
- Rest of Middle East and Africa
- Asia-Pacific
Data Sources, Market Sizing, and Validation
Desk Research
Desk work starts with building the demand map for UV curing and then linking it back to photoinitiator consumption by application. We use public sources such as USGS chemical and minerals statistics, UN Comtrade trade data, US International Trade Commission import and tariff records, European Chemicals Agency (ECHA) dossiers, and EPA chemical substance resources to anchor supply, trade flow direction, and regulatory pressure points.
To set realistic price and mix assumptions, we also review company annual reports and investor presentations, patent databases, and technical papers from journals covering radiation curing and polymer chemistry. Where needed, paid subscriptions for company financials and shipment-level import/export databases are used to cross-check producer scale and regional sourcing signals. This list is illustrative only, and other public and paid sources were referred to for data collection, validation, and clarification.
Primary Interviews and Surveys
Primary work is used to pressure-test the desk assumptions on how quickly UV-LED is replacing mercury lamps, and how that shifts photoinitiator loading, blends, and pricing in real contracts. We speak with a mix of raw material stakeholders, formulators, and downstream users across major manufacturing hubs, then re-check any wide variances with follow-up questions before finalizing the model.
Distribution of primary research fieldwork respondents
| Company type | Respondent position | Region |
|---|---|---|
| Top tier: 37% | CXOs: 13% | APAC: 47% |
| Mid tier: 49% | Functional/Unit leaders: 43% | EMEA: 29% |
| Smaller Players: 14% | Managers: 44% | Americas: 24% |
Market-Sizing & Forecasting
Sizing starts with a top-down build where UV-curing demand is reconstructed by application using production and trade indicators, and then translated into photoinitiator value using typical formulation inclusion rates and regional pricing ranges. We corroborate those totals with selective bottom-up checks, including a roll-up of visible supplier revenues where disclosures exist, and sampled ASP x volume logic from channel discussions, which are then used to adjust outliers.
Key inputs in the model include UV-curable inks and coatings output trends, UV-LED adoption pace by printing and industrial coating lines, average photoinitiator loading rates by chemistry family, regulatory-driven substitution toward low-migration grades, and regional price movement tied to key intermediates. Because several drivers move together, forecasting is run using scenario analysis with a small set of agreed variables (such as UV-LED penetration, packaging print volumes, and average selling price progression). The scenarios are calibrated to what interviewees expect as the most likely path. When a bottom-up datapoint is missing for a country or niche application, the gap is handled through proxy ratios using similar end-use intensity and trade exposure, then reviewed against regional demand signals.
Data Validation & Update Cycle
Validation happens through multiple checks that look for mismatches between the modeled value and independent signals, such as trade movements, capacity announcements, and downstream UV-curable demand trends. Any sharp jumps are investigated, and assumptions are re-checked with fresh calls when the variance cannot be explained by price, mix, or a one-time event.
Before sign-off, the model goes through peer review, and the final numbers are inspected again for currency conversion timing, unit consistency, and year-on-year logic. Reports are refreshed annually, and interim updates are made when there are material changes such as regulatory actions or a major capacity shift. Right before delivery, we do a final pass so clients receive the latest updated view.
Mordor Intelligence's Photoinitiator Market Size Measured Against Other Published Estimates
Published market sizes for photoinitiators can vary because the counting rules are not always the same, even when the title looks identical. Differences usually come from what gets included in scope, how UV-LED transition is translated into demand, and how pricing is converted and normalized across regions.
When the model is refreshed, the timing of FX conversion and the way average selling prices are stepped through the year can materially move the current-year value, especially because raw-material swings and grade mix changes are common in this space. The main check that keeps the estimate tied to real buying behavior is that the UV-curable demand pool and the implied photoinitiator loading rates are re-validated during the update cycle, a refresh-led choice applied by Mordor Intelligence.
Benchmark comparison
| Source | Market Size | Gaps in Research Methodology |
|---|---|---|
| Mordor Intelligence | USD 2.07 B (2026) | |
| Industry Publisher A | USD 0.61 B (2025) | Often represents a narrower definition focused on merchant photoinitiators sold into select UV-curing uses, and it may exclude captive consumption and higher-value specialty blends, which lowers the reported value. |
| Independent Research B | USD 2.23 B (2025) | Uses a different base year and can assume faster ASP expansion or higher UV-LED driven volume uplift without the same level of cross-checking against downstream print and coatings output signals, which raises the starting point. |
The comparison shows that the widest gaps are explained by scope boundaries and the year and pricing mechanics used to translate volumes into USD value. By keeping the demand pool tied to end-use activity and then re-checking price and loading assumptions during updates, the final number stays traceable to a small set of repeatable inputs rather than one-off scaling factors.
Key Questions Answered in the Report
What is the size of the photoinitiator market?
The Photoinitiator Market size was valued at USD 1.89 billion in 2025 and is estimated to grow from USD 2.07 billion in 2026 to reach USD 3.23 billion by 2031, at a CAGR of 9.31% during the forecast period (2026-2031).
What is driving the rapid growth of the photoinitiator market?
The transition to energy-efficient LED curing, expanding 3D-printing applications, and stringent VOC regulations collectively propel demand across coatings, packaging, and electronics.
Why are LED-compatible photoinitiators important?
LED lamps emit narrow-band light, so initiators must absorb intensely at 365 nm-405 nm to ensure fast, full cures while meeting energy-saving goals.
What regulatory issues affect photoinitiator selection?
Restrictions on benzophenone and VOC emissions push formulators toward low-migration, non-toxic, and solvent-free UV-curable systems.