
Photoelectric Sensor Market Size and Share
Market Overview
| Study Period | 2020 - 2031 |
|---|---|
| Market Size (2026) | USD 2.16 Billion |
| Market Size (2031) | USD 3.05 Billion |
| Growth Rate (2026 - 2031) | 7.12 % |
| Fastest Growing Market | Middle East and Africa |
| Largest Market | Asia Pacific |
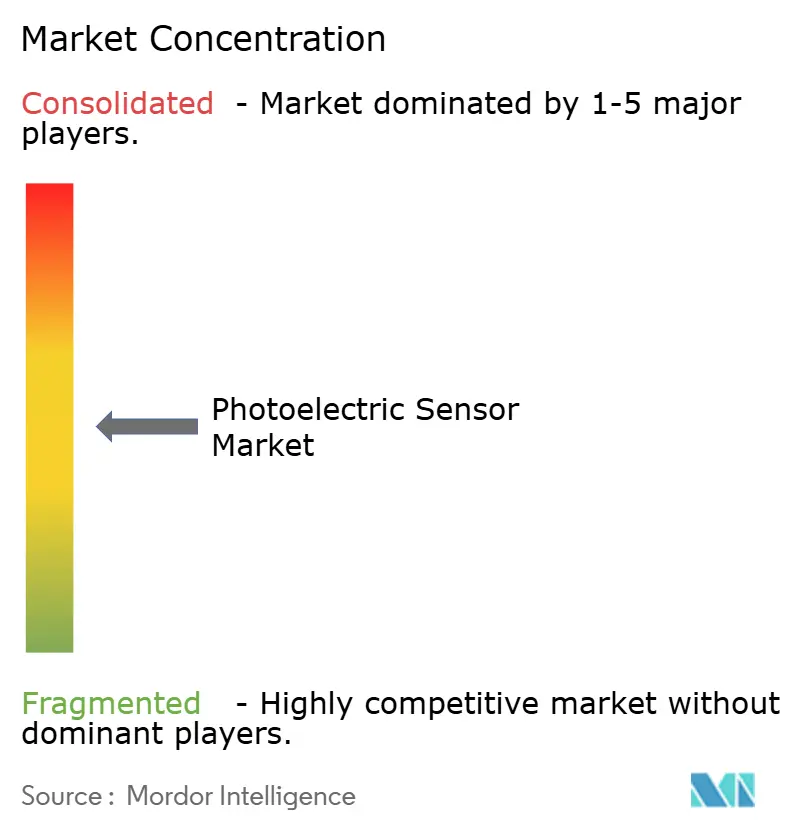
| Market Concentration | Medium |
Major Players *Disclaimer: Major Players sorted in no particular order Image © Mordor Intelligence. Reuse requires attribution under CC BY 4.0. | |
Photoelectric Sensor Market Analysis by Mordor Intelligence
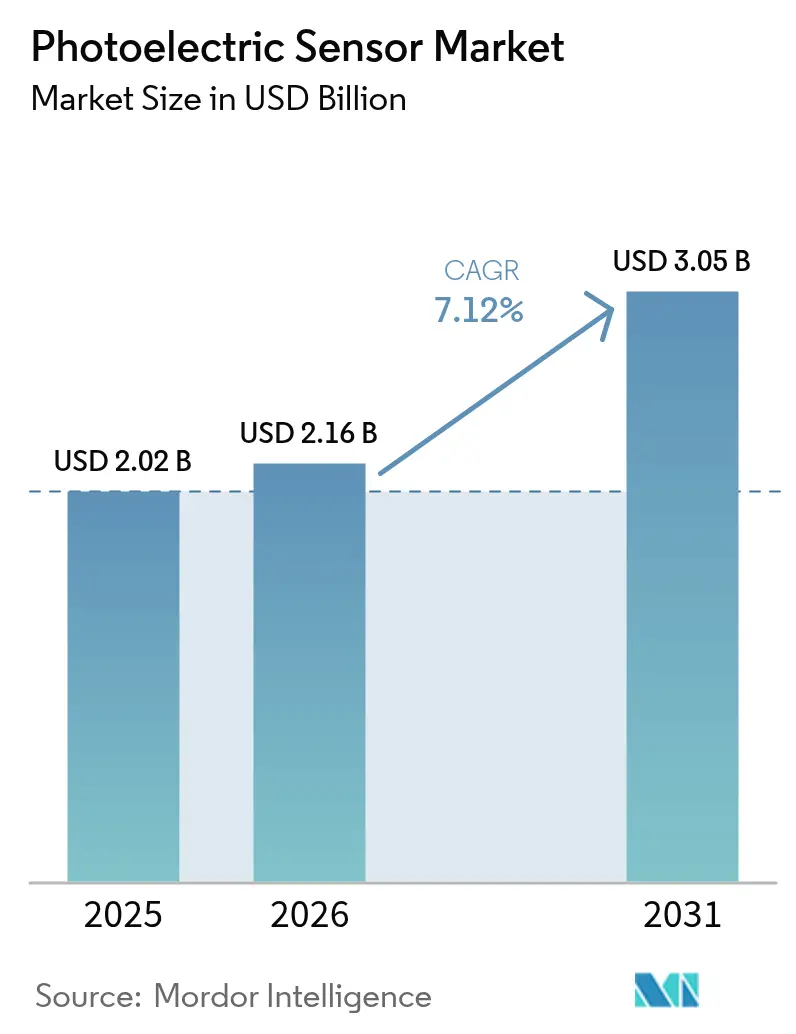
The photoelectric sensor market size is expected to grow from USD 2.02 billion in 2025 to USD 2.16 billion in 2026 and is forecast to reach USD 3.05 billion by 2031 at 7.12% CAGR over 2026-2031. This growth reflects a global pivot toward hyper-automated production lines that rely on precise object detection and positioning. Wider access to government tax credits for smart-factory retrofits, rapid Industry 4.0 rollouts, and declining prices for high-power laser emitters are reinforcing demand. Industrial users also benefit from AI-enabled self-calibration that cuts maintenance labour requirements by close to 30%, pushing total cost of ownership down. Quality-driven sectors such as food, beverage, and pharmaceuticals now view safety-rated photoelectric sensors as non-negotiable, particularly after the introduction of the new IEC 61496-5 standard.
Key Report Takeaways
- By product category, laser sensors held a 33.58% photoelectric sensor market share in 2025 while background-suppression sensors are set to grow at a 10.05% CAGR from 2026-2031.
- By detection technology, through-beam solutions commanded 40.62% of the photoelectric sensor market size in 2025, whereas background-suppression will lead growth.
- By housing style, cylindrical units captured 44.32% photoelectric sensor market share in 2025 while PCB-mount devices are forecast to expand at 10.62% CAGR through 2031.
- By end-user industry, automotive and e-mobility represented 25.45% of the photoelectric sensor market size in 2025; pharmaceuticals and medical devices will grow fastest at 11.88% CAGR to 2031.
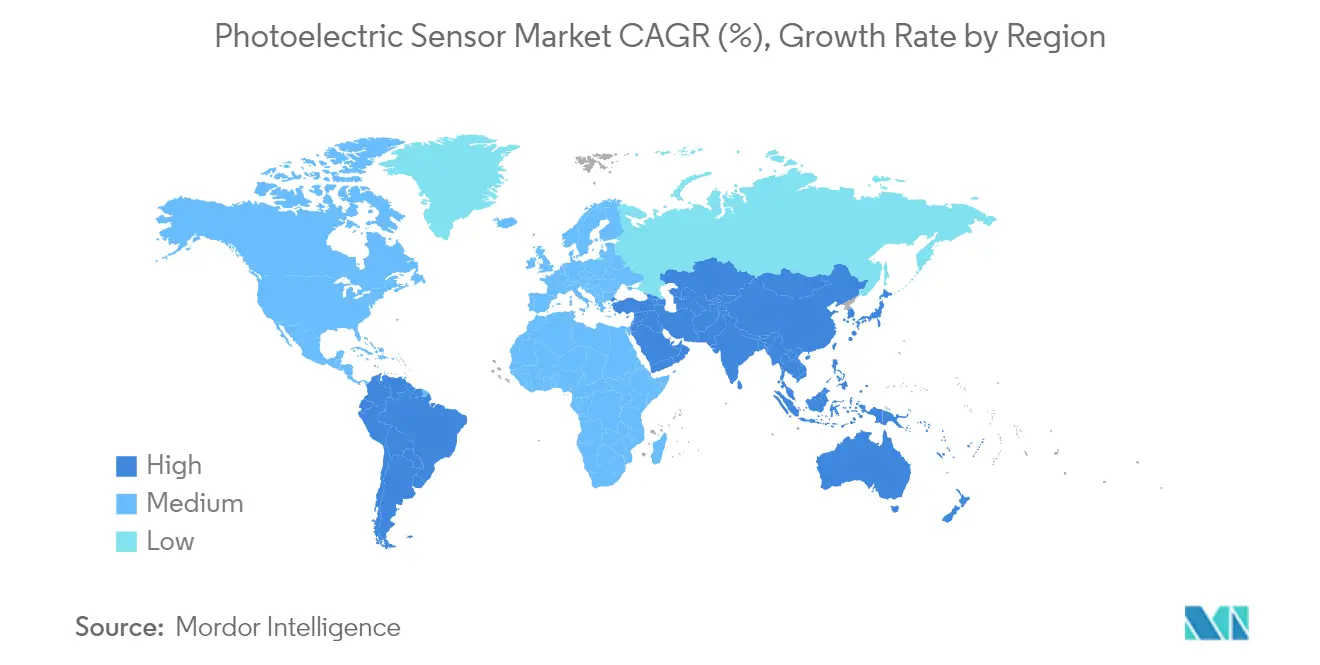
- By geography, APAC led with 47.40% revenue share in 2025 while the Middle East is projected to register a 13.12% CAGR for 2026-2031.
Note: Market size and forecast figures in this report are generated using Mordor Intelligence’s proprietary estimation framework, updated with the latest available data and insights as of 2026.
Market Trends and Insights
Drivers Impact Analysis of Photoelectric Sensor Market*
| Driver | (~) % Impact on CAGR Forecast | Geographic Relevance | Impact Timeline |
|---|---|---|---|
| Accelerated deployment of Industry 4.0 production lines | 1.80% | Global, with APAC and Europe leading adoption | Medium term (2-4 years) |
| Government tax-credit programmes for smart-factory retrofits | 1.20% | North America & EU, expanding to APAC | Short term (≤ 2 years) |
| Falling ASP of high-power red-laser emitters | 0.90% | Global manufacturing hubs | Long term (≥ 4 years) |
| Rapid shift to zero-defect packaging lines in F&B | 1.10% | Global, concentrated in developed markets | Medium term (2-4 years) |
| New IEC 61496-5 safety-rated photoelectric standards | 0.70% | Global, mandatory compliance regions first | Short term (≤ 2 years) |
| AI-enabled self-calibration reducing maintenance labour | 1.00% | Advanced manufacturing economies | Long term (≥ 4 years) |
| Source: Mordor Intelligence | |||
Accelerated Deployment of Industry 4.0 Production Lines
Factories are weaving dense networks of smart sensors that feed real-time data into edge controllers and cloud platforms, allowing predictive maintenance routines that slash unplanned downtime by as much as 30%. Photoelectric sensors furnish high-frequency positional feedback to robotic arms and conveyor systems, permitting adaptive control that limits waste and energy consumption. The IO-Link protocol has become a de-facto digital interface, making it possible to stream diagnostic parameters straight into ERP dashboards. Line installers in APAC report payback periods of less than 18 months on sensor upgrades because higher uptime compensates for initial hardware costs. Broader availability of “plug-and-produce” photoelectric devices further reduces commissioning effort, helping small and mid-size manufacturers adopt industrial automation.
Government Tax-Credit Programmed for Smart-Factory Retrofits
The United States continues to expand federal RandD credits and allows accelerated depreciation for automation hardware under Section 179D. Similar stimulus measures in the European Union funnel up to 20% of project spending into cash rebates when firms add energy-efficient, safety-rated sensors. Germany’s BMBF-funded “Fusion 2040” programme set aside EUR 650 million to support integrated sensor platforms for advanced manufacturing. Local authorities in South Korea and Singapore follow suit with grant schemes that reimburse employee training tied to digital transformation. These incentives are bringing forward purchase decisions and supporting multi-line retrofits that might otherwise have been delayed.
Falling ASP of High-Power Red-Laser Emitters
Recent advances in gallium arsenide nano-ridge technology enable 780 nm diodes to achieve 71% wall-plug efficiency, bringing unit prices down by more than 15% in two years. Manufacturers now fabricate III-V light sources directly on 300 mm silicon wafers, unlocking semiconductor-style economies of scale. Hydrogen plasma passivation also boosts slope efficiency in blue laser diodes, widening application boundaries to opaque and reflective targets. As device costs slide, laser-based photoelectric sensors enter mainstream packaging, logistics, and mobile-robot platforms, opening addressable market segments that once belonged solely to infrared units.
Rapid Shift to Zero-Defect Packaging Lines in F and B
Food processors implement 100% inspection regimes to comply with global safety codes. High-speed photoelectric arrays inspect bottle caps and seals at rates exceeding 3,000 units per minute, recording dimensional data for every SKU batch. Hyperspectral extensions validate chemical composition, eliminating contamination events that previously triggered costly recalls. Machine-learning classifiers residing at the edge re-tune light thresholds on the fly, preserving detection reliability during changeovers and across ambient lighting fluctuations. The resulting waste reduction improves margins and supports corporate sustainability targets, strengthening the business case for extensive sensor deployments.
Restraints Impact Analysis of Photoelectric Sensor Market*
| Restraint | (~) % Impact on CAGR Forecast | Geographic Relevance | Impact Timeline |
|---|---|---|---|
| Uptake of low-cost 3D ToF cameras in short-range picking | -0.80% | Global, concentrated in logistics and e-commerce | Medium term (2-4 years) |
| High replacement rate in wash-down environments | -0.50% | Food processing and pharmaceutical regions | Short term (≤ 2 years) |
| Volatile gallium-arsenide spot prices | -0.60% | Global semiconductor supply chains | Short term (≤ 2 years) |
| Fragmented OEM interface protocols | -0.40% | Global, affecting system integration | Long term (≥ 4 years) |
| Source: Mordor Intelligence | |||
Uptake of Low-Cost 3D ToF Cameras in Short-Range Picking
Time-of-flight arrays such as Teledyne’s 832 × 600-pixel Hydra3D now deliver sub-millimetre depth accuracy and run at 416 fps, letting robotic cells identify irregular loads in chaotic bins. Their falling price narrows the gap with premium photoelectric sensors in logistics and warehouse operations. The ability to perceive full point clouds gives integrators freedom to cut sensor counts. Nonetheless, photoelectric sensors remain ahead in high-speed pass-fail detection on conveyor belts, keeping displacement risk confined to specific 3D-vision use cases.
Volatile Gallium-Arsenide Spot Prices
China refines roughly 98% of global gallium, the core feedstock for many laser diodes. Export controls introduced in 2024 sent spot rates soaring 150% within six months. The US Geological Survey projects that a 30% supply disruption would shave USD 602 billion off US GDP. Sensor manufacturers now secure multi-year contracts, increase recycled content, or explore alternative emitter materials like GaAsP quantum wells. While mitigation efforts are advancing, material volatility continues to raise bill-of-materials risk and slows price reductions.
*Our forecasts treat driver/restraint impacts as directional, not additive. The impact forecasts reflect baseline growth, mix effects, and variable interactions.
Photoelectric Sensor Market Segment Analysis
By Type:
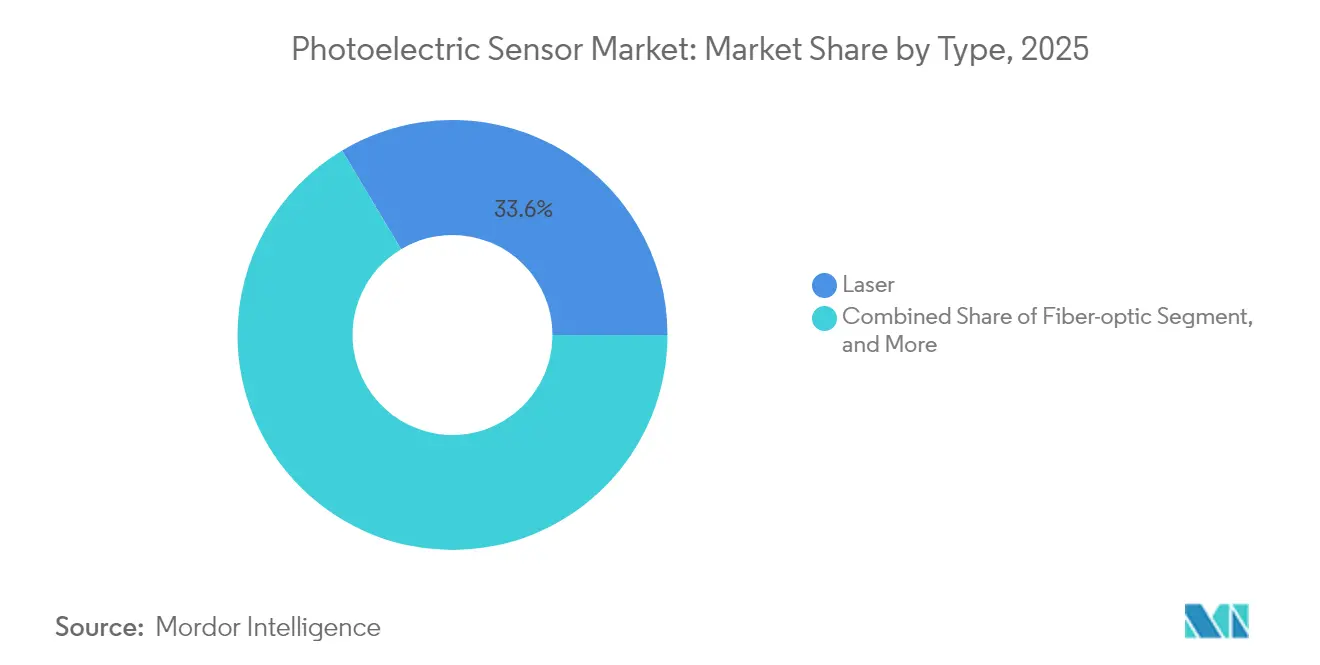
Laser Dominance Driven by Precision DemandsLaser photoelectric sensors commanded a 33.58% photoelectric sensor market share in 2025, reflecting their unrivalled accuracy and long sensing ranges. The segment is forecast to record a 8.95% CAGR, raising the laser photoelectric sensor market size for this segment to USD 1.13 billion by 2031. Price erosion in high-power red-laser dies makes these devices viable even in cost-sensitive production cells. Automotive power-train lines deploy self-contained CMOS laser units with 500 mm detection distance to confirm gear-wheel seating. Fiber-optic variants secure positions in welding booths where electromagnetic noise threatens conventional electronics. The proliferation of IO-Link-enabled models means line operators collect live signal strength and contamination alarms for predictive cleaning schedules. Parallel structured light innovations offer multi-beam coverage that improves detection through dust, reducing false trips.
Emerging retro-reflective array sensors blend easy setup with wide beam reach, useful in carton-forming machines and palletizers. Miniaturization progresses each quarter as gallium arsenide nano-ridge emitters shrink optical packages and trim thermal loads. Suppliers introduce stainless-steel IP69K housings that withstand caustic wash-down cycles in dairy filling rooms. Combined, these advances underpin strong forward momentum and keep the laser category at the centre of the photoelectric sensor market.

By Detection Technology:
Background-Suppression Gains MomentumThrough-beam devices held 40.62% revenue in 2025, forming the backbone of high-speed press lines and canning operations. They remain favoured where open mounting is possible and total reliability is paramount. Background-suppression sensors will outpace rivals at 10.05% CAGR, enlarging their photoelectric sensor market size from USD 548 million in 2026 to USD 885 million by 2031. Their optical design isolates the target within a narrow distance window, preventing false positives from conveyors or enclosures. Robotics integrators specify these sensors on automated guided vehicles for docking accuracy within ±1 mm. Retro-reflective versions support space-restricted conveyors that permit only one-sided mounting, retaining their simplicity with their installation simplicity.
Ongoing R&D focuses on ASIC-driven adaptive thresholds that let background-suppression units learn surface finishes and compensate for ambient light drift. IO-Link channels expose hysteresis parameters to the PLC, letting control engineers fine-tune detection curves without manual potentiometer twists. Diffuse sensors survive where ambient light is stable, serving cost-oriented packaging OEMs that bundle sensors into entry-level machines. Across detection technologies, artificial intelligence algorithms increasingly prune false signals and report contaminant buildup, raising system reliability in dusty, high-speed settings.
By End-User Industry:
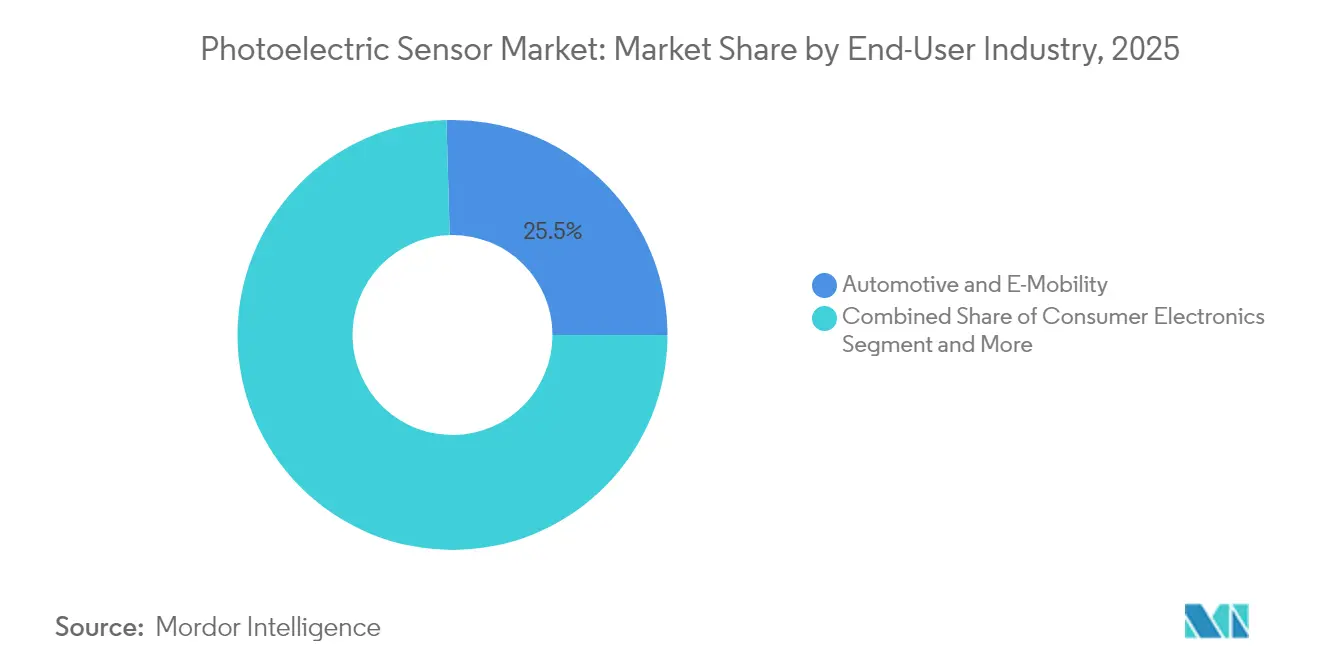
Pharmaceuticals Lead Growth TrajectoryAutomotive and e-mobility manufacturing controlled 25.45% of the photoelectric sensor market size in 2025, driven by stringent tolerance tracking and growing electric vehicle volumes. Over 450 sensors outfit a single battery-pack assembly line to verify cell orientation and presence. Pharmaceuticals and medical devices will register a 11.88% CAGR, reflecting rigorous inspection mandates under GMP and FDA Title 21. Vision inspection systems leveraging background-suppression sensors count up to 3,000 tablets each minute while logging serialisation codes. Food and beverage plants continue to demand IP69K devices that handle caustic sodium hydroxide wash-downs. Consumer electronics suppliers employ mini-PCB sensors to confirm camera lens insertion at sub-millimetre accuracy.
The pharmaceutical surge is intensified by a global shift to continuous manufacturing, where zero-defect output is mandatory. Multi-spectrum photoelectric sensors authenticate pill coating thickness, a task formerly requiring batch sampling. Hyperspectral overlays verify active ingredient distribution, aligning with real-time release testing strategies. These use cases add momentum and revenue, making healthcare the prime engine of incremental growth for the photoelectric sensor market.
By Housing/Mounting Style:
Miniaturization Drives PCB-Mount GrowthCylindrical M8–M30 bodies held 44.32% of the photoelectric sensor market in 2025 because their threaded barrels simplify retrofit installation in existing brackets. Miniature PCB-mount sensors will expand at 10.62% CAGR, reflecting accelerated pull from compact electronic assembly lines and mobile-robot makers. Integration teams value tiny footprints that hide within gripper jaws or pick-and-place heads, freeing exterior space for vision cameras and cables. Rectangular housings remain popular where mechanical alignment jigs lock onto square faces, such as bottling lines. Slot and fork formats detect labels and textile edges at high rates.
Material science advances bring new IP69K-rated plastics that shrug off chemical detergent wash-downs in meat processing. Stainless steel casings now receive PEEK window inserts that resist scratching while passing FDA rules. Quick-disconnect M12 connectors reduce swap times and enhance uptime. The availability of uniform mounting adapters allows device interchangeability across brands, cutting engineering hours during line upgrades. All factors combined cement a healthy growth outlook for compact and rugged housing categories inside the photoelectric sensor market.
Geography Analysis
APAC Photoelectric Sensor Market
APAC controlled 47.40% of revenue in 2025 as China, Japan, and South Korea invested heavily in intelligent factories. Government incentives, especially China’s “Made in China 2025” programme, repay up to 50% of capital expenses on smart equipment, accelerating sensor adoption. Domestic robot makers embed photoelectric detection in pick-and-place modules for smartphone assembly. Japan’s precision machinery builders rely on high-end laser models that discern micron-level edges on semiconductor wafers.
Middle East Photoelectric Sensor Market
The Middle East will grow fastest at 13.12% CAGR. Saudi Arabia’s Vision 2030 supports fresh metal-processing and chemical complexes that specify Industry 4.0 connectivity from day one. Emerson’s 13,000 m² Dammam hub now manufactures control systems with integrated measurement instrumentation, including photoelectric sensors. UAE smart-city pilots deploy outdoor-rated retro-reflective sensors to automate parking guidance and waste-handling chutes, opening non-industrial revenue channels.
The Americas, Europe and Africa Photoelectric Sensor Market
North America and Europe post steady gains as reshoring of critical supply chains and sustainability mandates drive upgrades. US food processors increase inline inspection to meet FSMA regulations. German automotive OEMs embrace predictive maintenance on assembly lines, embedding IO-Link sensors that stream diagnostics into MES platforms. South America and Africa remain nascent but rising industrial wages push firms to install basic automation, presenting long-term potential for cost-competitive diffuse sensors.
Regulatory Landscape
Safety and machine-compliance requirements continue to shape photoelectric sensor design and certification, particularly for safety-rated opto-electronic protective devices deployed on automated lines. IEC 60947-5-2:2019 remains a baseline for proximity switches, including requirements for construction, EMC, and environmental conditions, while IEC 61496 updates are strengthening the framework for electro-sensitive protective equipment, including EN IEC 61496-3:2025 for active opto-electronic protective devices responsive to diffuse reflection.
In the European Union, Regulation (EU) 2023/1230 on machinery sets a more explicit compliance pathway for connected and software-driven automation equipment, including control-system reliability and software integrity, with mandatory application from January 2027. In parallel, May 2026 discussions around an EU Digital Omnibus approach to AI in machinery highlight ongoing regulatory work to reduce duplicative compliance burdens by emphasizing sector safety rules for high-risk AI-enabled machines, reinforcing demand for traceability, risk assessment, and cyber-safety practices across industrial sensing and control stacks.
Value Chain Analysis
The photoelectric sensor value chain starts with upstream inputs such as III-V emitter materials (including gallium-arsenide-based laser diodes), photodiodes, CMOS/ASICs, and precision optics (lenses, windows, reflectors). It also includes housings and connectors (IP-rated plastics, stainless steel, M8-M30 barrels, M12 interconnects) plus firmware and software for diagnostics and industrial communication. Midstream participants include sensor OEMs that integrate optics, electronics, and embedded algorithms, along with contract manufacturers and regional assembly and test operations that calibrate performance, seal housings, and validate EMC and safety compliance before shipment.
Downstream, sensors are distributed through industrial automation channels, electrical distributors, and machine builders/OEMs that bundle them into packaging, material handling, robotics, and inspection systems for automotive, food and beverage, and pharmaceutical lines. System integration and interoperability layers, notably IO-Link and Industrial Ethernet mappings into PLC/MES/SCADA, increasingly add value through parameterization, condition monitoring, and remote maintenance. On the component side, supplier roadmaps for miniaturized opto devices continue to influence form factors, supported by Sharp Semiconductor Innovation Corporation announcing in May 2026 an ultra-compact reflective photointerrupter (GP2S800 series) with mass production scheduled for autumn 2026, signaling continued upstream innovation for smaller embedded sensing nodes.
Competitive Landscape
The landscape remains moderately concentrated. Omron, Keyence, SICK, and Banner Engineering collectively hold close to 45% revenue through broad portfolios and strong channel coverage. These leaders pivot toward AI-embedded firmware and cloud hooks that enrich aftermarket services. SICK and Endress+Hauser formed a joint venture in 2024 to merge sensor strength with process analytics, creating a one-stop shop for flow and gas measurement solutions. Omron’s new South Carolina plant broadens US footprint and reduces lead times for custom sensor variants.
Midsize challengers exploit niches in harsh-environment sensing and miniaturised optics. Coherent’s high-efficiency CW lasers supply many start-ups that package ultracompact photoelectric heads. Zebra’s 2024 purchase of Photoneo injected 3D vision know-how, permitting integrated solutions that compete against time-of-flight cameras in logistics. Market consolidation continues as distributors such as Graybar Canada absorb regional players to gain application engineering talent. Certification around IEC 61496-5 tightens entry barriers, advantaging firms with in-house safety labs.
Emerging players experiment with gallium-free emitters to bypass supply constraints and differentiate on sustainability metrics. Partnerships with IIoT platforms such as Siemens MindSphere and PTC ThingWorx allow sensor vendors to monetize data services. Competitive intensity is expected to remain moderate, with price pressures offset by value-added software and predictive maintenance offerings.
Photoelectric Sensor Industry Leaders
-
Omron
-
Keyence
-
Sick AG
-
Schneider Electric
-
Panasonic
- *Disclaimer: Major Players sorted in no particular order
Photoelectric Sensor Market Companies Covered in this Report
- Omron Corporation
- Keyence Corporation
- Sick AG
- Panasonic Holdings Corporation
- Rockwell Automation Inc.
- Schneider Electric SE
- Pepperl+Fuchs SE
- Banner Engineering Corp.
- Leuze electronic GmbH + Co. KG
- SensoPart Industrie-sensorik GmbH
- HTM Sensors Inc.
- Balluff GmbH
- Autonics Corporation
- IFM Electronic gmbh
- Datasensing S.p.A.
- Fargo Controls Inc.
- Baumer Holding AG
- Contrinex AG
- Eaton Corporation plc
- Wenglor Sensoric GmbH
Market Opportunities and Future Outlook
A key opportunity lies in moving from binary sensing to connected condition-monitoring assets that expose health and process metadata through standard industrial interfaces. Suppliers are using IO-Link and richer diagnostics to position photoelectric sensors deeper into IT/OT convergence, enabling maintenance teams to act on signal margin degradation, response-time drift, and switching counts through MES/SCADA or CMMS workflows. This direction fits smart-factory retrofit priorities and the report's emphasis on reducing unplanned downtime and maintenance labor through self-calibration and digital diagnostics.
Harsh and regulated operating environments also create room for purpose-built housings and hygiene-ready connectivity, especially in food, beverage, and pharmaceuticals, where wash-down cycles and inspection mandates raise reliability requirements. In 2026, RS Group highlighted distance-based sensor designs that pair IO-Link connectivity with IP69K sealing and hygiene-oriented certifications, aligning with demand for robust sensing on high-throughput packaging and inspection lines. Sensor vendors are also demonstrating pathways for connected retroreflective sensing in plant analytics and maintenance stacks, reinforcing demand for photoelectric sensors that can be managed as data sources rather than only as discrete PLC inputs.
Recent Industry Developments in Photoelectric Sensor Market
- March 2026: OMRON launched the B5T-007003 Human Vision Component (B5T HVC-P2) detection module tuned for clean-suit environments, using specialized firmware to detect workers wearing protective garments. The release broadens photoelectric and optical detection applicability in cleanroom automation where false negatives can disrupt safety and throughput. It also reflects the market shift toward embedding application-specific intelligence at the sensor/module level for edge operation.
- December 2025: SICK introduced the W12 LED NextGen photoelectric sensor series with IO-Link access to real-time process data and TwinEye technology aimed at challenging targets such as reflective or perforated surfaces. The launch strengthens connected sensing as a standard feature in mainstream photoelectric platforms rather than a premium add-on. It supports predictive maintenance and faster commissioning in high-speed packaging and material handling lines.
- April 2024: KEYENCE launched the IV4 vision sensor series with integrated AI tools such as AI Identify, AI OCR, and AI Count, designed for high-throughput inspection use cases. This raises competitive pressure on conventional photoelectric installations in applications that can consolidate multiple checks into a single smart sensor. It also accelerates expectations for embedded analytics and simplified setup across factory-floor detection and inspection architectures.
Photoelectric Sensor Market Report Scope and Research Methodology
Market Definition and Coverage
This market covers photoelectric sensors that use a light emitter and a receiver to detect an object, its presence or absence, or distance, and then convert that into an electrical output for control and monitoring uses.
Scope exclusions: We exclude machine vision cameras, lighting-only components, and unrelated optical sensors that do not perform photoelectric object detection.
Segments Covered in This Report
- By Type
- Laser
- Fiber-optic
- LED/Infra-red
- Retro-reflective Array
- By Detection Technology
- Through-beam
- Retro-reflective
- Diffuse
- Background-suppression
- By Housing / Mounting Style
- Cylindrical (M8-M30)
- Rectangular / Cubic
- Slot / Fork
- Miniature PCB-mount
- By End-user Industry
- Consumer Electronics
- Automotive and E-Mobility
- Food and Beverages
- Packaging Machinery OEMs
- Pharmaceuticals and Medical Devices
- Building and Smart Infrastructure
- By Geography
- North America
- United States
- Canada
- Mexico
- Europe
- United Kingdom
- Germany
- France
- Italy
- Rest of Europe
- Asia-Pacific
- China
- Japan
- India
- South Korea
- Rest of Asia-Pacific
- Middle East
- Israel
- Saudi Arabia
- United Arab Emirates
- Turkey
- Rest of Middle East
- Africa
- South Africa
- Egypt
- Rest of Africa
- South America
- Brazil
- Argentina
- Rest of South America
- North America
Data Sources, Market Sizing, and Validation
Desk Research
Desk work started by aligning the product scope and the main demand drivers, so the model stays tied to where photoelectric sensors are actually deployed. We leaned on public sources such as the US Census Bureau and Bureau of Labor Statistics series for manufacturing signals, World Bank and OECD industrial production indicators, and UN Comtrade trade flows for relevant sensor and electronics categories.
To keep assumptions grounded, we also reviewed standards and safety references (including IEC-related safety sensor notes where applicable), peer reviewed journals on industrial sensing and automation adoption, and trade association publications that discuss factory automation and packaging machinery trends. Company annual reports, investor decks, and reputable press coverage were used to cross-check capacity expansion, channel intensity, and regional demand direction. In a few cases, paid subscriptions for company financials and patent databases were used to confirm supplier exposure and technology shifts. These examples are illustrative only, and the desk sources referenced are not exhaustive because several other public materials were also used for collection, validation, and clarification.
Primary Interviews and Surveys
Primary work focused on checking how units move through OEMs, distributors, and system integrators, and how pricing shifts by sensing mode, protection rating, and required safety features. We spoke with manufacturers, automation solution providers, and large end users across APAC, EMEA, and the Americas, which helped fill gaps on shipment mix, replacement cycles, and what gets counted as a photoelectric sensor versus a nearby optical component.
Distribution of primary research fieldwork respondents
| Company type | Respondent position | Region |
|---|---|---|
| Top tier: 37% | CXOs: 17% | APAC: 47% |
| Mid tier: 44% | Functional/Unit leaders: 32% | EMEA: 34% |
| Smaller Players: 19% | Managers: 51% | Americas: 19% |
Market-Sizing & Forecasting
Sizing followed a top-down and bottom-up combination, where industrial automation activity and manufacturing output signals were used to reconstruct the demand pool for photoelectric sensors, and then the totals were converted into value using typical price bands. The results were corroborated with selective bottom-up approximations, including supplier exposure checks, distributor inputs on unit movement, and sampled average selling price multiplied by estimated unit volumes, with adjustments when gaps appeared.
Key inputs included industrial production and machinery output trends, automation and smart factory retrofit momentum, the mix of sensing modes used in factories (through-beam, retro-reflective, and diffuse), typical replacement cycles in dusty or washdown environments, and the spread of safety-related use cases where applicable. Pricing was handled by tracking how product mix shifts toward laser emitters or higher protection designs, which can lift ASP even when unit growth is steady. For forecasting, we used scenario analysis supported by a multivariate regression view, where manufacturing output outlook and automation capex expectations were the main anchors, and interview feedback was used to keep the slope practical. When country-level splits were thin, we used proxy indicators like machinery exports and manufacturing value added to distribute demand, and then reconciled back to the global total.
Data Validation & Update Cycle
Outputs were validated through several checks, starting with currency and unit consistency, followed by variance checks against independent signals like manufacturing output, trade direction, and automation investment tone. When a region showed an unusual spike, assumptions were revisited, desk inputs were re-checked, and follow-up calls were done if pricing or mix appeared to have shifted.
Before sign-off, the model is reviewed in steps so that drivers, totals, and implied unit economics make sense together. Reports refresh annually, and interim updates are made when material events occur, such as major production shifts or sharp pricing changes. Right before delivery, a final pass is done so clients receive the latest updated view.
Mordor Intelligence's Photoelectric Sensor Market Size Versus Other Published Estimates
It is normal to see different market values for photoelectric sensors because each publisher makes different calls on which products are included, which year is treated as the starting point, and how pricing and product mix are carried forward into forecasts.
The main spread usually comes from whether safety-rated photoelectric sensors aligned to industrial automation are separated from broader optical sensing totals, plus how ASP is updated for the shift toward laser and higher protection designs, which is explicitly modeled and refreshed in Mordor Intelligence.
Benchmark comparison
| Source | Market Size | Gaps in Research Methodology |
|---|---|---|
| Mordor Intelligence | USD 2.16 B (2026) | |
| Global Research Publisher A | USD 2.06 B (2024) | Uses an earlier base year and can carry forward pricing with a flatter progression, which may miss mix-led ASP lift when laser or higher protection products gain share. |
| Business Publisher B | USD 2.30 B (2025) | Starts from a higher base year value and runs a longer forecast window, and it can also differ on whether safety-related photoelectric products are bundled with adjacent sensing categories. |
Looking across the three figures, the differences are explainable once the base year, included product scope, and the way ASP is updated for product mix are made clear. Our method stays tied to manufacturing activity and automation signals, and then it is checked against supplier and channel feedback so the number can be repeated and updated in a consistent way.
Key Questions Answered in the Report
What is the current size of the photoelectric sensor market?
The photoelectric sensor market stood at USD 2.16 billion in 2026 and is projected to hit USD 3.05 billion by 2031.
Which region dominates revenue in the photoelectric sensor market?
APAC led with 47.40% revenue share in 2025 due to extensive manufacturing automation in China, Japan, and South Korea.
Which detection technology will grow fastest through 2031?
Background-suppression sensors will post a 10.05% CAGR between 2026 and 2031, outpacing other detection methods.
Why are laser photoelectric sensors gaining share?
Falling prices for high-power red-laser emitters and superior precision make laser sensors attractive for automotive, packaging, and electronics applications.
How are government incentives affecting adoption?
Tax credits and grants in the United States, European Union, and parts of APAC reduce upfront costs for Industry 4.0 retrofits, accelerating sensor deployment.
What is the biggest end-user growth opportunity?
Pharmaceutical and medical device manufacturers will expand sensor use at 11.88% CAGR as stringent inspection requirements drive 100% production monitoring.