
Global Photodynamic Therapy Market Size and Share
Market Overview
| Study Period | 2020 - 2031 |
|---|---|
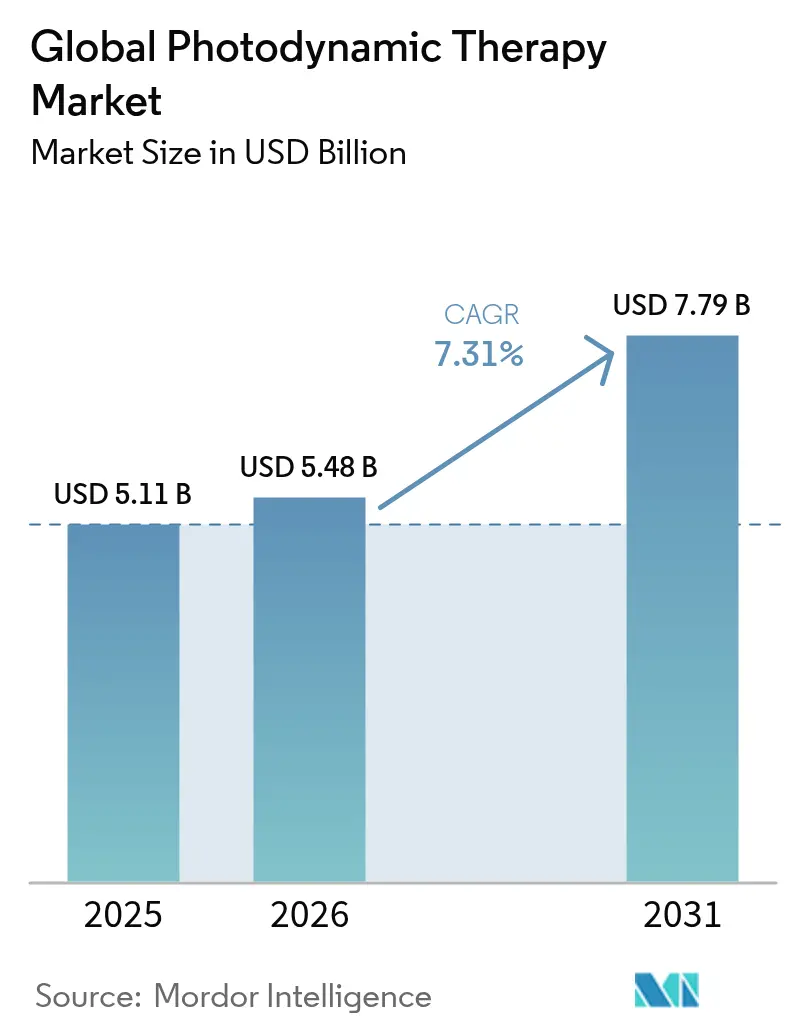
| Market Size (2026) | USD 5.48 Billion |
| Market Size (2031) | USD 7.79 Billion |
| Growth Rate (2026 - 2031) | 7.31 % |
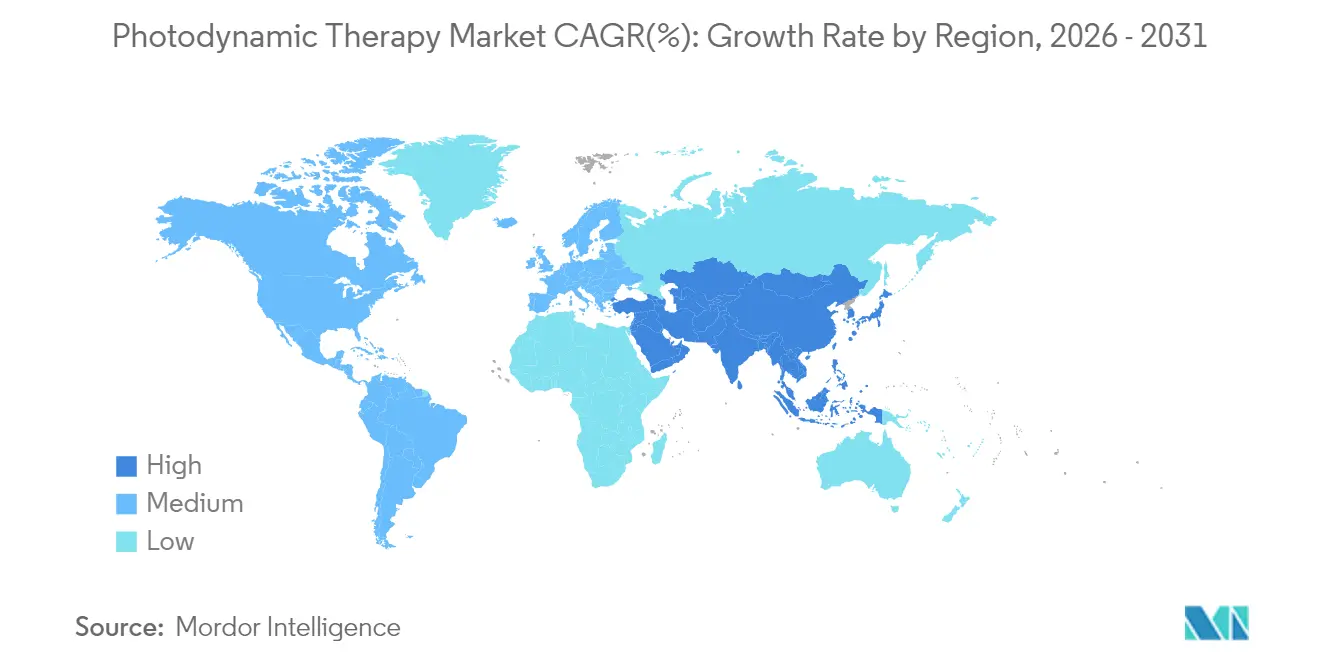
| Fastest Growing Market | Asia Pacific |
| Largest Market | North America |
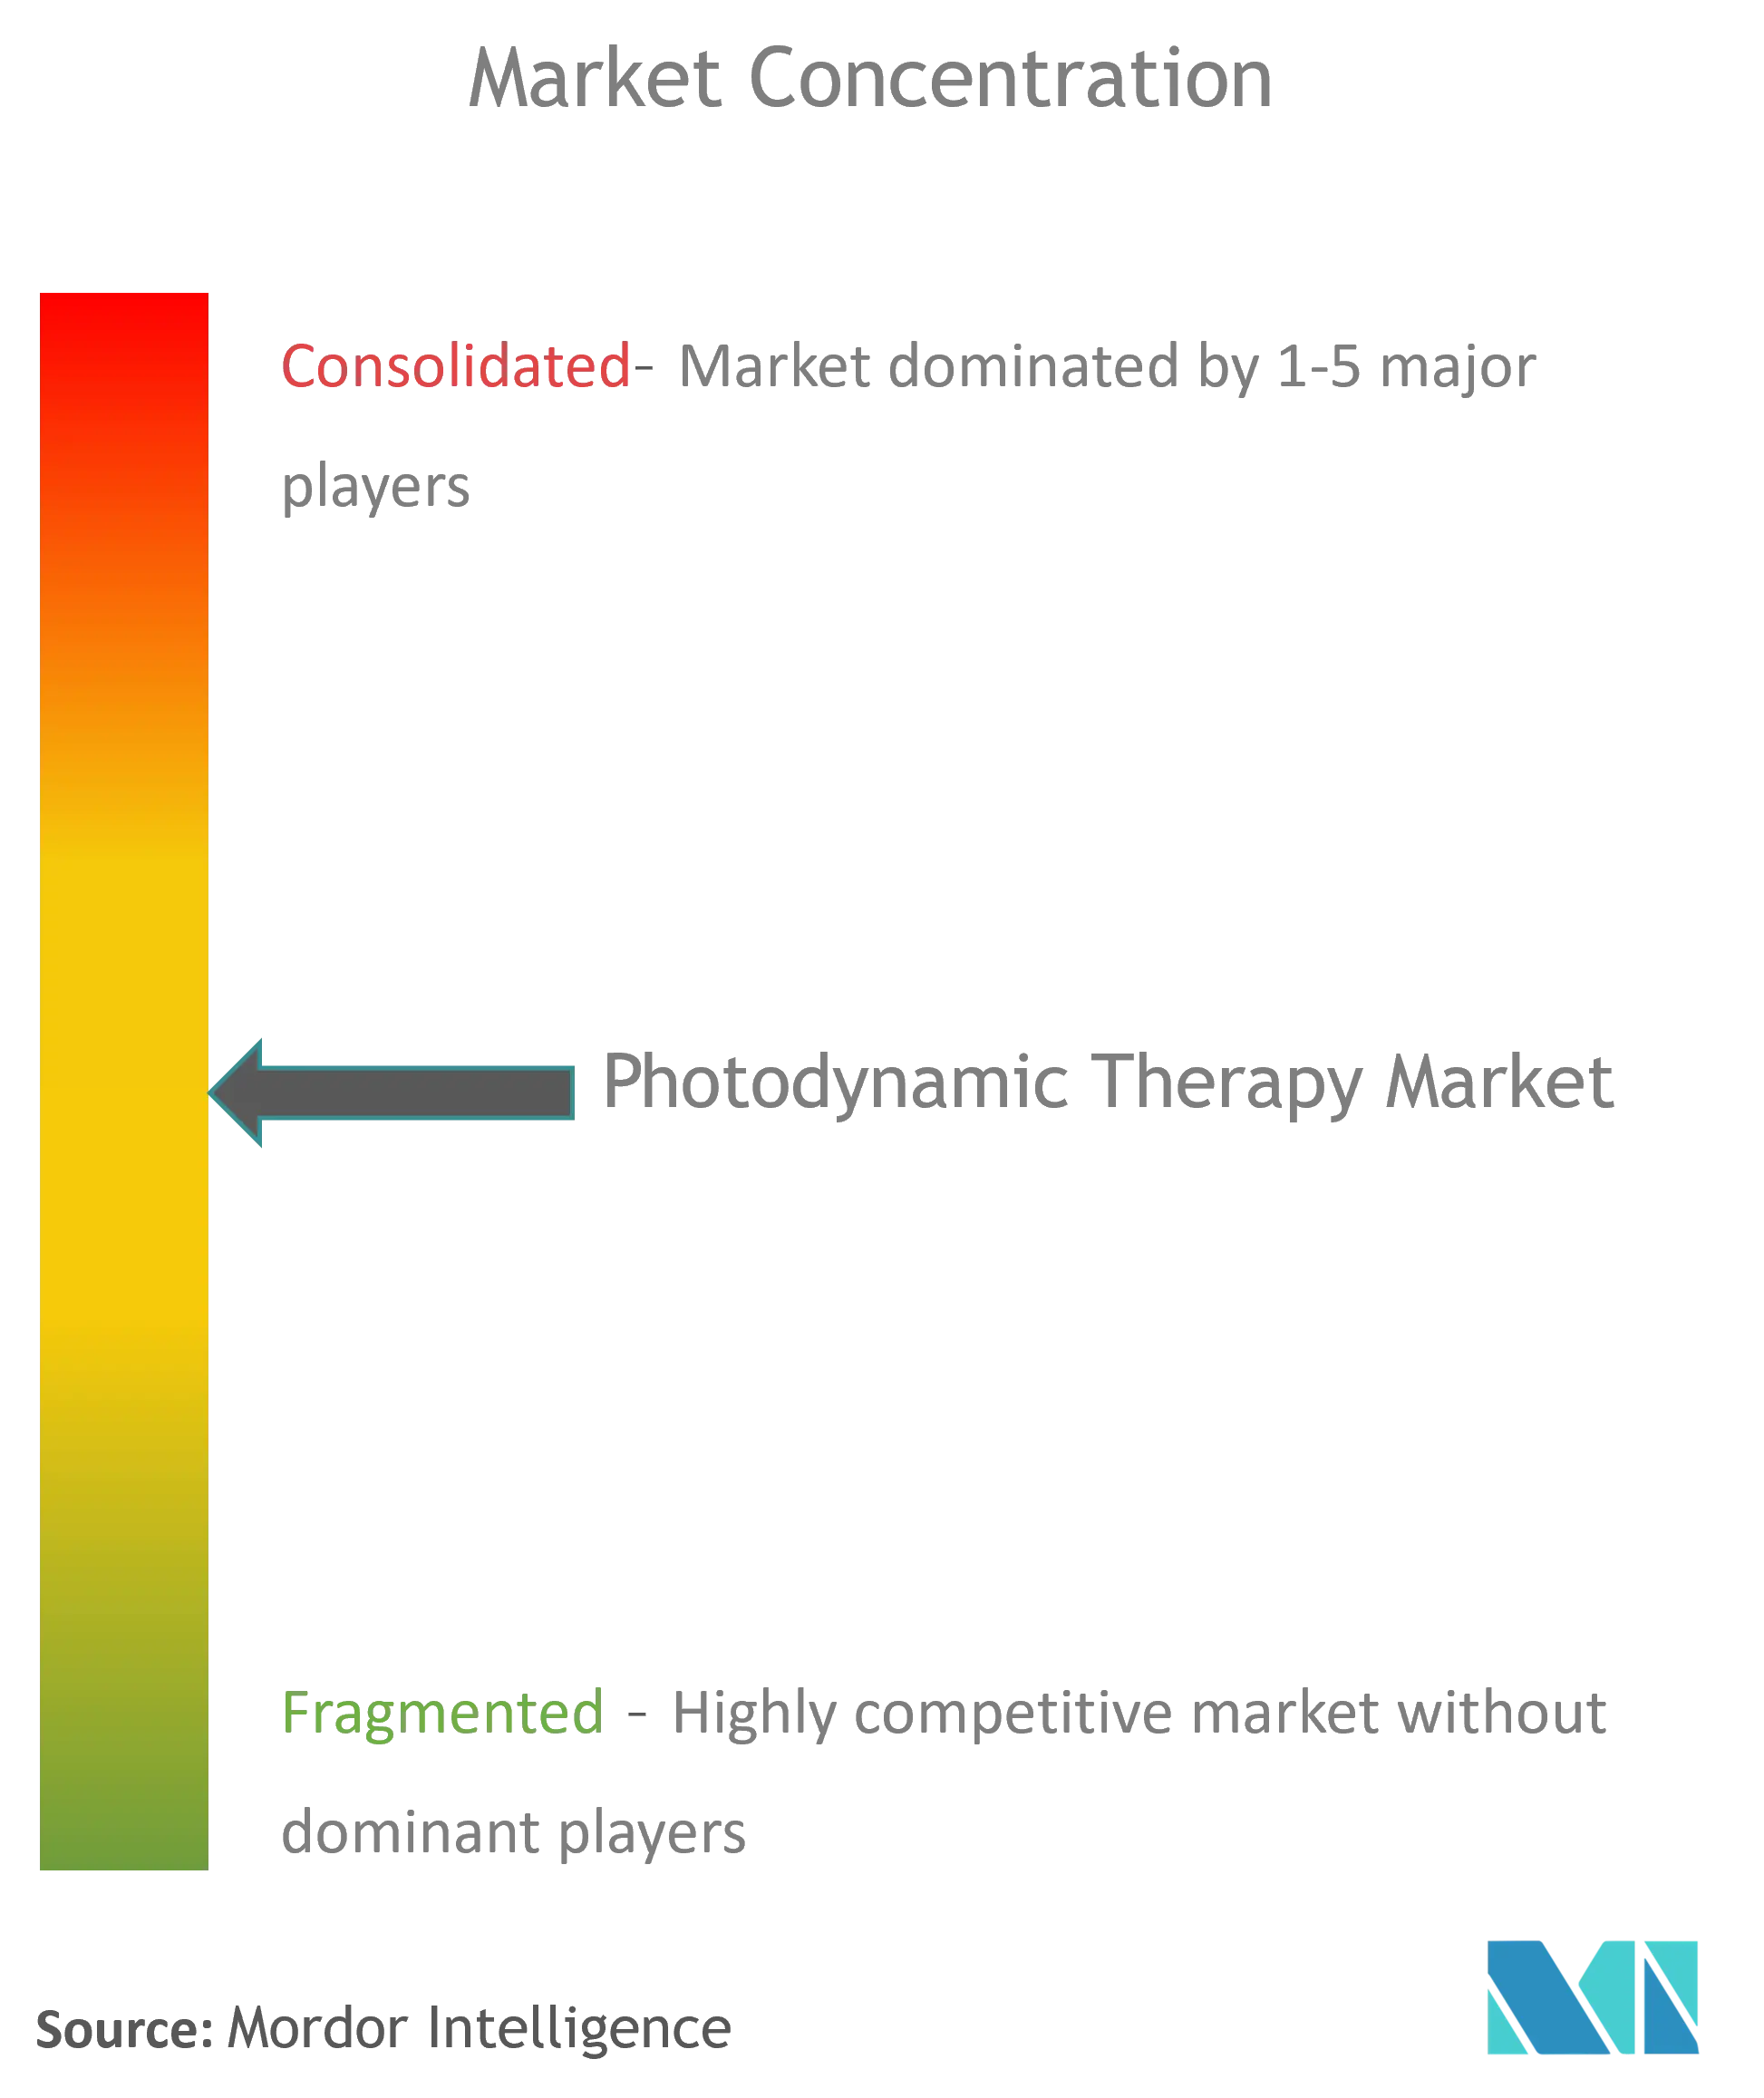
| Market Concentration | Medium |
Major Players *Disclaimer: Major Players sorted in no particular order Image © Mordor Intelligence. Reuse requires attribution under CC BY 4.0. | |
Global Photodynamic Therapy Market Analysis by Mordor Intelligence
The photodynamic therapy market size in 2026 is estimated at USD 5.48 billion, growing from 2025 value of USD 5.11 billion with 2031 projections showing USD 7.79 billion, growing at 7.31% CAGR over 2026-2031. Wider clinical acceptance across dermatology, ophthalmology, and antimicrobial care underpins this trajectory. The FDA clearance of LumiThera’s Valeda system for dry age-related macular degeneration in November 2024 signaled the therapy’s expansion beyond oncological roots, while Biofrontera’s RhodoLED XL lamp illustrates parallel device innovation fda.gov. Growing reimbursement for actinic keratosis, falling LED array prices, and rising demand for fertility-preserving cervical cancer options further lift the photodynamic therapy market. At the same time, capital constraints for small practices and patient photosensitivity concerns temper the pace of adoption.
Key Report Takeaways
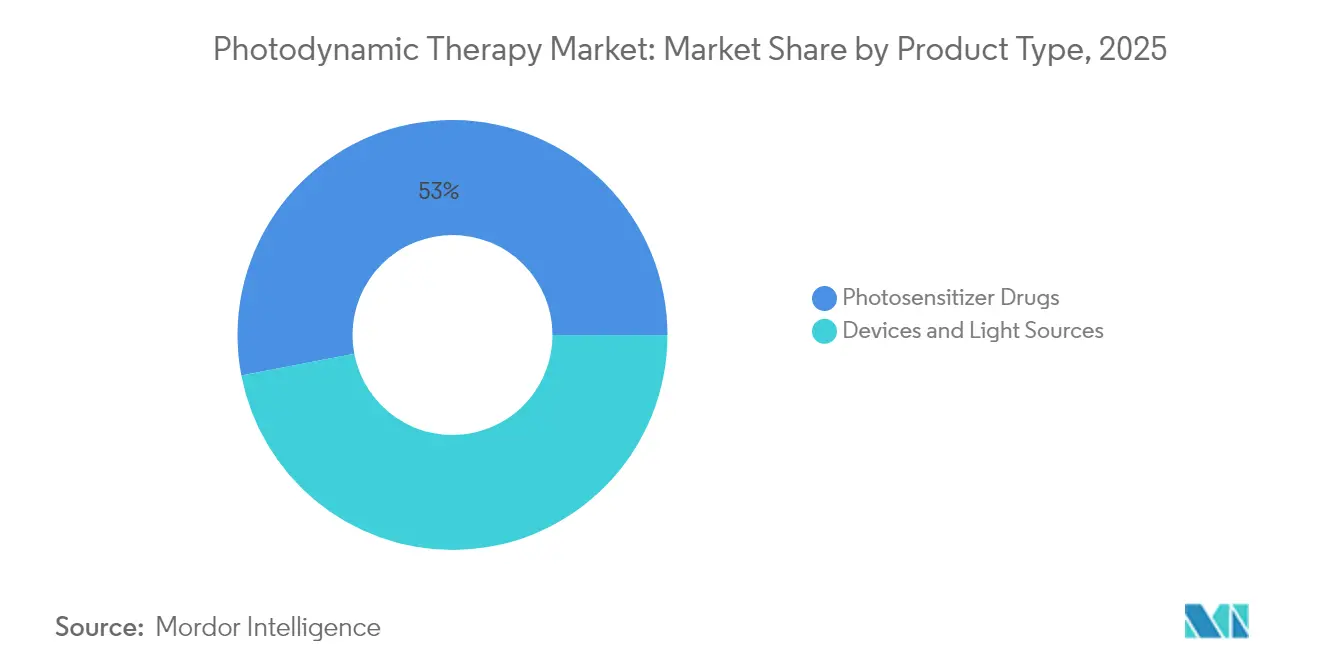
- By product type: Photosensitizer drugs held 53.02% of photodynamic therapy market share in 2025; LED-based light sources are forecast to grow at an 8.02% CAGR through 2031.
- By application: Oncology captured 48.12% photodynamic therapy market share in 2025, while dermatology non-oncology uses are set to expand at a 9.08% CAGR to 2031.
- By end user: Hospitals accounted for 59.72% of the photodynamic therapy market size in 2025; ambulatory surgical centers are projected to rise at an 8.39% CAGR to 2031.
- By geography: North America led with 41.88% revenue share in 2025; Asia-Pacific is forecast to register the fastest 8.74% CAGR between 2026 and 2031
Note: Market size and forecast figures in this report are generated using Mordor Intelligence’s proprietary estimation framework, updated with the latest available data and insights as of 2026.
Market Trends and Insights
Drivers Impact Analysis of Global Photodynamic Therapy Market*
| Driver | (~) % Impact on CAGR Forecast | Geographic Relevance | Impact Timeline |
|---|---|---|---|
| Rising incidence of non-melanoma skin cancer | +1.8% | Global, with concentration in North America & Australia | Long term (≥ 4 years) |
| Regulatory approvals of next-generation photosensitizers | +1.2% | North America & EU, expanding to APAC | Medium term (2-4 years) |
| Expanding reimbursement for actinic keratosis treatment | +0.9% | North America & select EU markets | Short term (≤ 2 years) |
| Cost decline in diode laser & LED light sources | +0.7% | Global, with manufacturing concentration in Asia | Medium term (2-4 years) |
| Daylight-PDT deployment in primary care settings | +0.5% | EU & North America, pilot programs in APAC | Long term (≥ 4 years) |
| AI-guided real-time dosimetry optimization | +0.4% | North America & select EU centers | Long term |
| Source: Mordor Intelligence | |||
Rising Incidence of Non-Melanoma Skin Cancer
Basal and squamous cell carcinoma prevalence is pushing clinicians toward less invasive care options with superior cosmetic outcomes. Photodynamic therapy can achieve 90% complete clearance in superficial basal cell carcinoma while avoiding tissue loss, which appeals to patients with lesions on cosmetically sensitive areas. Organ-transplant recipients and Gorlin syndrome patients benefit from repeatable, non-scarring treatments, creating steady demand in specialist centers. As field cancerization prevention gains traction, proactive protocols amplify procedure volumes across dermatology networks.
Regulatory Approvals of Next-Generation Photosensitizers
The FDA’s flexible review standards have shortened approval cycles for advanced nano-formulations that cut photosensitivity duration without sacrificing depth of action. Biofrontera’s larger Ameluz dose authorization demonstrates regulators’ willingness to support broader lesion coverage. Natural agents[1]Source: David Aebisher et al., “Natural Photosensitizers in Clinical Trials,” Applied Sciences, mdpi.com such as hypericin and curcumin move through late-stage trials, promising lower manufacturing costs that could open price-sensitive markets across Asia-Pacific.
Expanding Reimbursement for Actinic Keratosis Treatment
Dedicated CPT codes and positive coverage determinations allow dermatology clinics to embed PDT into routine care. Blue Cross Blue Shield policies now deem the therapy medically necessary under defined criteria, raising utilization rates in outpatient settings. CMS coverage for verteporfin in ocular PDT sets a precedent for future non-oncology reimbursements, reinforcing the photodynamic therapy market’s revenue stability.
Cost Decline in Diode Laser & LED Light Sources
LED arrays now deliver comparable outcomes to lasers while trimming equipment prices by roughly 60%, boosting affordability for small practices. Portable platforms under investigation suggest home-supervised protocols are plausible, potentially transforming care delivery. Manufacturing scale in East Asia further drives down unit costs, widening global access to the photodynamic therapy market.
Restraints Impact Analysis of Global Photodynamic Therapy Market*
| Restarint | (~) % Impact on CAGR Forecast | Geographic Relevance | Impact Timeline |
|---|---|---|---|
| High capital cost of PDT laser equipment | -1.1% | Global, particularly affecting smaller practices | Medium term (2-4 years) |
| Patient non-compliance due to prolonged photosensitivity | -0.8% | Global, with higher impact in sunny climates | Short term (≤ 2 years) |
| Limited reimbursement for non-oncology indications | -0.6% | North America & EU, expanding coverage gaps | Medium term (2-4 years) |
| Cold-chain gaps for liposomal photosensitizer drugs | -0.4% | Global, with acute impact in developing markets | Long term (≥ 4 years) |
| Source: Mordor Intelligence | |||
High Capital Cost of PDT Laser Equipment
Initial outlays of USD 50,000–150,000 limit adoption among independent dermatologists, who comprise the bulk of potential sites. Leasing programs ease cash burdens but compress margins and spark obsolescence fears amid rapid device refresh cycles. Until lower-priced LED systems reach parity in all indications, the photodynamic therapy market may struggle to penetrate community practices at scale.
Patient Non-Compliance Due to Prolonged Photosensitivity
Traditional agents can impose up to 48 hours of strict light avoidance, discouraging completion of multi-session regimens, especially in equatorial regions with intense sunlight. Daylight-mediated protocols lessen discomfort but rely on weather conditions, adding scheduling complexity. Education requirements raise staff workload, nudging some providers toward competing modalities.
*Our forecasts treat driver/restraint impacts as directional, not additive. The impact forecasts reflect baseline growth, mix effects, and variable interactions.
Global Photodynamic Therapy Market Segment Analysis
By Product Type:
Photosensitizer Drugs Drive InnovationPhotosensitizer drugs dominated revenue with 53.02% share in 2025 and are expected to advance at an 7.85% CAGR through 2031. Third-generation formulations employing nanoparticle carriers improve tumor selectivity and shave photosensitivity windows, reinforcing leadership of this segment within the photodynamic therapy market size. Natural agents in late-stage trials may cut production expenses, supporting broader payer adoption and regional market entry in Asia-Pacific.
In contrast, light sources are evolving toward high-output LEDs that decrease procedure time and improve patient comfort. FDA clearance of the RhodoLED XL lamp, which covers wider treatment fields, indicates the pace of device innovation. AI-enabled dosimetry modules now refine fluence delivery in real time, allowing clinicians to tailor sessions, reduce retreatments, and elevate outcomes across the photodynamic therapy market.


By Application:
Oncology Leadership with Emerging DiversificationCancer care retained 48.12% share in 2025, and therapeutic expansion in cervical, head-and-neck, and bladder cancers underpins a segment CAGR of 7.77% to 2031. Superficial basal cell carcinoma remains a high-volume anchor, yet fertility-preserving cervical protocols achieving 94.79% regression broaden the treated population, adding resilience to the photodynamic therapy market.
Dermatology non-oncology indications such as acne benefit from standardized Chinese guidelines, while ophthalmology entered commercial use after Valeda gained FDA approval. Chronic wound and antimicrobial studies position PDT for longer-range diversification, embedding multi-disciplinary relevance throughout the photodynamic therapy industry.
By End User:
Hospital Dominance with ASC GrowthHospitals controlled 59.72% of revenue in 2025 owing to complex case management capabilities and capital budgets that accommodate sophisticated devices, cementing their role as foundational purchasers within the photodynamic therapy market. Multi-modal oncology pathways inside tertiary centers integrate PDT alongside surgery or radiation, cementing patient flow and equipment utilization.
Ambulatory surgical centers, however, are predicted to deliver the fastest 8.39% CAGR, leveraging outpatient efficiencies and lower overheads. The move toward same-day discharge aligns with payer pressures for cost containment, signaling sustained decentralization across the photodynamic therapy market size by decade’s end.

Geography Analysis
North America Photodynamic Therapy Market
North America commanded 41.88% of global sales in 2025 as favorable reimbursement and the world’s highest skin cancer incidence sustained steady procedural volumes. Multiple FDA clearances in 2024, including Valeda for dry AMD, reinforced clinical confidence while Medicare coverage removed cost barriers modernretina.com. Provincial health agencies such as Alberta’s technology assessment office confirm PDT’s cost-effectiveness, hinting at future funding expansions across Canada open.alberta.ca. Cross-border medical tourism from Mexico adds incremental demand at specialized U.S. centers, solidifying the photodynamic therapy market’s regional base.
APAC Photodynamic Therapy Market
Asia-Pacific is projected to post a rapid 8.74% CAGR between 2026 and 2031. China’s December 2024 expert consensus on aminolevulinic acid established unified protocols that lower clinical adoption friction . Japan’s aging population fuels macular degeneration procedures, and its stringent device standards boost trust in locally cleared systems. South Korea’s export-oriented medical device sector offers cost-competitive LED units, enhancing affordability for regional providers. India’s large unmet oncologic need presents a long-range opportunity once infrastructure and reimbursement frameworks mature, adding depth to the photodynamic therapy market.
Europe Photodynamic Therapy Market
Europe sustains moderate growth under harmonized device regulations that simplify multi-country launches. Daylight-PDT, pioneered in Nordic clinics, addresses photosensitivity compliance and now spreads across Mediterranean nations. Germany and the United Kingdom operate flagship academic programs that test nano-formulations and AI dosimetry, strengthening evidence for broader reimbursement. Cosmetic outcome priorities resonate with PDT’s tissue-sparing profile, driving steady referrals for facial lesion management and reinforcing the photodynamic therapy market’s resilience across the continent.

Regulatory Landscape
Photodynamic therapy often falls under drug-device combination product oversight when a photosensitizer is paired with a dedicated light source. In the United States, FDA jurisdiction and the review pathway depend on the product's primary mode of action. Device-led configurations are commonly routed through CDRH and cleared or approved via pathways such as PMA and PMA supplements, while drug-led changes run through NDA/sNDA processes, including PDUFA target action dates for label expansion. A concrete recent example is the FDA PMA supplement approval for Sun Pharmaceutical Industries (P990019/S009) in May 2025 for the BLU-U Model 4170E illuminator, enabling a transition from fluorescent tubes to LED panels within an approved PDT illuminator.
Device safety and performance requirements for PDT and photodynamic diagnosis equipment are anchored in IEC 60601-2-75:2017 and its Amendment 1:2023. The European adoption is reflected in EN IEC 60601-2-75:2019/A1:2024 under CENELEC. These updates reinforce risk-management alignment (including ISO 14971 expectations) and tighten controls around calibration integrity and essential performance, shaping design controls, post-market maintenance, and service documentation for manufacturers selling light sources across multi-country markets.
Value Chain Analysis
The PDT value chain is built around integrated drug-device use. Photosensitizer API sourcing and formulation typically involve light-sensitivity and photosafety testing requirements, while dedicated light-source manufacturing (LED arrays, diode lasers, lamps) must align with applicable medical electrical safety standards. Distribution then follows either bundled, direct-to-clinic models or conventional pharmaceutical channels (including cold-chain where applicable).
Downstream delivery depends on trained clinical sites that manage patient selection, incubation protocols, illumination, and follow-up, including hospitals, dermatology and skin-cancer clinics, and ASCs. NICE guidance in the United Kingdom shapes pathway adoption and documentation requirements there. Supply reliability is a recurring leverage point, since concentrated or single-source manufacturing for certain photosensitizers (for example, verteporfin production noted as concentrated at Alcami Carolinas Corporation in Charleston, South Carolina) increases shortage exposure and can drive allocation practices at the national level during disruptions. Bottlenecks also arise from validated sterile filling and packaging constraints, cross-border logistics, and device-service dependencies such as replacement parts, calibration, and upgrades, which tie utilization to OEM support and raise the attractiveness of vertically integrated suppliers controlling both the photosensitizer and the matched light source plus training.
Competitive Landscape
The photodynamic therapy market shows moderate fragmentation as established pharmaceutical firms acquire niche innovators to secure next-generation assets. Sun Pharmaceutical’s USD 355 million purchase of Checkpoint Therapeutics in March 2025 expands its onco-dermatology pipeline and adds an FDA-approved agent for metastatic cutaneous squamous cell carcinoma. Vertical integration models that pair proprietary photosensitizers with dedicated light systems lock in recurring consumable revenue and raise switching barriers for hospitals.
Product differentiation centers on targeted nano-formulations and AI-guided dosimetry. Biofrontera’s 2024 revenue reached USD 37.3 million, supported by proprietary device-drug combinations, though a net loss of USD 17.8 million underscores heavy R&D and commercialization costs. Theralase pursues bladder cancer with Ruvidar, reporting multi-year responses that could command premium pricing upon approval. Meanwhile, East-Asian LED makers supply cost-effective hardware, intensifying price competition but expanding the global photodynamic therapy market base.
Patent cliffs for first-generation porphyrin agents fuel urgency to launch differentiated drugs before generic erosion compresses margins. Strategic alliances with AI firms aim to automate treatment planning, promising throughput gains for outpatient centers. Across regions, market leaders invest in payer education to solidify reimbursement pathways and de-risk uptake of new indications, stabilizing cash flows even as the photodynamic therapy industry advances into less familiar therapeutic territories.
Global Photodynamic Therapy Industry Leaders
BIOFRONTERA AG
Lumibird (Quantel Medical)
Sun Pharmaceutical Industries Limited
Galderma S.A.
Bausch Health Companies Inc.
- *Disclaimer: Major Players sorted in no particular order
Global Photodynamic Therapy Market Companies Covered in this Report
- Sun Pharmaceuticals Industries
- Bausch Health
- Galderma S.A
- Biofrontera
- Modulight Corp
- Theralase Technologies Inc
- Lumibird (Quantel Medical
- Lumenis
- AngioDynamics Inc
- Johnson & Johnson (ViaVisia
- DUSA Pharmaceuticals Inc
- Cynosure LLC
- Bio-Litec AG
- Quest PharmaTech Inc
- OncoSec Medical Inc
- PhotoMedex Inc
- Sciton
- Vascular Solutions LLC
- Acceledent Inc
- TopLight Photonics Co. Ltd

Market Opportunities and Future Outlook
Opportunity is expanding where regulators and manufacturers are moving PDT beyond established actinic keratosis and skin-tumor workflows into additional oncology and organ-sparing settings. In dermatology, Biofrontera reported FDA acceptance of a supplemental NDA in March 2026 for Ameluz PDT with the RhodoLED lamp series in superficial basal cell carcinoma, with a PDUFA date set for September 28, 2026. This creates a near-term pathway for label expansion within an existing drug-device ecosystem and follows the market's ongoing shift from fluorescent to LED illuminators, which improves operational reproducibility and supports broader clinic deployment.
Clinical development activity is also creating whitespace in hospital-based oncology programs where minimally invasive, localized treatment options are valued. ImPact Biotech disclosed Phase 1 and Phase 3 clinical updates in 2026 for padeliporfin vascular targeted photodynamic therapy, including presentations tied to locally advanced pancreatic ductal adenocarcinoma and low-grade upper tract urothelial carcinoma, which shows continued efforts to standardize evidence beyond heterogeneous case series. In parallel, technology initiatives around AI-guided dosimetry and imaging-informed planning (already appearing in the market narrative) provide a practical route to reduce retreatments and improve throughput at high-volume centers, reinforcing adoption potential in ASCs and outpatient specialty clinics as procedural standardization increases.
Recent Industry Developments in Global Photodynamic Therapy Market
- March 2026: Biofrontera reported FDA acceptance of a supplemental NDA for Ameluz photodynamic therapy used with the RhodoLED lamp series to treat superficial basal cell carcinoma, with a PDUFA date set for September 28, 2026. The filing extends an established dermatology PDT franchise toward a higher-acuity skin cancer indication and strengthens the case for bundled drug-lamp adoption in clinics already using PDT.
- November 2025: Sun Pharmaceutical Industries acquired the commercial sales rights to LEVULAN KERASTICK in Canada from Clarion Medical Technologies. The move expands Sun Pharma's regional control over a key ALA photosensitizer franchise and supports tighter pairing with approved or next-generation illumination platforms in an adjacent North American market.
- June 2024: Biofrontera launched the FDA-approved RhodoLED XL red light LED lamp for use in photodynamic therapy in combination with Ameluz (aminolevulinic acid hydrochloride) 10% gel. Introducing a wider-field, dedicated LED light source reinforced the shift toward proprietary device-drug combinations that standardize treatment delivery and protect recurring consumable revenues.


Global Photodynamic Therapy Market Report Scope and Research Methodology
Market Definition and Coverage
For this study, the photodynamic therapy market is defined as the value generated from clinically used photosensitizer drugs and the light delivery systems used to activate them, across recognized medical indications where PDT is a treatment pathway.
Scope exclusions: We exclude stand-alone fluorescence imaging tools and non-medical cosmetic light panels that do not deliver PDT as a treatment.
Segments Covered in This Report
- By Product Type
- Photosensitizer Drugs
- First Generation
- Second Generation
- Third-generation / targeted nano Generation / Targeted Nano
- Devices & Light Sources
- Diode Lasers
- LED Array
- Lamps Other
- Photosensitizer Drugs
- By Application
- Oncology
- Non Melanoma Skin cancer
- Actinic Keratosis
- Head & Neck / Oral Cavity Cancer
- Lung & Esophageal Cancer
- Dermatology
- Ophthalmology
- Antimicrobial/Aesthetics
- Oncology
- By End-User (Value)
- Hospitals
- Dermatology & Skin-Cancer Clinics
- Ambulatory Surgical Centers
- Research & Academic Institutes
- By Geography
- North America
- United States
- Canada
- Mexico
- Europe
- Germany
- United Kingdom
- France
- Italy
- Spain
- Rest of Europe
- Asia-Pacific
- China
- India
- Japan
- South Korea
- Australia
- Rest of Asia-Pacific
- South America
- Brazil
- Argentina
- Rest of South America
- Middle East and Africa
- GCC
- South Africa
- Rest of Middle East and Africa
- North America
Data Sources, Market Sizing, and Validation
Desk Research
Desk work starts with building a clean clinical and regulatory map of where PDT is used and what products are actually commercialized. We rely on public sources such as the FDA databases and labeling information, NIH and NLM resources (including PubMed) for clinical evidence, the World Health Organization for disease context, and sites such as the American Cancer Society and the American Academy of Dermatology for indication and patient flow signals.
Next, the commercial layer is put in place using sources such as company annual reports, investor presentations, press releases, and reimbursement and coding references where available, so pricing logic can be kept realistic for US billing and payer practices. In parallel, patent databases and a news and financials subscription are used to track launches, approvals, and major distribution changes that can shift yearly revenue. This list is not exhaustive, and many other public sources were also checked to fill gaps, validate assumptions, and clarify unclear points.
Primary Interviews and Surveys
Primary work is used to pressure-test the desk assumptions, especially around how often PDT is chosen versus alternatives, typical care pathways, and how device and drug spending splits in real settings. We speak with a mix of clinicians, hospital procurement teams, distributors, and product specialists across key regions, and then the inputs are rechecked when the model shows unusual jumps in adoption or pricing for the affected indication.
Distribution of primary research fieldwork respondents
| Company type | Respondent position | Region |
|---|---|---|
| Top tier: 26% | CXOs: 12% | APAC: 43% |
| Mid tier: 58% | Functional/Unit leaders: 43% | EMEA: 34% |
| Smaller Players: 16% | Managers: 45% | Americas: 23% |
Market-Sizing & Forecasting
Sizing is built using top-down and bottom-up logic, where the top-down view reconstructs demand from treated patient pools and procedure intensity by key PDT indications, and then applies realistic per-treatment and per-year spending for drug and light delivery components. To keep the model grounded, inputs are guided by practical fingerprints such as prevalence and diagnosis rates for skin lesions and certain cancers, the share of eligible patients who are actually treated with PDT, typical number of sessions per patient, average selling price movement for photosensitizers, and the installed base and utilization of clinical light sources.
Once the headline totals are formed, we corroborate them with selective bottom-up approximations, such as roll-ups from a sampled set of suppliers and channel checks on unit volumes and pricing bands, so any overstatement tied to high utilization assumptions can be corrected. For forecasting, scenario analysis is used because adoption is sensitive to reimbursement changes, new indications, and device upgrade cycles, and these variables are then aligned to what interviewees expect by region. Where direct data is thin, gaps are handled through conservative proxies, like using neighboring country treatment rates adjusted for healthcare access and specialist density, before the output is reviewed again.
Data Validation & Update Cycle
Validation is done through triangulation across the demand pool, product availability, and pricing reality checks, and then the same numbers are challenged from the supply side to see if they still make sense. If large variances show up by region or indication, the assumptions are reopened, and follow-up calls are triggered to confirm whether it is a real shift or a modeling artifact.
Before sign-off, the model goes through multi-step analyst reviews that look for anomalies like abrupt share changes, unrealistic ASP inflation, or growth that exceeds patient pool expansion. Reports are refreshed annually, and interim updates are made when there are material events such as major approvals, reimbursement moves, or notable product withdrawals. Right before delivery, an analyst completes a fresh pass to ensure the latest public signals and interview notes are reflected in the final numbers.
Mordor Intelligence's Photodynamic Therapy Market Size Compared With Other Published Estimates
Published market sizes for photodynamic therapy can look far apart even when they are talking about the same treatment concept, because what gets counted differs across studies. The biggest differences usually come from scope boundaries (drug plus light system versus only one component), how treatment volumes are inferred, and whether the base year reflects the latest pricing and reimbursement situation.
By tracking installed base utilization and refreshing indication-level treated-patient assumptions, Mordor Intelligence keeps the model tied to clinical use cases and avoids mixing in adjacent light-only aesthetics revenue, which is a common source of inflation in broader healthcare optics counts.
Benchmark comparison
| Source | Market Size | Gaps in Research Methodology |
|---|---|---|
| Mordor Intelligence | USD 5.48 B (2026) | |
| Industry Publisher A | USD 1.63 B (2024) | Uses an earlier base year and a narrower monetization view in practice, where modeled revenues can undercount the combined value captured across both photosensitizers and clinical light delivery systems in routine hospital and clinic settings. |
| Industry Publisher B | USD 4.88 B (2025) | Different forecast window and base year, with assumptions that can shift totals through currency timing and how fast ASPs are assumed to normalize as LEDs and related systems get cheaper over time. |
The spread in the table is mainly explained by what is included in the billable PDT stack and how quickly utilization and pricing are allowed to change year to year. When scope and year are aligned to the same clinical workflow and validated with channel and provider checks, the resulting market size becomes easier to trace back to repeatable variables and update in a predictable way.


Key Questions Answered in the Report
How large is the photodynamic therapy market in 2026?
The photodynamic therapy market size stands at USD 5.48 billion in 2026 and is on track to reach USD 7.79 billion by 2031 at a 7.31% CAGR.
Which segment leads the photodynamic therapy market?
Photosensitizer drugs lead with 53.02% revenue share in 2025, supported by next-generation nano-formulations that shorten photosensitivity periods.
What is the fastest-growing application area?
Dermatology non-oncology indications, including acne management, are forecast to expand at a 9.08% CAGR between 2026 and 2031.
Why is Asia-Pacific considered a high-growth region?
Healthcare infrastructure upgrades, regulatory standardization in China, and cost-effective LED manufacturing underpin a projected 8.74% CAGR for Asia-Pacific through 2031.
How do reimbursement changes influence adoption?
Dedicated CPT codes and favorable insurer policies for actinic keratosis make PDT economically viable for providers, broadening patient access and supporting market expansion.
Page last updated on:


 Your data is secure and never sold or shared.


